


Abstract
Chronic kidney disease (CKD) patients show an increased burden of atherosclerosis and high risk of cardiovascular events (CVEs). There are several biomarkers described as being associated with CVEs, but their combined effectiveness in cardiovascular risk stratification in CKD has not been tested. The objective of this work is to analyse the combined ability of 19 biomarkers associated with atheromatous disease in predicting CVEs after 4 years of follow-up in a subcohort of the NEFRONA study in individuals with different stages of CKD without previous CVEs.
Nineteen putative biomarkers were quantified in 1366 patients (73 CVEs) and their ability to predict CVEs was ranked by random survival forest (RSF) analysis. The factors associated with CVEs were tested in Fine and Gray (FG) regression models, with non-cardiovascular death and kidney transplant as competing events.
RSF analysis detected several biomarkers as relevant for predicting CVEs. Inclusion of those biomarkers in an FG model showed that high levels of osteopontin, osteoprotegerin, matrix metalloproteinase-9 and vascular endothelial growth factor increased the risk for CVEs, but only marginally improved the discrimination obtained with classical clinical parameters: concordance index 0.744 (95% confidence interval 0.609–0.878) versus 0.723 (0.592–0.854), respectively. However, in individuals with diabetes treated with antihypertensives and lipid-lowering drugs, the determination of these biomarkers could help to improve cardiovascular risk estimates.
We conclude that the determination of four biomarkers in the serum of CKD patients could improve cardiovascular risk prediction in high-risk individuals.
INTRODUCTION
Chronic kidney disease (CKD) is a highly prevalent disease worldwide with a median prevalence of 7.2% in people >30 years of age, but increasing to 23–36% in individuals >64 years of age [1]. These numbers are expected to increase dramatically in the next decades, mainly due to the aging of the population and to the increase of other risk factors such as diabetes, hypertension and obesity [2]. These trends raise significant concern due to the fact that CKD patients have increased risk of major cardiovascular events (CVEs), as cardiovascular disease (CVD) is the leading cause of death in this population [3]. The increased cardiovascular risk in CKD patients seems to be associated, at least in part, with their propensity to present atheromatous plaques, as the prevalence of atherosclerotic-related events is very high [4] and the presence of plaques predicts the incidence of CVEs [5]. Today, prevention, diagnosis and prognosis of CVD in CKD patients is difficult, as the standard risk scores underestimate the cardiovascular risk in CKD patients [6, 7].
With the aim of modifying or improving current cardiovascular risk assessment algorithms, there has been an extensive search for serum biomarkers useful to predict CVEs associated with atheromatosis [8]. Atherosclerotic plaque is a manifestation of a systemic disease. Consequently, associated biomarkers can be the product of the disease itself or derive directly from the plaque [9]. Thus, published studies have focused on markers of plaque presence, instability, inflammation, neovascularization, calcification, stenosis severity and atheromatous CVEs [10, 11]. However, one of the main problems related with the search for new biomarkers is that they are usually evaluated in an isolated context and only corrected by the confounding effect of traditional risk factors in multivariable regression analysis. To date, no study has evaluated the possible role of a combination of a large number of biomarkers to predict CVEs in a CKD population.
Machine learning algorithms are powerful tools to make predictions based on large amounts of data. Among them, random forest algorithms build several decision trees. Each tree is built based on a random subsample and the rest of the sample (out-of-bag) is used to assess the model performance and the variable importance. For each node, a subset of variables is explored to determine which variable maximizes the improvement of the outcome prediction. Finally, by ensembling the results of all trees, measures of performance can be obtained [concordance index (C-index), variable importance, etc.]. Therefore, random forest could be a useful tool to assess the contribution of several biomarkers on atheromatous disease-related events.
In this context, this study was carried out with the main objective of evaluating whether 19 biomarkers previously associated with atherosclerotic disease can increase the capacity of traditional risk factors for predicting CVEs in patients with different stages of CKD and controls included in the NEFRONA cohort.
MATERIALS AND METHODS
Study design
This study included 1366 subjects from the NEFRONA [12, 13] study of which 813 presented with CKD (380 Stage 3, 304 Stages 4 and 5 and 129 dialysis) and 553 were controls without CKD (estimated glomerular filtration rate based on creatinine > 60 mL/min/1.73 m2). Briefly, NEFRONA is a multi-centre, observational, prospective study designed to assess the predictive value of non-invasive imaging techniques and biomarkers for CVEs and mortality in CKD patients. Patients 18–75 years of age and at different CKD stages were recruited in Spain from 2009 to 2012. Exclusion criteria were a history of CVEs, significant carotid stenosis, active infections (human immunodeficiency virus and tuberculosis), pregnancy, life expectancy <12 months and having received any organ transplantation or carotid artery surgery. A 4-year follow-up was performed collecting data on CVEs, both fatal and non-fatal. CVEs were defined according to the International Classification of Diseases, Ninth Revision, Clinical Modification (ICD-9-CM). Physicians responsible for the patients’ recruitment recorded the CVEs. In case of out-of-hospital death, family members were interviewed to determine death circumstances. Each local ethics committee approved the study and all included patients signed an informed consent.
Clinical data and biochemical variables
Anthropometric data [sex, age and body mass index (BMI)], clinical data [systolic and diastolic blood pressure (SBP and DBP), pulse pressure (PP)], family history of early CVD, cardiovascular risk factors (smoking, diabetes, hypertension and dyslipidaemia) and blood samples were collected by a specifically trained itinerant team formed by two technicians and a specifically trained nurse. The diagnoses of diabetes, hypertension and dyslipidaemia were obtained directly from the clinical records. Biochemical parameters were obtained from routine blood tests 3 months before or after an ultrasound was performed.
Collected blood samples were stored at −80°C in the Biobank of the RedInRen in the University of Alcala de Henares (Madrid) until biomarker determination, which was performed in a blinded manner. All biomarkers were measured using MILLIPLEX MAP kits (EMD Millipore, Burlington, MA, USA). The list of biomarkers assessed, the minimum detectable level of each biomarker as well as the information about intra- and interassay coefficients of variation are shown in the Supplementary data, Table S1.
We selected biomarkers associated with processes of atherosclerosis, focusing on inflammatory chemokines [14], proteins related to bone metabolism and calcification [15] and proteins related to plaque inflammation, progression and vascularization [10]. The other needed criteria used were the availability of MILLIPLEX MAP kits for quantification.
Atherosclerosis assessment
Atherosclerosis assessment was performed at baseline as previously described [16]. Participants underwent a carotid and femoral ultrasound in three territories of both carotid arteries (internal and common carotid arteries and carotid bulbs) and two territories of both femoral arteries (common and superficial femoral arteries). Plaques were defined according to the American Society of Echocardiography and the Mannheim carotid intima-media thickness (cIMT) Consensus as cIMT lumen protrusion ≥1.5 mm [17, 18]. Plaque presence was defined as plaque in at least one territory. Detailed protocols for plaque imaging, quantification and prevalence in the NEFRONA cohort have been published previously [19].
Statistical analysis
Qualitative variables were described with frequencies and percentages and quantitative variables with medians and 25th and 75th percentiles. Bivariate analysis by occurrence of CVEs was performed by means of the logrank test.
To discover new biomarkers for cardiovascular incidence, we performed random survival forest (RSF) analysis for competing risks [20]. The competing events to the CVEs were non-cardiovascular death and kidney transplant. We fitted two models: one with known risk factors and confounders—without biomarkers—and the other adding new potential biomarkers. Previously the same algorithm was used for missing values imputation. Additionally, quantitative variables were previously centred and scaled. No variables were excluded from analysis by near-zero variance or high pairwise correlation among predictors. Forests were grown using the modified Gray’s splitting rule, selecting variables based on their direct effect on the cumulative cardiovascular incidence. Variables were ranked by the mean decrease in prediction error [measure of variable importance (VIMP)] and the C-index) was obtained as a measure of model performance. Confidence intervals (CIs) for VIMP were calculated subsampling the survival forest [21]. Finally, we included in a Fine and Gray (FG) competing risk regression model the variables with the 5th percentile of VIMP > 0, thus ensuring 95% confidence of being relevant to the outcome of interest. The final model was selected by backward stepwise regression based on the minimum Akaike information criterion (AIC). We evaluated the calibration and discrimination of the final models. Moreover, model assumptions were assessed (linearity and proportional subhazards). When needed for validating the models, transformations of variables were used. We also provide a nomogram of the model predictions in order to simplify its interpretation.
All tests were two-sided at a significance level α = 0.05. All statistical analyses were carried out using R statistical software (R Foundation for Statistical Computing, Vienna, Austria). The randomForestSRC package was used for RSF algorithm implementation, the crrstep and riskRegression packages for FG modelling and the crskdiag package for model assumptions validation.
RESULTS
Bivariate analysis to identify biomarkers of CVEs
Over a median follow-up time of 48 months, 73 CVEs were reported: 13 in the control group, 22 in CKD Stage 3, 27 in CKD Stages 4 and 5 and 11 in the dialysis group. Higher hazards of CVEs were found for older patients, for patients with plaque at baseline and for patients in more advanced CKD stage. Moreover, patients with or being treated for diabetes, hypertension and dyslipidaemia or with the presence of atrial fibrillation showed higher hazards of having a CVE. Patients with an increased risk of a CVE also showed low levels of high-density lipoprotein (HDL) cholesterol and 25-hydroxyvitamin D3 [25(OH)D3], higher levels of triglycerides, high-sensitivity C-reactive protein (hsCRP), phosphate, potassium, SBP and PP (Table 1). In addition, cardiovascular risk was also higher for patients with higher levels of soluble vascular cell adhesion molecule (sVCAM-1), matrix metalloproteinase-9 (MMP-9), osteopontin (OPN), osteocalcin (OC), vascular endothelial growth factor (VEGF), osteoprotegerin (OPG) and monocyte chemoattractant protein 1 (MCP-1) (Table 2).
Characteristics of participants according to the occurrence of CVEs
| Variable | No event (n = 1293) | Event (n = 73) | P-value |
|---|---|---|---|
| Age (years) | 59 (49, 67) | 63 (56, 70) | <0.001 |
| Sex (female), n (%) | 557 (43.1) | 27 (37.0) | 0.286 |
| BMI (kg/m2) | 27.9 (25, 31.3) | 29.6 (25.8, 32.4) | 0.065 |
| Dyslipidaemia, n (%) | 695 (53.8) | 55 (75.3) | <0.001 |
| Lipid-lowering drugs, n (%) | 642 (49.7) | 55 (75.3) | <0.001 |
| Hypertension, n (%) | 871 (67.4) | 66 (90.4) | <0.001 |
| Antihypertensive drugs, n (%) | 850 (65.7) | 64 (87.7) | <0.001 |
| Diabetes, n (%) | 264 (20.4) | 32 (43.8) | <0.001 |
| Antidiabetic drugs, n (%) | 235 (18.2) | 30 (41.1) | <0.001 |
| Atrial fibrillation, n (%) | 16 (1.24) | 3 (4.11) | 0.030 |
| Heart failure, n (%) | 17 (1.31) | 1 (1.37) | 0.943 |
| Family history of early CVD, n (%) | 147 (11.4) | 11 (15.1) | 0.303 |
| Smoking status, n (%) | 0.136 | ||
| Non-smoker | 545 (42.2) | 26 (35.6) | |
| Current smoker | 498 (38.5) | 26 (35.6) | |
| Former smoker | 250 (19.3) | 21 (28.8) | |
| CKD stage, n (%) | <0.001 | ||
| Control | 540 (41.8) | 13 (17.8) | |
| CKD Stage 3 | 358 (27.7) | 22 (30.1) | |
| CKD Stages 4 and 5 | 277 (21.4) | 27 (37) | |
| Dialysis | 118 (9.1) | 11 (15.1) | |
| Presence of basal plaque, n (%) | 811 (62.7) | 60 (82.2) | 0.001 |
| Total cholesterol (mg/dL) | 190 (163, 214) | 180 (156, 209) | 0.101 |
| Missing values | 46 | 1 | |
| HDL cholesterol (mg/dL) | 49 (41, 61) | 44 (34, 52) | <0.001 |
| Missing values | 158 | 12 | |
| LDL cholesterol (mg/dL) | 112 (90, 136) | 111 (75, 133) | 0.168 |
| Missing values | 179 | 14 | |
| Triglycerides (mg/dL) | 112 (81, 162) | 138 (94, 181) | 0.008 |
| Missing values | 72 | 4 | |
| SBP (mmHg) | 136 (124, 151) | 149 (134, 168) | <0.001 |
| DBP (mmHg) | 80 (73, 87) | 85 (76, 89) | 0.071 |
| PP (mmHg) | 55 (46, 67) | 68 (53, 79) | <0.001 |
| Potassium (mEq/L) | 4.65 (4.31, 5) | 4.8 (4.49, 5.3) | 0.001 |
| Missing values | 88 | 2 | |
| Phosphate (mg/dL) | 3.7 (3.2, 4.2) | 3.85 (3.4, 4.4) | <0.001 |
| Missing values | 250 | 5 | |
| Calcium (mg/dL) | 9.4 (9.1, 9.7) | 9.4 (9, 9.8) | 0.851 |
| Missing values | 203 | 5 | |
| hsCRP (mg/L) | 1.93 (0.95, 4.13) | 2.25 (1.02, 6.68) | 0.004 |
| Missing values | 15 | 3 | |
| 25(OH)D3 (ng/L) | 17.3 (12.7, 21.9) | 14.7 (9.5, 20.2) | 0.003 |
| Missing values | 11 | 2 |
Italic numbers are frequencies of missing data.
Values are shown as medians and 25th and 75th percentiles unless stated otherwise. P-values correspond to the logrank test.
LDL, low-density lipoprotein.
Biomarker levels according to the occurrence of CVEs
| Variable | No event (n = 1293) | Event (n = 73) | P-value |
|---|---|---|---|
| Eotaxin (pg/mL) | 122 (84, 170) | 122 (77, 168) | 0.780 |
| Missing values | 54 | 4 | |
| FGF-2 (pg/mL) | 60 (33, 100) | 65 (39, 114) | 0.456 |
| Missing values | 50 | 4 | |
| Fractalkine (pg/mL) | 83 (48, 133) | 77 (51, 124) | 0.929 |
| Missing values | 53 | 4 | |
| GM-CSF (pg/mL) | 8.6 (4.2, 16.5) | 8.5 (2.7, 16.2) | 0.538 |
| Missing values | 53 | 4 | |
| IFN-γ (pg/mL) | 5.2 (2.9, 10.6) | 5.4 (1.9, 12.3) | 0.557 |
| Missing values | 53 | 4 | |
| IP-10 (pg/mL) | 446 (309, 689) | 451 (323, 704) | 0.271 |
| Missing values | 53 | 4 | |
| Leptin (pg/mL) | 15 627 (6822, 33 667) | 16 601 (8523, 38 389) | 0.754 |
| Missing values | 37 | 3 | |
| MCP-1 (pg/mL) | 357 (232, 534) | 358 (256, 535) | 0.028 |
| Missing values | 54 | 4 | |
| MDC (pg/mL) | 941 (709, 1220) | 903 (721, 1107) | 0.463 |
| Missing values | 54 | 4 | |
| MIP-1β (pg/mL) | 32.4 (20.6, 47.9) | 30.2 (21.3, 47.1) | 0.685 |
| Missing values | 53 | 4 | |
| MMP-9 (pg/mL) | 71 (46, 1354) | 798 (58, 2071) | 0.001 |
| Missing values | 38 | 3 | |
| MPO (ng/mL) | 27.1 (0.37, 55.8) | 4.6 (0.30, 37.3) | 0.746 |
| Missing values | 43 | 3 | |
| OC (pg/mL) | 11 501 (8226, 17 022) | 14 660 (8915, 22 649) | <0.001 |
| Missing values | 37 | 4 | |
| OPG (pg/mL) | 473 (320, 601) | 538 (370, 699) | <0.001 |
| Missing values | 37 | 3 | |
| OPN (pg/mL) | 13 209 (6049, 23 539) | 24 530 (11 471, 43 840) | <0.001 |
| Missing values | 38 | 3 | |
| PAI-1 (pg/mL) | 80 (29, 521) | 262 (36, 773) | 0.074 |
| Missing values | 37 | 3 | |
| sICAM-1 (pg/mL) | 147 (107, 624) | 293 (108, 758) | 0.243 |
| Missing values | 38 | 3 | |
| sVCAM-1 (pg/mL) | 27 (17, 8889) | 7449 (20, 10 747) | 0.002 |
| Missing values | 37 | 3 | |
| VEGF (pg/mL) | 81 (38, 153) | 88 (45, 161) | 0.046 |
| Missing values | 52 | 4 |
Italic numbers are frequencies of missing data.
Values are shown as medians and 25th and 75th percentiles. P-values correspond to the logrank test.
FGF-2, fibroblast growth factor 2; GM-CSF, granulocyte-macrophage colony-stimulating factor; IP-10, IFN-γ inducible protein 10; MDC, macrophage-derived chemokine; MIP-1β, macrophage inflammatory protein-1beta; MPO, myeloperoxidase; PAI-1, plasminogen activator inhibitor-1; sICAM-1, soluble intercellular adhesion molecule-1.
RSF analysis to identify biomarkers of CVEs
RSF performed without biomarkers showed that the 10 most important variables for CVE prediction were SBP, PP, diabetes, being treated for dyslipidaemia, hypertension, DBP, being treated for diabetes, CKD stage, being treated for hypertension and HDL cholesterol (Figure 1a). When biomarkers were included alongside clinical variables in the RSF analysis, OPN was the most relevant predictor of the incidence of CVEs, followed by PP, SBP and diabetes. OPG also appeared as a potential predictor of cardiovascular risk (Figure 1b). VIMP values for all variables are shown in the Supplementary data, Table S2. Overall discrimination without biomarkers was 0.678 (95% CI 0.649–0.710) and improved when biomarkers were included [0.716 (95% CI 0.689–0.746)].
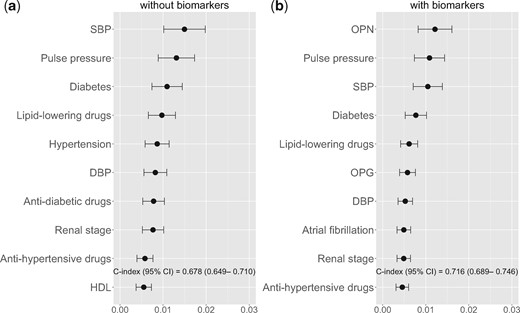
Variable importance from the RSF analysis for cardiovascular risk: the top 10 features ranked by mean decrease in prediction error. (a) RSF including only clinical variables and (b) the top 10 features considering clinical variables and biomarkers.
With the most promising variables (those with 95% of VIMP values >0), we performed a multivariate FG competing risks model for cardiovascular incidence (Table 3). Of the traditional risk factors considered, being treated with lipid-lowering drugs and having lower levels of HDL cholesterol showed a significantly increased risk for CVEs. Regarding biomarkers, higher values of OPG, MMP-9, VEGF and OPN were statistically significant predictors of increased cardiovascular risk. Other predictors [interferon gamma (IFN-γ), diabetes, being treated for hypertension, total cholesterol and age] were kept in the model as their inclusion improved the AIC. In order to meet the model assumptions, base-2 logarithm transformations for OPG and OPN were used.
Multivariate FG competing risks model for cardiovascular incidence
| Variable | Hazard ratioa (95% CI) | P-value |
|---|---|---|
| log2 OPG | 12.3 (3.39–44.6) | <0.001 |
| MMP-9 | 1.24 (1.07–1.42) | 0.003 |
| VEGF | 1.27 (1.06–1.53) | 0.010 |
| log2 OPN | 1.33 (1.07–1.66) | 0.011 |
| HDL cholesterol | 0.69 (0.50–0.96) | 0.026 |
| Lipid-lowering drugs | 1.90 (1.07–3.35) | 0.028 |
| SBP | 1.25 (0.99–1.58) | 0.059 |
| IFN-γ | 0.86 (0.73–1.01) | 0.072 |
| Diabetes | 1.65 (0.95–2.88) | 0.075 |
| Antihypertensive drugs | 1.74 (0.88–3.44) | 0.110 |
| Total cholesterol | 1.19 (0.93–1.53) | 0.160 |
| Age | 1.20 (0.90–1.60) | 0.200 |
Hazard ratio corresponds to an increase of 1 standard deviation (SD) for continuous predictors (except OPG and OPN). For OPG and OPN, hazard ratio corresponds to an increase of 2-fold difference in their scaled values. Variable (SD): MMP-9 (1360), VEGF (361), HDL cholesterol (15.5), SBP (20.3), IFN-γ (159), total cholesterol (38.8), age (12.2), OPG (414), OPN (28 657).
The discrimination ability of the competing risks model without biomarkers at 48 months was moderately high [0.723 (95% CI 0.592–0.854)]. As shown in Figure 2, the inclusion of biomarkers slightly increased the C-index [0.744 (95% CI 0.609–0.878)]. Figure 3 shows the adjusted cumulative cardiovascular incidence, according to the FG model with biomarkers, corresponding to four risk groups defined by the presence or absence of diabetes and being or not treated with both lipid-lowering and antihypertensive drugs. Significant biomarkers—OPN, OPG, MMP-9 and VEGF—were set to their 25th and 75th percentiles. The patients with diabetes and treated with both drugs are those suffering major impacts on absolute cardiovascular risk of higher levels of biomarkers.
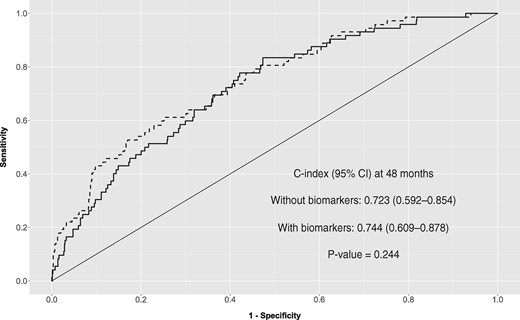
ROC curve for prognostic values from both FG regression models, without and with biomarkers.

Adjusted cumulative cardiovascular incidence obtained with the FG regression model with biomarkers (Table 3). Population was stratified according to diabetes and being treated with lipid-lowering and antihypertensive drugs. Quantitative variables (except significant biomarkers) were set at their median value: HDL cholesterol = −0.104, SBP = −0.119, IFN-γ = −0.084, total cholesterol = −0.024, age = 0.178. Significant biomarkers at their 25th percentile (solid line) and 75th percentile (dashed line): OPG = −0.471 and 0.195, MMP-9 = −0.618 and 0.371, VEGF = −0.323 and 0.039, OPN = −0.552 and 0.095.
Finally, to better visualize our model predictions, we obtained a nomogram illustrating a representative patient of our cohort (Figure 4). The cumulative incidence estimate of CVEs at 48 months for this representative patient was 0.041.
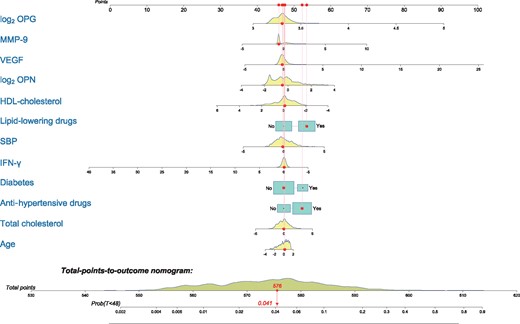
Nomogram for predicting cumulative risk of CVEs at 48 months with the FG model. As a cohort’s representative, we illustrated a patient with the cohort median values for continuous variables, without diabetes and being treated with lipid-lowering and antihypertensive drugs. With these characteristics, the probability of suffering a CVE after 4 years is estimated to be 4.1%.
DISCUSSION
In this study we explored the role of 19 serum biomarkers previously shown to be associated with atheromatosis in improving CVE prediction in a cohort mainly composed of CKD patients. The main result of our analysis is that the addition of biomarkers marginally improved the discrimination ability obtained with only traditional risk factors in CKD. Despite this, OPN was the most relevant predictor of CVEs in RSF analysis. Thus when biomarkers were not included in RSF, clinical parameters with higher prediction ability were PP and SBP, data that agree with previous results [22], and the third most relevant clinical parameter was diabetes, also linked to CVEs in the CKD population [23]. Moreover, when the most promising variables in the RSF analysis were included in an FG regression, higher levels of OPN, OPG, VEGF and MMP-9 were significantly associated with a higher incidence of CVEs, along with traditional factors such as HDL cholesterol and being treated for dyslipidaemia.
Our group has previously identified predictors of CVEs in the NEFRONA cohort. First, we focused on clinical variables and routine clinical analytics to find predictors of CVEs. Sex, CKD, 25(OH)-vitamin D3, cholesterol and subclinical atheromatosis were identified as the main predictors [5]. The inclusion of biomarkers in this analysis overruled the effect of all of them, maybe reflecting that the biomarkers selected have a strong relationship with the atherosclerotic process. Moreover, we cannot rule out that the inclusion of medications also reduced the effect of some clinical variables. In a second work [11] we identified OPN and OPG as factors significantly associated with CVEs. soluble tumor necrosis factor-like weak inducer of apoptosis (sTWEAK) also showed an independent association, but was not included in this work as it was missed in 50% of our samples. In the mentioned study, since we only tried to identify whether they were independently associated with the events, we did not test the improvement of prediction added by the biomarkers or rank the variables as we did in the present work. Furthermore, in this study we identified that patients with diabetes and treated for dyslipidaemia and hypertension could benefit from the determination of biomarkers, as these patients are suffering major impacts on absolute cardiovascular risk of higher biomarker levels. It should be noted that being treated for dyslipidaemia or hypertension can be considered similar to presenting with these comorbidities.
The search for serum biomarkers with potential prognostic ability for CVEs is a very active field of study. However, although results sometimes are confirmed in independent cohorts, a very small number make it to the clinic [24]. This fact could be due to the very high level of heterogeneity of the populations and to the existence of many confounding factors that are not taken into account in the data collection [25]. Furthermore, many biomarkers might be related between them due to biological interactions in the signalling pathways that cannot be identified when analysed in an independent manner.
By applying RSF, we found a marginal improvement in accuracy when adding potential biomarkers to the traditional risk factors. However, our data show that OPN has high prediction ability for CVE incidence, even higher than well-described clinical variables such as SBP and diabetes [3, 26, 27]. OPN is an extracellular matrix glycoprotein that participates in cell-to-cell contact mechanisms; its levels increase in different models of atherosclerosis [28] and it has been found to be associated with cardiovascular risk in CKD patients [29]. The other biomarker with good performance in prognosis, when considered together with clinical variables, is OPG. The glycoprotein OPG is a member of the tumour necrosis factor–related family, and part of the receptor activator of nuclear factor-kappaB (RANK)–RANK ligand (RANKL)–OPG network. Higher levels of OPG have been associated with coronary atherosclerosis in several studies [30, 31] and in CKD, dialysis and kidney transplant patients it has been further associated with adverse events [32–34]. These associations were also found with the FG analysis, so both OPN and OPG were predictors included in the final model for cardiovascular risk.
The final FG competing risk model also included MMP-9 and VEGF. MMP-9 has been associated with plaque instability and CVEs [35], and its serum levels have been found to be correlated to carotid atherosclerosis in CKD patients [36]. VEGF is an angiogenic molecule crucial for endothelial integrity and it also contributes to plaque formation and destabilization [26], its levels are increased in CKD [27] and it has been identified in haemorrhagic arterial plaques of CKD patients [37]. We also plotted a nomogram to visualize our model predictions, allowing us to quickly predict the cumulative risk of CVEs at 48 months for any patient by knowing only the 12 selected variables.
One strength of this study is the large sample size, including participants without previous CVEs of a prospective observational study, and the consideration of 19 different biomarkers together with clinical variables. Thus, including the most promising features in cardiovascular risk assessment could improve the prediction ability of current risk scales. Random forest is a versatile analysis method that usually provides good results when compared with alternative algorithms, such as support vector machines, neural networks or some boosting algorithm, which also usually take much longer to build and tune. The random forest also has the advantage of offering greater interpretability. Thus we believe that the RSF algorithm used in this study is useful and appropriate. We would like to point out that the mean decrease in prediction error was chosen as a measure of variable importance in order to rank variables in RSF since that is the most common measure used for this purpose. Nevertheless, other measures have been proposed in RSF analysis [38], so different rankings could have been obtained if other measures had been used. Also, there are alternatives to selecting the FG regression model. Other possible criteria could have resulted in models with different predictors. Finally, we want to point out that the prediction ability of the clinical factors and the biomarkers included in this study could vary with different follow-up times.
Our study has several limitations. First, the small number of CVEs may have limited the capacity to more clearly identify predictors of cardiovascular risk and therefore limit the conclusions of this study. Machine learning algorithms, like random forest used in this analysis, help to partly overcome this limitation and allow identification of strong predictors in problems with bad signal:noise ratios. Second, detection of the biomarkers was performed by multiplex analysis. Although the method is very useful to detect multiple analytes in small amounts of sample, it should be validated with individual enzyme-linked immunosorbent assay (ELISA) kits. A third limitation is that, as a consequence of the NEFRONA study design, subjects that received a kidney transplant during the follow-up were not followed for CVE assessment, but this limitation was overcome by performing cumulative incidence analysis with a competing risks approach. Furthermore, only a portion of the cohort had samples available to perform the multiplex analysis, so the subsample could not be representative of the whole cohort. Another important limitation is the lack of data on coronary calcium scores, which have shown great power in CVE prediction in the CKD population [39]. Other variables such as changes in medication or poor BP control may affect the outcome and were not recorded. In addition, a single measurement of biomarkers may not be representative and may not directly predict the outcome. Finally, we would like to mention that out-of-hospital death causes were based on family interviews, which could introduce some bias in our study.
In summary, our study confirmed previous results obtained about clinical risk factors with the capacity to predict CVEs in CKD patients. Although a deep and flexible analysis by RSF found no relevant improvement in discrimination ability added by the potential biomarkers assessed in this study, OPN was identified as the best biomarker for possible use in future scales or algorithms to predict CVEs in CKD patients. The parametric competing risks modelling determined that, among all the biomarkers studied, OPN, OPG, VEGF and MMP-9 could be used in combination to predict CVEs in CKD patients. Individuals with diabetes, dyslipidaemia and hypertension could benefit from interventions lowering levels of these biomarkers to decrease cardiovascular risk.
FUNDING
This study was funded by the intramural programme of the IRBLleida, the Instituto de Salud Carlos III (RETIC RD16/0009, PI15/00960, and PI16/01354) and FEDER funds.
AUTHORS’ CONTRIBUTIONS
J.M.V., M.B., S.C. and C.F. contributed to the study concept and design. M.B. was involved in data acquisition. J.M.V., S.C., E.F. and M.B.-L. were responsible for data interpretation. C.F., S.C. and J.M.V. contributed to statistical analysis. S.C., C.F. and J.M.V. contributed to drafting of the manuscript. All authors contributed to critical revision of the manuscript for important intellectual content. J.M.V. contributed to study supervision. NEFRONA investigators collected baseline and prospective follow-up data of the cohort.
CONFLICT OF INTEREST STATEMENT
None declared.
REFERENCES
APPENDIX
NEFRONA investigators
The authors thank Eva Castro, Virtudes María, Teresa Molí, Teresa Vidal, Meritxell Soria and the Biobank of RedInRen for their invaluable support. The NEFRONA study investigator group is composed of the following: José Aladrén Regidor (Hospital Comarcal Ernest Lluch, Calatayud); Jaume Almirall, Esther Ponz (Corporació Parc Taulí, Barcelona); Jesús Arteaga Coloma (Hospital de Navarra, Pamplona); Auxiliadora Bajo Rubio, Raquel Díaz (Hospital La Paz, Madrid); Montserrat Belart Rodríguez (Sistemes Renals, Lleida); Antonio Gascón (Hospital Obispo Polanco, Teruel); Jordi Bover Sanjuan (Fundació Puigvert, IIB Sant Pau, Barcelona); Josep Bronsoms Artero (Clínica Girona, Girona); Juan B. Cabezuelo Romero, Salomé Muray Cases (Hospital Reina Sofía, Murcia); Jesús Calviño Varela (Hospital Universitario Lugus Augusti, Lugo); Pilar Caro Acevedo (Clínica Ruber, Madrid); Jordi Carreras Bassa (Diaverum Baix Llobregat, Barcelona); Aleix Cases Amenós, Elisabet Massó Jiménez (Hospital Clínic, Barcelona); Rosario Moreno López (Hospital de la Defensa, Zaragoza); Secundino Cigarrán Guldris, Saray López Prieto (Hospital Da Costa, Lugo); Lourdes Comas Mongay (Hospital General de Vic, Barcelona); Isabel Comerma (Hospital General de Manresa, Barcelona); Teresa Compte Jové (Hospital Santa Creu Jesús, Tarragona); Marta Cuberes Izquierdo (Hospital Reina Sofía, Navarra); Fernando de Álvaro, Covadonga Hevia Ojanguren (Hospital Infanta Sofía, Madrid); Gabriel de Arriba de la Fuente (Hospital Universitario Guadalajara, Guadalajara); Dolores del Pino y Pino (Complejo Hospitalario Universitario Torrecardenas, Almería); Rafael Diaz-Tejeiro Izquierdo, Francisco Ahijado Hormigos (Hospital Virgen de la Salud, Toledo); Marta Dotori (USP Marbella, Málaga); Verónica Duarte (Hospital de Terrassa, Barcelona); Sara Estupiñan Torres (Hospital Universitario Canarias, Santa Cruz de Tenerife); José Fernández Reyes (Hospital de Segovia, Segovia); Loreto Fernández Rodríguez (Hospital Príncipe de Asturias, Madrid); Guillermina Fernández (Clínica Santa Isabel, Sevilla); Antonio Galán Serrano (Hospital General Universitario de Valencia, Valencia); Cesar García Cantón (Hospital Universitario Insular de Gran Canaria, Las Palmas); Antonio L. García Herrera (Hospital Universitario Puerto Real, Cádiz); Mercedes García Mena (Hospital San Juan de Dios, Zaragoza); Luis Gil Sacaluga, Maria Aguilar (Hospital Virgen del Rocío, Sevilla); José Luis Górriz (Hospital Universitario Doctor Peset, Valencia); Emma Huarte Loza (Hospital San Pedro, Logroño); José Luis Lerma (Hospital Universitario Salamanca, Salamanca); Antonio Liebana Cañada (Hospital de Jaén, Jaén); Jesús Pedro Marín Álvarez (Hospital San Pedro de Alcántara, Cáceres); Nádia Martín Alemany (Hospital Josep Trueta, Girona); Jesús Martín García (Hospital Nuestra Señora de Sonsoles, Ávila); Alberto Martínez Castelao (Hospital Universitari de Bellvitge, Barcelona); María Martínez Villaescusa (Complejo Hospitalario Universitario de Albacete, Albacete); Isabel Martínez (Hospital Galdakao, Bilbao); Iñigo Moina Eguren (Hospital Basurto, Bilbao); Silvia Moreno Los Huertos (Hospital Santa Bárbara, Soria); Ricardo Mouzo Mirco (Hospital El Bierzo, Ponferrada, León); Antonia Munar Vila (Hospital Universitari Son Espases, Palma de Mallorca); Ana Beatriz Muñoz Díaz (Hospital Virgen del Consuelo, Valencia); Juan F. Navarro González (Hospital Universitario Nuestra Señora de Candelaria, Santa Cruz de Tenerife); Javier Nieto, Agustín Carreño (Hospital General Universitario de Ciudad Real, Ciudad Real); Enrique Novoa Fernández (Complexo Hospitalario de Ourense, Ourense); Alberto Ortiz, Beatriz Fernandez (IIS-Fundación Jiménez Díaz, Madrid); Vicente Paraíso (Hospital Universitario del Henares, Madrid); Miguel Pérez Fontán (Complejo Hospitalario Universitario A Coruña, Coruña); Ana Peris Domingo (Hospital Francesc de Borja, Valencia); Celestino Piñera Haces (Hospital Universitario Marqués de Valdecilla, Santander); Dolores Prados Garrido (Hospital Universitario San Cecilio, Granada); Mario Prieto Velasco (Hospital de León, León); Carmina Puig Marí (Hospital d’Igualada, Barcelona); Maite Rivera Gorrín (Hospital Universitario Ramón y Cajal, Madrid); Esther Rubio (Hospital Puerta del Hierro, Madrid); Pilar Ruiz (Hospital Sant Joan Despí Moisès Broggi, Barcelona); Mercedes Salgueira Lazo, Ana Isabel Martínez Puerto (Hospital Virgen Macarena, Sevilla); José Antonio Sánchez Tomero (Hospital Universitario de la Princesa, Madrid); José Emilio Sánchez (Hospital Universitario Central de Asturias, Oviedo); Ramon Sans Lorman (Hospital de Figueres, Girona); Ramon Saracho (Hospital de Santiago, Vitoria); Maria Sarrias, Daniel Serón (Hospital Universitari Vall d’Hebron, Barcelona); María José Soler, Clara Barrios (Hospital del Mar, Barcelona); Fernando Sousa (Hospital Rio Carrión, Palencia); Daniel Toran (Hospital General de Jerez, Cadiz); Fernando Tornero Molina (Hospital de Sureste, Arganda del Rey); José Javier Usón Carrasco (Hospital Virgen de la Luz, Cuenca); Ildefonso Valera Cortes (Hospital Virgen de la Victoria, Málaga); Merce Vilaprinyo del Perugia (Institut Catala d’Urologia i Nefrologia, Barcelona); Rafael C. Virto Ruiz (Hospital San Jorge, Huesca); Vicente Pallarés Carratalá (Clínica MEDEFIS, Vila-real, Castellón); Carlos Santos Altozano (CS Azuqueca de Henares, Guadalajara); Miguel Artigao Ródenas (CS Zona III, Albacete); Inés Gil Gil (Área Básica Sanitaria de Arán, CAP Viella, Lleida); Francisco Adan Gil (CS Alfaro, La Rioja); Emilio García Criado (Centro de Salud del Carpio, Córdoba); Rafael Durá Belinchón (CS Godella, Valencia); Jose M. Fernández Toro (CS Zona Centro, Cáceres); Juan A. Divisón Garrote (Centro de Salud de Casas Ibáñez, Consultorio de Fuentealbilla, Albacete).
Author notes
Carles Forné and Serafi Cambray contributed equally to this work.
Listed in the Appendix.


Comments