


Abstract
Epicardial adipose tissue (EAT) exerts cardiopathogenic effects, but the independent association between EAT and cardiovascular (CV) calcification in patients with chronic kidney disease (CKD) remains controversial. We therefore assessed the association between EAT, CV risk factors and CV calcifications.
257 patients with CKD Stage 3 and/or overt proteinuria underwent quantification of EAT, coronary artery calcification and aortic valve calcification by computed tomography. Framingham and American College of Cardiology and American Heart Association (ACC-AHA) 10-year CV event risk scores were calculated for each patient.
Using multivariable regression analysis, higher EAT was significantly associated with the majority of investigated risk factors {higher age: odds ratio [OR] 1.05/year [95% confidence interval (CI) 1.02–1.08]; male sex: OR 4.03 [95% CI 2.22–7.31]; higher BMI: OR 1.28/kg/m2 [95% CI 1.20–1.37]; former smoking: OR 1.84 [95% CI 1.07–3.17]; lower high-density lipoprotein cholesterol: OR 0.98/mg/dL [95% CI 0.96–1.00] and lower estimated glomerular filtration rate: OR 0.98/mL/min/1.73 m2 [95% CI 0.97–0.99]; all P < 0.05} and was not associated with diabetes mellitus, hypertensive nephropathy, total cholesterol and albuminuria. EAT was positively associated with higher ACC-AHA and Framingham risk scores. EAT correlated with coronary artery calcification and aortic valve calcification [Spearman ρ = 0.388 (95% CI 0.287–0.532) and rrb = 0.409 (95% CI 0.310–0.556), respectively], but these correlations were dependent on CV risk factors.
The increase of EAT can be explained by individual CV risk factors and kidney function and correlates with 10-year risk for CV event scores, suggesting that EAT is a modifiable risk factor in patients with CKD. Although EAT correlates with CV calcifications, these relations depend on CV risk factors.
INTRODUCTION
Cardiovascular diseases (CVDs) constitute the main causes of morbidity and mortality in patients with chronic kidney disease (CKD) [1]. While it is accepted that coronary artery calcification (CAC) and aortic valve calcification (AVC) can be used as independent predictors of incident CVD and all-cause mortality in the general population and in patients with CKD [2–4], epicardial adipose tissue (EAT) attracts increasing attention as a novel risk predictor for these outcomes. EAT, a visceral fat depot, covers coronary arteries and myocardium and is a potential player in the pathogenesis of CVD through paracrine and vasocrine secretion of pro-inflammatory and pro-atherogenic cytokines into the myocardial structures [5]. EAT can be easily measured with echocardiography, computed tomography (CT) or other imaging procedures and is modifiable by lifestyle [6] or pharmaceutical interventions (e.g. anti-diabetic medications or statins) [7, 8].
Several studies have reported a strong correlation between EAT and CAC [9, 10]. However, a recent systemic review and meta-analysis comprising >41 000 subjects indicated that EAT volume remained borderline significant with CAC {odds ratio [OR] 1.007 [95% confidence interval (CI) 1.000–1.011]} after adjustment for established cardiovascular (CV) risk factors in low- to intermediate-risk patients [11]. Although EAT correlates with visceral fat accumulation and other CV risk factors, and despite the weak independent association with CAC [10, 12], the meta-analysis revealed that EAT volume is independently associated with CV events [11], provoking further speculation about whether EAT may be linked with CV events by different signalling pathways such as non-calcified coronary plaques or valvular disease. Whether EAT per se is associated with CAC in a high-risk population such as patients with CKD or whether this association results from shared CV risk factors remains controversial [12, 13]. Moreover, data about the correlation of EAT with established CV event risk scores are lacking. EAT volume is independently associated with myocardial ischaemia [11] and atrial fibrillation [14], and AVC or stenosis, in addition to coronary artery disease, may contribute to this association. Therefore the aims of this study were (i) to assess in a multicentre cohort of patients with CKD Stage 3 and/or overt proteinuria the association of CT measures of EAT, CAC and AVC with multiple CV risk factors including estimated glomerular filtration rate (eGFR) and urine albumin:creatinine ratio (UACR); (ii) to show the prevalence and distribution of EAT, CAC and AVC across two different risk strata [10-year Framingham risk score (FRS) and American College of Cardiology and American Heart Association (ACC-AHA) 10-year atherosclerotic CVD (ASCVD) risk score] and (iii) to examine the association of EAT with coronary as well as AVC burden after adjusting for CV risk factors.
MATERIALS AND METHODS
Study design and population
The Cardiovascular In Depth Assessment (CARVIDA) is a substudy of the German Chronic Kidney Disease (GCKD) study. CARVIDA aims to provide detailed CV profiling in order to understand the increased CV risk observed in patients with CKD. The design, methodology and baseline data of the GCKD have been reported previously in detail [15, 16]. In brief, 5127 patients with CKD were included on the basis of an eGFR of 30–60 mL/min/1.73 m2 (CKD Stage 3) and/or overt proteinuria (UACR >300 mg/g, albuminuria >300 mg/day, urinary protein:creatinine >500 mg/g or proteinuria >500 mg/day) in the presence of eGFR >60 mL/min/1.73 m2. Patients after solid organ or bone marrow transplantation, with active malignancy within 24 months before screening, heart failure in New York Heart Association functional Class IV, representation by a legal guardian or inability to provide consent were excluded. The GCKD and CARVIDA studies have been approved by local ethics committees (EK 271/11), conform to the principles outlined in the Declaration of Helsinki and GCKD is registered in the national registry for clinical studies (Deutsches Register Klinischer Studien 00003971). A written informed consent was obtained from all participants.
CARVIDA was conducted in three of the nine regional GCKD centres in Germany (Aachen, Erlangen and Würzburg). A total of 322 patients were enrolled in CARVIDA across the three sites. Every participant completed a standardized questionnaire concerning CV risk factors and medical history. All information was validated by referring to the respective individual’s medical records. Disease, comorbidity and other parameter definitions were used according to international standards [17]. Plasma, serum, blood and spot urine samples were collected, processed and shipped frozen to a central laboratory for routine clinical chemistry of a core set of parameters (Synlab, Heidelberg, Germany). GFR values were estimated using the Chronic Kidney Disease Epidemiology Collaboration formula. From all patients enrolled in CARVIDA, 65 patients did not undergo the CT measurements, most commonly because of claustrophobia, exceeded the maximum weight capacity for CT, declined CT or were excluded from further analysis because of coronary stents or prior aortic valve surgery, leaving 257 patients for the present study.
The 10-year FRS for CVD events (coronary death, myocardial infarction, coronary insufficiency, angina, ischaemic stroke, haemorrhagic stroke, transient ischaemic attack, peripheral artery disease, heart failure) (https://www.framinghamheartstudy.org/fhs-risk-functions/cardiovascular-disease-10-year-risk/) (11 March 2019, date last accessed) [18] was calculated for those providing values within the validated range of the Framingham risk equation [age 30–74 years, systolic blood pressure 90–200 mmHg, high-density lipoprotein (HDL) cholesterol 10–100 mg/dL, total cholesterol 100–405 mg/dL]. In addition, the 10-year ASCVD event risk [coronary heart disease (CHD), death, non-fatal myocardial infarction or fatal or non-fatal stroke] was calculated based on a publication by Goff et al. [19] from the ACC-AHA for those values within the validated range of the ASCVD risk equation (age 40–79 years, total cholesterol 130–320 mg/dL, HDL cholesterol 20–100 mg/dL, systolic blood pressure 90–200 mmHg) (http://www.cvriskcalculator.com) (11 March 2019, date last accessed).
CT imaging
CT imaging was performed in all three centres on a second- or third-generation Dual Source CT scanner (SOMATOM Definition Flash or Force, Siemens, Forchheim, Germany). Electrocardiography (ECG)-synchronized CT with standard settings (voltage 120 kV, automatic tube current modulation, collimation 2 × 64 × 0.6 mm or 2 × 96 × 0.6 mm) were used for examining the scan volume between tracheal bifurcation and diaphragm next to the heart. Image reconstruction was performed using a 3.0 mm slice thickness, 1.5 mm increment and 180 mm2 field of view and a standardized medium sharp convolution kernel was used. No contrast agent was injected. CAC was defined as an area of more than two connected voxels with an attenuation >130 Hounsfield units (HUs), which corresponds to a minimal lesion area of >1 mm2. CAC was identified for the coronary arteries by calculating the lesion volume in cubic millimetres, the calcium mass in milligrams and the calcium score according to the method described by Agatston et al. [20]. In conformity with CAC measurement, AVC was considered present at an area of more than two connected voxels with an attenuation >130 HU. Similar to CAC measurement, a modified Agatston score as well as volume and mass scores were computed for the aortic valve. EAT was defined as fat located between the heart and pericardium, enclosed by the visceral pericardium. EAT was measured in cubic centimetres by freehand, layer-by-layer region of interest–based analysis and defined as an area of more than two connected voxels with an attenuation between −190 and −40 HU.
Statistical analysis
Results are expressed as number (%) for categorical variables, as mean (SD) for normally distributed continuous variables and as median [interquartile range (IQR)] for continuous variables with skewed distribution. Ordinal regression analysis was used to test for trends in baseline characteristics across quartiles of EAT and CAC. Ordinal regression analysis was also used to test for trends of EAT, CAC and AVC across CV risk strata. For the respective comparison of patients with and without AVC, logistic regression analysis was employed. For regression models, we selected two covariates representing kidney function (eGFR, UACR) and those variables incorporated in the Framingham or ASCVD risk equation: age, sex, body mass index (BMI), smoking, diabetes mellitus, hypertensive nephropathy (instead of systolic blood pressure) and total and HDL cholesterol. Results from ordinal/logistic regression are presented as ORs with 95% CIs. Correlation between EAT and CAC as well as between EAT and CV risk score were explored with Spearman’s rank correlation coefficient. Correlation between EAT and AVC was explored with biserial rank correlation. All P-values were two-tailed and P-values <0.05 were considered significant. The statistical analysis was performed with SAS 9.4 (SAS Institute, Cary, NC, USA).
RESULTS
Clinical characteristics and unadjusted association between CV risk factors and EAT
Detailed sample characteristics are shown in Table 1. A total of 257 patients (mean age 61 ± 11 years; 62% male) underwent native cardiac CT (Table 1). As shown before, clinical characteristics were similar in the patients enrolled in the current CARVIDA substudy to those of the parent GCKD study [16].
Characteristics of patients with CKD by quartiles of EAT volume (cm3) (n = 257)
| Parameters | Total | Q1 | Q2 | Q3 | Q4 | P-value |
|---|---|---|---|---|---|---|
| (n = 257) | (n = 65) | (n = 64) | (n = 64) | (n = 64) | ||
| EAT (cm3), mean ± SD (range) | 127 ± 58 (28–328) | 61 ± 13 (28–81) | 101 ± 12 (81–121) | 140 ± 12 (122–162) | 207 ± 36 (163–328) | – |
| Age (years), mean ± SD | 61 ± 11 | 55 ± 13 | 59 ± 12 | 64 ± 10 | 66 ± 8 | <0.0001 |
| Male sex, n (%) | 158 (62) | 20 (31) | 38 (59) | 47 (73) | 53 (83) | <0.0001 |
| Smoking, n (%) | ||||||
| Non-smoker | 105 (41) | 37 (54) | 25 (42) | 23 (36) | 20 (31) | |
| Former smoker | 124 (48) | 20 (31) | 33 (52) | 28 (44) | 43 (67) | 0.0036 |
| Current smoker | 28 (11) | 10 (15) | 6 (9) | 4 (6) | 8 (12) | |
| BMI (kg/m2), mean ± SD | 28.3 ± 4.7 | 25.0 ± 4.3 | 27.7 ± 4.2 | 29.6 ± 4.0 | 31.2 ± 4.1 | <0.0001 |
| Body surface area (m2), mean ± SD | 2.0 ± 0.2 | 1.8 ± 0.2 | 2.0 ± 0.2 | 2.1 ± 0.2 | 2.2 ± 0.2 | <0.0001 |
| Hip circumference (cm), mean ± SD | 105 ± 11 | 99 ± 9 | 103 ± 9 | 107 ± 10 | 110 ± 11 | <0.0001 |
| Waist circumference (cm), mean ± SD | 102 ± 14 | 90 ± 11 | 98 ± 10 | 106 ± 9 | 114 ± 13 | <0.0001 |
| Hypertension, n (%) | 241 (94) | 59 (91) | 57 (89) | 62 (97) | 63 (98) | 0.0397 |
| SBP (mmHg), mean ± SD | 133 ± 16 | 134 ± 16 | 130 ± 14 | 132 ± 16 | 135 ± 18 | 0.3794 |
| DBP (mmHg), mean ± SD | 82 ± 11 | 85 ± 11 | 81 ± 9 | 82 ± 11 | 78 ± 12 | <0.0001 |
| Hypertensive nephropathy, n (%) | 70 (27) | 8 (12) | 15 (23) | 20 (31) | 27 (42) | <0.0001 |
| Diabetes mellitus, n (%) | 59 (23) | 9 (14) | 16 (25) | 8 (13) | 26 (41) | 0.0025 |
| CHD, n (%) | 21 (8) | 2 (3) | 1 (2) | 7 (11) | 11 (17) | 0.0008 |
| Family history of heart attack, n (%) | 94 (37) | 23 (36) | 24 (38) | 24 (38) | 23 (36) | 0.779 |
| Coronary artery calcium score (Agatston), median (IQR) | 45.6 (305.7) | 0.0 (0.0) | 49.1 (312.7) | 66.7 (376.7) | 129.4 (589) | <0.0001 |
| AVC score (Agatson), median (IQR) | 0.0 (14.4) | 0.0 (0.0) | 0.0 (3.3) | 0.0 (15.4) | 0.15 (40.5) | <0.0001 |
| Laboratory findings | ||||||
| eGFR (mL/min/1.73 m²), mean ± SD | 52 ± 19 | 58 ± 19 | 55 ± 20 | 52 ± 19 | 46 ± 15 | 0.0009 |
| UACR (mg/g), median (IQR) | 66 (381) | 83 (358) | 92 (454) | 38 (436) | 84 (331) | 0.8097 |
| Total cholesterol (mg/dL), median (IQR) | 202 (56) | 206 (60) | 207 (57) | 205 (52) | 191 (52) | 0.0319 |
| HDL cholesterol (mg/dL), median (IQR) | 49 (24) | 65 (23) | 49 (22) | 46 (13) | 42 (19) | <0.0001 |
| LDL cholesterol (mg/dL), median (IQR) | 115 (51) | 115 (49) | 122 (55) | 122 (55) | 104 (39) | 0.1166 |
| Triglyceride (mg/dL), median (IQR) | 158 (103) | 109 (87) | 156 (78) | 187 (98) | 182 (126) | <0.0001 |
| Phosphate (mmol/L), median (IQR) | 0.99 (0.18) | 0.99 (0.15) | 0.99 (0.16) | 1.01 (0.21) | 0.98 (0.24) | 0.8157 |
| Calcium (mmol/L), median (IQR) | 2.29 (0.13) | 2.30 (0.13) | 2.27 (0.13) | 2.28 (0.13) | 2.29 (0.11) | 0.6412 |
| Uric acid (µmol/L), mean ± SD | 425 ± 98 | 393 ± 89 | 415 ± 88 | 441 ± 105 | 450 ± 101 | 0.0003 |
| HbA1c (%), median (IQR) | 5.90 (0.5) | 5.85 (0.45) | 6.10 (0.6) | 5.95 (0.5) | 6.10 (0.8) | 0.0043 |
| CRP (mg/L), median (IQR) | 1.7 (2.9) | 1.1 (1.9) | 1.5 (2.5) | 2.3 (2.6) | 2.7 (4) | 0.0135 |
| Medication intake, n (%) | ||||||
| Anti-hypertensive medication | 229 (89) | 53 (82) | 57 (89) | 61 (95) | 58 (91) | 0.0089 |
| Anti-diabetic medication | 46 (18) | 7 (10) | 6 (10) | 9 (14) | 24 (38) | 0.0008 |
| Lipid-lowering medication | 121 (47) | 19 (29) | 33 (52) | 31 (48) | 38 (59) | 0.0009 |
Missing values were <5% for all parameters presented. P-values refer to ordinal regression analysis across quartiles of EAT.
BMI, body mass index; body surface area by Mosteller formula: [height (cm) × weight (kg)/3600]½; DBP, diastolic blood pressure; HbA1c, glycated haemoglobin; LDL, low-density lipoprotein; SBP, systolic blood pressure.
Patients were stratified by quartiles based on EAT volume (Table 1), with a mean of 127 ± 58 cm³. Patients in the highest quartile compared with those in the lowest were significantly older [OR 1.06/year (95% CI 1.04–1.08), P < 0.0001] and more frequently male [OR 4.70 (95% CI 2.88–7.65), P < 0.0001], had higher BMI [OR 1.25/kg/m2 (95% CI 1.18–1.33), P < 0.0001], were more commonly smokers [OR 1.88 (95% CI 0.94–3.80)] or former smokers [OR 2.23 (95% CI 1.38–3.59), P = 0.0036], had lower HDL cholesterol [OR 0.95/mg/dL (95% CI 0.93–0.96), P < 0.0001] and eGFR [OR 0.98/mL/min/1.73 m2 (95% CI 0.97–0.99), P = 0.0009], had higher C-reactive protein (CRP) [OR 1.08/mg/L (95% CI 1.02–1.15), P = 0.0135] and had a higher prevalence of hypertension [OR 2.67 (95% CI 1.04–6.81), P = 0.0397], diabetes mellitus [OR 2.27 (95% CI 1.33–3.86), P = 0.0025] and CHD [OR 4.31 (95% CI 1.82–10.19), P = 0.0008]. Proteinuria as measured by UACR was not different across quartiles.
Associations of individual CV risk factors with EAT
To adjust associations for potential confounders, we performed multivariable adjusted ordinal regression analyses for explaining EAT volume (Table 2). The results of multivariable regression largely confirmed the unadjusted associations presented in Table 1: higher EAT remained significantly associated with the majority of investigated risk factors (age, male sex, BMI, smoking, HDL cholesterol and eGFR).
Associations between CV risk factors and epicardial fat volume as obtained from multivariable ordinal regression
| Effect | OR (95% Wald CI) | P-value |
|---|---|---|
| Age (years) | 1.050 (1.022–1.079) | 0.0004 |
| Sex (male versus female) | 4.026 (2.217–7.309) | <0.0001 |
| BMI (kg/m2) | 1.280 (1.200–1.367) | <0.0001 |
| Smoking (current smoker versus non-smoker) | 2.284 (0.992–5.260) | 0.0410 |
| Smoking (former smoker versus non-smoker) | 1.840 (1.069–3.166) | |
| Diabetes mellitus (yes versus no) | 0.955 (0.511–1.784) | 0.8858 |
| Hypertensive nephropathy (yes versus no) | 1.199 (0.66–2.177) | 0.5506 |
| Total cholesterol (mg/dL) | 0.999 (0.994–1.005) | 0.8140 |
| HDL cholesterol (mg/dL) | 0.979 (0.963–0.995) | 0.0103 |
| eGFR (mL/min/1.73 m2) | 0.979 (0.965–0.994) | 0.0056 |
| UACR (mg/g) | 1.000 (1.000–1.001) | 0.2446 |
BMI, body mass index.
Clinical characteristics according to CAC and AVC Agatston scores
It is believed that EAT exerts pathogenic effects on cardiac structures, thus we quantified CAC and AVC. The cohort exhibited a median Agatston CAC score of 45.6 (IQR 0–305.7) and 32% of the cohort had AVC [median Agatston score 0 (IQR 0–14.4), range 0–972] (Table 1). EAT volume significantly correlated with CAC [Spearman ρ = 0.388 (IQR 0.287–0.532)] and AVC score [rank biserial r = 0.409 (IQR 0.310–0.556)]. In an exploratory analysis, we examined clinical characteristics according to quartiles of CAC and the presence of AVC (Supplementary data, Tables S1 and S2). Higher CAC was significantly associated with age, male sex, smoking, hypertension, diabetes mellitus and CHD. Patients in the highest compared with those in the lowest CAC quartile had significantly lower eGFR and HDL cholesterol values (Supplementary data, Table S1). The presence of AVC was significantly associated with age, male sex, smoking, diabetes mellitus and patients with AVC compared with those without AVC had significantly lower eGFR (Supplementary data, Table S2).
Associations of CV risk scores with EAT, CAC and AVC
We assessed the prevalence and distribution of EAT, CAC and AVC across two different risk strata (FRS and ASCVD risk score). The median estimated 10-year ASCVD risk score was 13.7% (IQR 5.6–26.9) and the median estimated 10-year FRS was 8.5% (IQR 0–16.7). Ordinal regression analysis showed that EAT volume was positively associated with both higher ASVCD score [OR per point 1.01 (95% CI 1.01–1.02), P < 0.0001] (Figure 1A; Supplementary data, Table S3) and higher FRS [OR per point 1.01 (95% CI 1.01–1.02), P < 0.0001] (Figure 1B;Supplementary data, Table S4). CAC and AVC Agatston scores significantly increased with both increasing 10-year ASCVD score (Figure 1C and E;Supplementary data, Table S3) and FRS (Figure 1D and F;Supplementary data, Table S4).
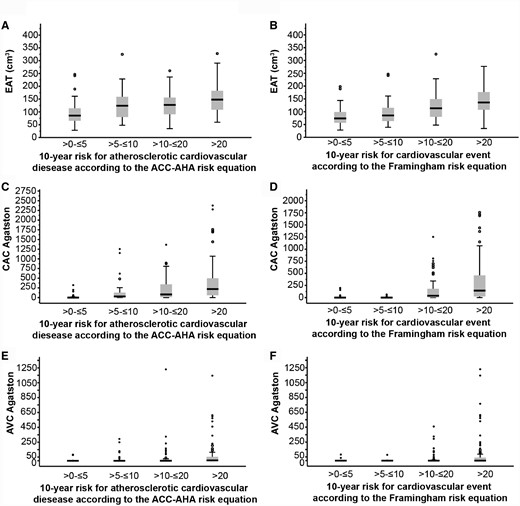
Prevalence and distribution of EAT, CAC and AVC across ACC-AHA ASCVD and FRS strata. (A, C and E) EAT volume, CAC and AVC Agatston score by ASCVD risk score strata (n = 228). (B, D and F) EAT volume, CAC and AVC Agatston score by FRS strata (n = 233). See also Supplementary data, Tables S3 and S4.
Associations between EAT and CAC as obtained from multivariable adjusted ordinal regression
| Effect | OR (95% Wald CI) | P-value |
|---|---|---|
| EAT (cm3) | 1.002 (0.996–1.008) | 0.5422 |
| Age (years) | 1.129 (1.095–1.165) | <0.0001 |
| Sex (male versus female) | 4.649 (2.471–8.747) | <0.0001 |
| BMI (kg/m2) | 0.971 (0.913–1.032) | 0.3448 |
| Smoking (current smoker versus non-smoker) | 2.095 (0.903–4.861) | 0.1569 |
| Smoking (former smoker versus non-smoker) | 1.511 (0.875–2.609) | |
| Diabetes mellitus (yes versus no) | 1.336 (0.718–2.485) | 0.3604 |
| Hypertensive nephropathy (yes versus no) | 1.574 (0.870–2.849) | 0.1339 |
| Total cholesterol (mg/dL) | 1.001 (0.995–1.007) | 0.7626 |
| HDL cholesterol (mg/dL) | 1.006 (0.989–1.024) | 0.5021 |
| eGFR (mL/min/1.73 m2) | 0.997 (0.982–1.012) | 0.7029 |
| UACR (mg/g) | 1.000 (1.000–1.000) | 0.7879 |
BMI, body mass index.
Associations between EAT and AVC as obtained from binary logistic regression
| Effect | OR (95% Wald CI) | P-value |
|---|---|---|
| EAT (cm3) | 1.005 (0.998–1.012) | 0.1959 |
| Age (years) | 1.096 (1.053–1.141) | <0.0001 |
| Sex (male versus female) | 1.049 (0.480–2.293) | 0.9048 |
| BMI (kg/m2) | 0.934 (0.864–1.010) | 0.0872 |
| Smoking (current smoker versus non-smoker) | 0.787 (0.233–2.655) | 0.1165 |
| Smoking (former smoker versus non-smoker) | 1.834 (0.917–3.668) | |
| Diabetes mellitus (yes versus no) | 2.754 (1.316–5.765) | 0.0072 |
| Hypertensive nephropathy (yes versus no) | 1.405 (0.686–2.878) | 0.3532 |
| Total cholesterol (mg/dL) | 1.002 (0.995–1.009) | 0.5082 |
| HDL cholesterol (mg/dL) | 0.989 (0.968–1.010) | 0.2896 |
| eGFR (mL/min/1.73 m2) | 1.000 (0.980–1.020) | 0.9836 |
| UACR (mg/g) | 1.000 (1.000–1.001) | 0.3474 |
BMI, body mass index.
Associations of EAT with CAC and AVC
To determine whether EAT volume can independently explain CAC and AVC values in our cohort, we studied its relations through multivariable logistic regression. EAT was not independently associated with CAC or AVC after adjusting for multiple CV risk factors (Tables 3 and 4). Higher age and male sex were independently associated with increased CAC (Table 3) and higher age and the presence of diabetes mellitus emerged as independently associated with AVC (Table 4).
DISCUSSION
In this study we examined the association between EAT, CV risk factors and CV calcifications in patients with CKD Stage 3 and/or overt proteinuria. We observed that higher EAT was independently associated with higher age and BMI, male sex, smoking, lower HDL cholesterol and eGFR. We further observed a significant correlation between EAT and estimated 10-year CV event risk using the FRS or ASCVD score. Moreover, EAT significantly correlated with the severity of CAC and AVC. However, the association between EAT and cardiac alterations was dependent on CV risk factors.
It has been reported that EAT as a local visceral fat depot correlates with visceral adipose tissue/obesity [10]. Obesity is common among patients with CKD and is a strong risk factor for CVD and diabetes mellitus [21]. As expected, we observed that obesity, measured by BMI, was associated with EAT after adjustment for several CV risk factors. A recent meta-analysis indicated that the amount of EAT is significantly higher in patients with diabetes mellitus than in patients without diabetes mellitus [22]. Similarly, we observed a higher prevalence of diabetes mellitus in patients with high EAT volume compared with those with low EAT volume. However, after adjustment for BMI and other CV risk factors, EAT was not independently associated with diabetes mellitus. This finding is consistent with observations in patients with Stages 3–5 CKD [13] or on dialysis [23].
It has been reported that with increasing age, body fat becomes redistributed from subcutaneous to visceral compartments, which could explain the association between age and EAT in our study [24]. These observations are consistent with the previous report in CKD patients [12]. However, in contrast to our study, they also found eGFR values positively associated with higher EAT levels. The authors explained this finding as potentially due to selection bias. Previous reports showed that EAT volumes are higher in CKD patients compared with healthy subjects [25]. Moreover, Nakanishi et al. [26] found significantly increased EAT volumes in patients with moderate CKD compared with non-CKD patients, which was associated with high-risk calcification. EAT volume is increased in patients on dialysis compared with matched control groups [23, 27, 28]. In line with those reports, we observed that eGFR is independently and inversely associated with EAT volume, suggesting that EAT may also be a marker of the uraemia-specific component of CV risk. Visceral fat distribution is altered in patients with CKD and it has been shown that eGFR inversely correlates with visceral fat [29]. Malnutrition and inflammation are common in patients with CKD, causing reduced muscle mass and insulin resistance, which in turn increases visceral fat [30]. Moreover, Turkmen et al. [23] reported a relationship between EAT and malnutrition, inflammation and atherosclerosis/calcification in end-stage renal disease (ESRD) patients. EAT has been implicated in the pathophysiology of CVD and left ventricular dysfunction, which may affect kidney function [31]. In line with those publications, we found a significant correlation between CRP and EAT in our univariate analysis. However, it remains unclear whether EAT accumulation is a cause or consequence of CKD.
There is no consensus in the literature on the impact of gender on the amount of EAT. We observed in our CKD cohort higher EAT volumes in males than in females. Some studies showed larger EAT volumes in males than in females [32, 33]. However, other groups reported no association or the opposite association (larger EAT volume in females than males) [10, 34, 35]. Abdominal fat distribution is different in males and females: visceral fat obesity is the dominant form in men, while subcutaneous fat obesity is the dominant form in women [36]. Therefore an association between sex and EAT might be attributable to regional differences in fat distribution.
Smoking and lower HDL cholesterol were associated with higher EAT volume in our cohort. These findings are consistent with previous reports [10, 13, 37, 38]. Smoking increases visceral fat and thereby EAT [39]. Interestingly, tissue concentrations of tumour necrosis factor-α and interleukin 6 in EAT collected from patients undergoing cardiac surgery were significantly higher in smokers than in non-smokers or former smokers [40].
To the best of our knowledge, we describe for the first time a significant correlation between EAT and estimated 10-year risk for CVD using the FRS and ASCVD score in a CKD cohort. Models using risk factors to predict the likelihood of suffering from CV events are helpful in identifying those at high risk who may benefit from more intensive CV risk management [41]. Our observation adds to the findings in the general population, where several studies have shown an association between EAT and CV event, which were at least in part explained by a strong association of EAT with CV risk factors [10, 11]. CV calcifications in patients with CKD are more prevalent and severe compared with the non-CKD population [42]. In this study, we found a significant correlation between EAT and coronary calcifications, which is consistent with previous reports in patients with CKD [12, 13]. Although EAT was not independently associated with CV calcifications in our multivariable regression analysis, it has been reported that patients with CKD Stages 3–5 have higher EAT volumes, which is associated with increased CV events independent of general adiposity [12, 23], provoking further speculation on whether EAT represents an additional CV risk factor in CKD patients. We also provide the first evidence that EAT correlates with AVC in patients with CKD Stage 3 and/or overt proteinuria. This finding is in line with the previous observation in patients with ESRD [25]. However, in contrast to this small study in patients with ESRD, our multivariate analysis revealed that EAT is not independently associated with AVC. We also noted an association of CV risk factors with CAC and AVC, confirming previous reports from the Chronic Renal Insufficiency Cohort study [43, 44].
There are strengths and limitations to our study. A strength is that we measured EAT, CAC and AVC simultaneously via CT scanning in a sample of patients with CKD. In addition, we used two different CV risk score algorithms to evaluate the association of CV risk with EAT, CAC and AVC. Besides the FRS, we used a recently developed risk algorithm that has been validated in a multi-ethnic sample and seems to be calibrated among patients with CKD [45, 46]. On the other hand, the cross-sectional design of the present study is a limitation, allowing us to define associations only with predicted rather than with factual risk. Furthermore, the association of each above-mentioned CV risk factor with EAT volume could just be a reflection of the overall impact of visceral adiposity on EAT volume. Nevertheless, several studies have shown that larger EAT volume is associated with CV morbidity and mortality, independent of obesity [5, 12, 47]. Although we assessed the association between EAT and typical CV risk factors, we did not measure other CV risk factors present in patients with CKD, such as low vitamin D levels [12], or provide detailed inflammatory status beside CRP. Further studies are needed to test whether EAT independently associates with other biomarkers (e.g. vitamin D, interleukins, tumour necrosis factor-α, etc.), which in turn may affect vascular calcifications. The CT scan cannot differentiate between intimal and medial calcification, the latter of which is particularly common in CKD patients. Therefore it remains unclear whether EAT correlated with calcification in the intima, media or both. Finally, we only enrolled CKD patients with CKD Stage 3 and/or overt proteinuria, so the results may not be generalizable to subjects with other CKD stages. Previous studies assessing the role of EAT in CKD were mainly conducted in the dialysis population [23, 25, 28, 48] and, together with the limited additional data in non-dialysis CKD patients [12, 13, 26], our findings suggest that these associations are valid across a wide range of CKD.
In conclusion, our findings suggest that pathological increases of EAT are closely associated with traditional CV risk factors and reduced eGFR. We demonstrate that EAT correlates with estimated 10-year risk for CVD using the FRS and ASCVD score. In line with these observations, EAT correlated with coronary as well as AVC burden, although these relations were dependent on CV risk factors. Our data support the concept that EAT volume is modifiable by therapeutic lifestyle interventions and tailored strategies aimed at individual CV risk factors may effectively reduce pathological increases of EAT in patients with CKD who are at high risk for CV events.
ACKNOWLEDGEMENTS
The authors thank the other investigators, the staff and the participants of the GCKD/CARVIDA study for their valuable contributions.
FUNDING
CARVIDA study was supported Fresenius Medical Care, Bad Homburg, Germany. The GCKD study is supported by the German Ministry of Education and Research grant numbers 01ER 0804, 01ER 0818, 01ER 0819, 01ER 0820 and 01ER 0821), the KfH Foundation for Preventive Medicine and corporate sponsors.
CONFLICT OF INTEREST STATEMENT
None declared.
REFERENCES
Author notes
Turgay Saritas, Sebastian Daniel Reinartz, Markus Peter Schneider and Georg Schlieper contributed equally to this work.


Comments