


Abstract
Recent data have shown that severe acute respiratory syndrome coronavirus 2 can infect renal proximal tubular cells via Angiotensin Converting Enzyme 2 (ACE2) . Our objective was to determine whether Fanconi syndrome is a frequent clinical feature in coronavirus disease 2019 (COVID-19) patients.
A retrospective cohort of 42 laboratory-confirmed COVID-19 patients without history of kidney disease hospitalized in University Hospital of Nancy was investigated. Patients were admitted to the intensive care unit (ICU) (n = 28) or the Medical department (n = 14) and were screened at least once for four markers of proximal tubulopathy.
The mean (standard deviation) follow-up was 19.7 (±12.2) days. Of the patients, 75% (30/40) showed at least two proximal tubule abnormalities (incomplete Fanconi syndrome). The main disorders were proteinuria (88%, n = 35), renal phosphate leak defined by renal phosphate threshold/glomerular filtration rate (TmPi/GFR) <0.77 (55%, n = 22), hyperuricosuria (43%, n = 17) and normoglycaemic glycosuria (30%, n = 12). At the time of the first renal evaluation, ICU patients presented more frequent (96 versus 62%, P = 0.0095) and more severe (844 ± 343 versus 350 ± 221 mg/g, P = 0.0001) proteinuria, and a trend for an increased number of proximal tubule abnormalities (P = 0.038). During follow-up, they presented a lower nadir of serum phosphate [median (interquartile range) 0.68 (0.43–0.76) versus 0.77 (0.66–1.07) mmol/L, P = 0.044] and Acute kidney Injury (AKI) during the hospitalization (P = 0.045). Fanconi syndrome preceded severe AKI KDIGO Stages 2 and 3 in 88% (7/8) of patients. Proximal tubular abnormalities (such as proteinuria, TmPi/GFR and glycosuria in five, two and two patients, respectively) were not detected anymore in recovering patients before hospital discharge.
Incomplete Fanconi syndrome is highly frequent in COVID-19 patients and precedes AKI or disappears during the recovery phase.
INTRODUCTION
Starting in Wuhan (China) in December 2019, coronavirus disease 2019 (COVID-19) is a newly ongoing pandemic infection due to a positive-sense RNA virus named as severe acute respiratory syndrome coronavirus 2 (SARS-CoV-2) [1]. Lungs are the first involved organs in the severe form of the disease, as 100% of patients admitted into intensive care units (ICUs) suffer from acute respiratory distress syndrome (ARDS). However, multiorgan damage is relatively frequent [2]. Among 82 laboratory-confirmed SARS-CoV-2 infection death cases, respiratory failure, cardiac failure, haemorrhage, hepatic and renal damage were found in 100, 89.0, 80.5, 78.0 and 31.7% of the patients, respectively [2]. According to a recent review by Naicker (2020), acute kidney injury (AKI) could occur in <10% of COVID-19 cases; however, renal abnormalities seem to be frequent, with 44% of cases presenting with proteinuria, 26.7% with haematuria and 15.5% with elevated serum creatinine [3].
Viral infections in immunocompetent hosts can impact kidney function by directly damaging infected kidney cells or as a result of damages from systemic immune responses [4] or haemodynamic instability [5]. Middle East respiratory syndrome (MERS)-coronavirus can induce apoptosis of renal tubular cells through hyperexpression of Smad7 and fibroblast growth factor-2 [6]. Viral antigens and coronavirus particles were detected in the renal tubular epithelial cells through post-mortem renal biopsies in 26 deceased COVID-19 patients [7]. By light microscopy, diffuse proximal tubule injury with the loss of brush border, non-isometric vacuolar degeneration and even frank necrosis was observed [7]. It has been reported that ACE2 is a key receptor for SARS-CoV-2 entry in cells [8]. High ACE2 expression was identified in lung type-2 alveolar cells, gastrointestinal system, heart and kidney, and especially in the proximal tubular epithelial kidney cells [7, 8].
We hypothesized that Fanconi syndrome may be a clinical feature of infection of proximal tubular epithelial kidney cells in patients hospitalized with a severe form of COVID-19, and that the most severe patients admitted to ICUs may develop a more frequent and/or a more severe Fanconi syndrome.
MATERIALS AND METHODS
After clinical and biological signs of proximal tubule injury were detected in three COVID-19 cases, all laboratory-confirmed COVID-19 patients cared for in the University Regional Hospital (CHRU) of Nancy from 20 to 29 March 2020 underwent a systematic screening of tubular function by four clinicians (A.J., M.K., P.V. and S.B.).
Inclusion criteria
We retrospectively collected clinical characteristics of laboratory-confirmed COVID-19 patients (aged ≥18 years) from the infectious diseases and ICU departments of Nancy Hospital (CHRU).
A confirmed diagnosis of COVID-19 was defined as a positive result of a real-time reverse-transcriptase–polymerase chain reaction detection in a nasopharyngeal swab or a bronchoalveolar lavage.
Exclusion criteria
Patients followed for chronic kidney disease (CKD) with golerular filtration rate (GFR) ≤60 mL/min/1.73 m2 and/or kidney transplantation were excluded from the analysis.
Study design
Each included patient was screened for four markers of proximal tubulopathy/Fanconi syndrome [proteinuria, renal phosphate threshold/GFR (TmPi/GFR) <0.77 mmol/L, hyperuricosuria and normoglycaemic glycosuria]. If patients were not discharged from hospital or dead, then these specific measures were likely to be repeated during their follow-up.
Diagnosis of proximal tubule injury
The diagnosis of proximal tubule injury/Fanconi syndrome was based on the presence of at least two of the following four abnormalities [9].
(i) A renal phosphate leak was defined by a ratio of TmPi/GFR <0.77 mmol/L by Bijvoet and Majoor [10]. This ratio was calculated in two steps according to Payne as follows [11]: (a) calculation of the renal tubular reabsorption of phosphate (RTP) with the following formula: RTP = 1 – [phosphate clearance (CPi)/creatinine clearance (Ccr)] × 100 and (b) interpretation of RTP value: if RTP ≤0.86: TmPi/GFR = RTP × plasma phosphate (Pp, mmol/L) and if RTP >0.86: TmPi/GFR = α × Pp with α = 0.3 × RTP/[1 − (0.8 × RTP)].
Of note, hypophosphataemia was defined as a value under the laboratory threshold of 0.78 mmol/L.
(ii) A normoglycaemic glycosuria was defined by a glycosuria >0.15 g/L and glycaemia <1.80 g/L.
(iii) Hyperuricosuria was defined by serum uric acid (SUA) levels <220 µmol/L in men and <184 µmol/L in women, and a fractional excretion of urate {[(urine uric acid/SUA)/(urine creatinine/serum creatinine)] × 100} >10% [12].
(iv) A urinary protein/creatinine ratio (proteinuria) >300 mg/g.
Data collection
Data were retrieved from electronic medical records of the Nancy University Hospital’s database. The following demographic and clinical baseline characteristics were collected: age, sex, body mass index (BMI), date of admission, department of admission (ICU or medical ward), comorbidities including CKD, a known proteinuria and medications. Clinical, biological and radiological characteristics of the COVID-19 infection were also collected, including time of onset of symptoms, initial symptoms at admission and characteristics of the pulmonary injury (radiological features, arterial blood gas results and mechanical ventilation parameters). The other recorded parameters were cardiac and haemodynamic status, liver function, haemodialysis requirement and vital status. AKI was defined according to the KDIGO criteria [13].
ICU management
The severity of ICU patients was evaluated using the new Simplified Acute Physiology Score (SAPS) and the Sequential Organ Failure Assessment (SOFA) score [14, 15]. The severity of the respiratory failure was evaluated according to the Berlin definition of ARDS [16].
All patients admitted to the ICU required invasive mechanical ventilation due to respiratory failure and received lung-protective ventilation (low tidal volume and positive end-expiratory pressures set according to severity of hypoxemia) as per the ARDS management guidelines [17]. If vasoactive agents were required, then an infusion of noradrenaline was administered. Fluid management was conservative as it has been shown that exposure to positive fluid balance is associated with adverse outcomes in critically ill patients [18].
In the first day of ICU stay, the anti-infective therapy included an antiviral and antibacterial treatment. As all patients presented with severe pneumonia during the flu season, oseltamivir [150 mg twice daily (b.i.d.), and reduced in cases of altered GFR according to the European Medicines Agency recommendations] was administered in suspicion of influenza-related ARDS. Treatment was adapted or withdrawn according to microbiology test results.
Regarding the treatment for COVID-19, the first patients admitted to the ICU were started on lopinavir (400 mg b.i.d.) and ritonavir (100 mg b.i.d.). This treatment was withdrawn if kidney failure appeared or worsened.
Ethics statement
The manuscript, entitled ‘COVID-19/acute Fanconi syndrome precedes acute kidney injury’, was evaluated by the Ethical Committee of Nancy University Hospital, where this research was done. This research was carried out in accordance with current French and European ethical standards, as well as with the World Medical Association International Code of Medical Ethics.
The ‘Nancy Biochemical Database’ is registered in the French National Commission for Data Protection and Liberties (CNIL No. 1763197v0), which supervises the protection of individuals with regard to the processing of personal data [19].
Statistical analysis
The analysis was descriptive. Quantitative data are presented as mean (± standard devation) or median ( interquartile range). Qualitative variables were compared using the Fisher’s exact test or Chi-square test when appropriate.
Chi-square test for trend was used for the analysis of AKI, and to compare the number of abnormalities related to proximal tubule injury between the two groups (ICU patients group and other inpatients).
Quantitative variables were compared using the Mann–Whitney U-test. All comparisons were two-sided and a P < 0.05 was considered significant.
Analyses were performed using GraphPad Prism software (San Diego, CA, USA).
RESULTS
Population study and characteristics during hospitalization
Forty-nine patients with a suspected or diagnosed COVID-19 were consecutively included by participating physicians. After excluding seven patients, the analysis was performed on 42 patients. The exclusion reasons were as follows: negative swab (n = 2), known estimated GFR (eGFR)<60 mL/min/1.73 m2 before hospitalization (n = 4) and history of kidney transplantation (n = 1). Two patients with an incomplete renal assessment for the diagnosis of proximal tubule injury were not excluded in the analysis.
Twenty-eight patients were admitted to the ICU (‘ICU patients’) after 1.87 (±1.99) days of hospitalization and 14 stayed in the infectious diseases department (‘other inpatients’). The mean follow-up was 19.7 (±12.2) days and was longer in the ICU patients than the other inpatients [25.4 (±9.8) versus 8.1 (±7.7) days, P < 0.0001].
The baseline characteristics are detailed in Table 1. There was no statistically significant difference between the ICU patients and the other inpatients regarding the age, gender, BMI, medical history and routine treatments.
Baseline characteristics of the cohort on admission at hospital
| Variables | Total (n = 42) | ICU (n = 28) | Medical department (n = 14) | P-valuea |
|---|---|---|---|---|
| Characteristics | ||||
| Age, yearsb | 63.4 (57.0–75.0) | 64.4 (58.6–74.4) | 61.4 (50.3–78.6) | 0.60 |
| Sex ratio F/M | 0.4 | 0.33 | 0.55 | 0.49 |
| BMI, kg/m2b | 29.3 (26.2–34.5)c | 30.7 (26.2–34.6) | 28.4 (25.1–31.7)c | 0.28 |
| Medical history, n (%) | ||||
| Hypertension | 16 (38) | 13 (46) | 3 (21) | 0.18 |
| Type 2 diabetes | 12 (28) | 10 (36) | 2 (14) | 0.28 |
| Dyslipidaemia | 21 (50) | 16 (57) | 5 (36) | 0.33 |
| Cardiovascular disease | 5 (12) | 3 (11) | 2 (14) | 1.00 |
| Valvular heart disease | 2 (5) | 2 (7) | 0 (0) | 0.55 |
| Heart arrhythmia (atrial fibrillation and others) | 2 (5) | 2 (7) | 0 (0) | 0.55 |
| Ischaemic stroke | 1 (2) | 1 (4) | 0 (0) | 1.00 |
| Peripheral arterial disease | 2 (5) | 2 (7) | 0 (0) | 0.55 |
| Chronic obstructive pulmonary disease | 1 (2) | 1 (4) | 0 (0) | 1.00 |
| Cancer in complete remission | 3 (7) | 2 (7) | 1 (7) | 1.00 |
| Cancer recently diagnosed or recently treated (<5 years) | 2 (5) | 1 (4) | 1 (7) | 1.00 |
| Known proteinuria | 1 (2) | 1 (4) | 0 (0) | 1.00 |
| Treatments, n (%) | ||||
| Angiotensin-converting enzyme inhibitors | 6 (14) | 5 (18) | 1 (7) | 0.65 |
| Angiotensin 2 receptor antagonists | 8 (19) | 6 (21) | 2 (14) | 0.70 |
| Other antihypertensive drugs | 14 (33) | 12 (43) | 2 (14) | 0.09 |
| Metformin | 9 (21) | 8 (29) | 1 (7) | 0.23 |
| Other oral antidiabetic drugs | 6 (14) | 5 (18) | 1 (7) | 0.65 |
| Insulin | 3 (26) | 3 (11) | 0 (0) | 0.54 |
| Statins | 13 (31) | 11 (39) | 2 (14) | 0.16 |
| Antiplatelets | 10 (24) | 9 (32) | 1 (7) | 0.13 |
| Anticoagulant | 4 (10) | 3 (11) | 1 (7) | 1.00 |
| Proton pump inhibitor | 9 (21) | 7 (25) | 2 (14) | 0.69 |
Analysis of ICU versus Medical department.
Data are expressed as median (range).
Two missing values in Medical department.
Clinical data on COVID-19, pulmonary disease, cardiac and hepatic functions and medications are displayed in Table 2.
Complications and treatments of included patients
| Variables | Total (n = 42) | ICU (n = 28) | Medical department (n = 14) | P-valuea |
|---|---|---|---|---|
| Consumption of NSAID drugs before hospitalization, n (%) | 2 (5)b | 1 (4)b | 1 (7) | 1 |
| Symptoms at admission, n (%) | ||||
| Fever | 35 (83) | 22 (79) | 13 (93) | 0.39 |
| Cough | 31 (74) | 20 (71) | 11 (79) | 0.72 |
| Diarrhoea | 13 (31) | 10 (36) | 3 (21) | 0.49 |
| Myalgia | 11 (26) | 5 (18) | 6 (43) | 0.14 |
| Headache | 7 (17) | 3 (11) | 4 (29) | 0.20 |
| Anosmia | 4 (10) | 0 (0) | 4 (29) | 0.0089 |
| Aguesia | 4 (10) | 0 (0) | 4 (29) | 0.0089 |
| Dyspnoea | 36 (86) | 25 (89) | 11 (79) | 0.38 |
| Clinical respiratory distress | 24 (57) | 20 (71) | 4 (29) | 0.019 |
| Confusion | 2 (5) | 2 (7) | 0 (0) | 0.54 |
| Severity score in intensive care | ||||
| SAPS-II score at admission | 38.5 (28.5–47.3)c | 38.5 (28.5–47.3)c | – | – |
| SOFA score at Day 1 | 3.5 (3.0–6.8)c | 3.5 (3.0–6.8)c | – | – |
| SOFA score at the day of first renal function assessment | 4.0 (3.0–6.0)c | 4.0 (3.0–6.0)c | – | – |
| Pulmonary disease | ||||
| Typical radiological pulmonary involvement | 38 (95)d | 25 (96)d | 13 (92) | 1 |
| Chest scanner | 25 (63)d | 13 (50)d | 12 (86) | 0.04 |
| Chest X-ray | 19 (48)d | 15 (58)d | 4 (29) | 0.10 |
| Initial arterial blood gases | ||||
| Ph | 7.45 (7.39–7.47)e | 7.43 (7.36–7.47) | 7.45 (7.43–7.47)e | 0.17 |
| pCO2, mmHg | 33.7 (31.0–39.0)e | 33.9 (30.7–45.2) | 33.7 (33.1–35.3)e | 0.78 |
| PaO2/FiO2, mmHg | 221 (111–277)f | 196 (103–265)f | 296 (223–322)f | 0.0065 |
| Pulmonary diagnosis (%) | ||||
| Initial PaO2/FiO2 >300 mmHg | 7 (18)f | 1 (4)f | 6 (46)f | 0.0009 |
| Acute lung injury | 17 (44)f | 12 (44)f | 5 (42)f | |
| ARDS | 15 (38)f | 14 (52)f | 1 (8)f | |
| Pulmonary treatment, n (%) | ||||
| Mechanical ventilation | 26 (62) | 26 (93) | 0 (0) | <0.0001 |
| Prone positioning | 23 (55) | 23 (82) | 0 (0) | <0.0001 |
| Cardiac and haemodynamic disorders, n (%) | ||||
| Myocarditis | 1 (2) | 1 (4) | 0 (0) | 1 |
| High-sensitive cardiac troponin I (expressed in pg/mL) | 17.1 (8.0–52.0)g | 17.5 (12.0–68.3)g | 17.1 (2.0–41.0)g | 0.36 |
| High-sensitive cardiac troponin I >24 pg/mL | 12 (34)g | 9 (35)g | 3 (43)g | 0.69 |
| Electrocardiogram analyses | ||||
| Repolarization abnormalities | 1 (3)h | 1 (4)h | 0 (0)h | 1 |
| Supraventricular rhythm disorder | 4 (10)h | 3 (12)h | 1 (8)h | 1 |
| Haemodynamic failure (noradrenaline treatment) | 14 (33) | 14 (50) | 0 | 0.0012 |
| Acute hepatitis, n (%) | 29 (69) | 23 (82) | 6 (43) | 0.015 |
| SGPT | 66.5 (33.5–117.5) | 77.5 (52.8–154.5) | 29.0 (19.0–85.0) | 0.002 |
| SGOT | 72.5 (38.0–115.8) | 95.0 (47.8–135.3) | 40.5 (24.8–67.3) | 0.0023 |
| COVID-19 and associated treatments, n (%) | ||||
| Lopinavir + ritonavir (Kaletra®) | 11 (28)e | 10 (36) | 1 (8)e | 0.12 |
| Remdesivir | 1 (3)e | 1 (4) | 0 (0)e | 10.0190.210.006 |
| Initial oseltamivir (Tamiflu®) | 10 (25)e | 10 (36) | 0 (0)e | |
| Antibiotics | 37 (93)e | 27 (96) | 10 (83)e | |
| Third-generation cephalosporin | 34 (85)e | 27 (96) | 7 (58)e | |
| Rovamycin or azithromycin | 19 (48)e | 17 (61) | 2 (17)e | 0.013 |
| Amoxicillin + clavulanic acid | 2 (5)e | 1 (4) | 1 (8)e | 1 |
| Aminoglycosides | 2 (5)e | 1 (4) | 1 (8)e | 1 |
Data are expressed as median (range) or n (%) when appropriate.
Analysis of ICU versus Medical department.
Four missing data in ICU.
Six missing data in ICU.
Two missing data in ICU.
Two missing data in Medical department.
One missing data in ICU and two missing data in Medical department.
Two missing data in ICU and seven missing data in Medical department.
Two missing data in ICU and one missing data in Medical department.
NSAID: non-steroidal anti-inflammatory drugs.
Bold value: the p is <0.05
At the end of the follow-up, 7 patients had died (6 ICU patients versus 1 other inpatient, P = 0.39) after 15.1 (±7.1) days, 24 patients had been discharged from the hospital (12 ICU versus 12 other inpatients, P = 0.01) and 11 patients were still hospitalized (10 ICU patients versus 1 other inpatient, P = 0.07) for 34.2 (±4.3) days. Only 14 patients (50%) had left the ICU after 16.2 (±8.9) days. Importantly, ICU patients were discharged from hospital later than other inpatients (22.6 ± 8.4 versus 6.1 ± 3.0 days, P < 0.0001, respectively).
First assessment of proximal tubule injury
The mean length-of-stay from admission to the first evaluation of proximal tubular injury by the nephrology team was 5.4 (±4.1) days, and was similar between ICU and other inpatients (P = 0.96).
After the first renal evaluation, 27 of 40 patients (68%) had at least two abnormalities related to a Fanconi syndrome. Urine analyses were not correctly performed in one patient in each group. At this time, five ICU patients had Stage 1 KDIGO AKI and two ICU patients had Stage 3 KDIGO AKI. All proximal tubular abnormalities are displayed in Table 3.
Focus on the first evaluation of proximal tubular injury
| Variables | Total (n = 42) | ICU (n = 28) | Medical department (n = 14) | P-valuea |
|---|---|---|---|---|
| Diagnosis of renal proximal tubulopathy (%) | 27 (68)b | 20 (74)b | 7 (54)b | 0.28 |
| Diagnosis of proteinuria >300 mg/g (%) | 34 (85)b | 26 (96)b | 8 (62)b | 0.0095 |
| Diagnosis of renal phosphate leakage (TmPi/GFR <0.77) (%) | 19 (48)b | 14 (52)b | 5 (38)b | 0.51 |
| Serum phosphate, mmol/L | 0.88 (0.76–1.20) | 0.90 (0.74–1.21) | 0.85 (0.77–1.2) | 0.98 |
| Hypophosphataemia, n (%) | 12 (29) | 8 (29) | 4 (29) | 0.58 |
| Normophosphataemia, n (%) | 28 (67) | 18 (64) | 10 (71) | 0.51 |
| Hyperphosphataemia, n (%) | 2 (5) | 2 (7) | 0 (0) | 0.98 |
| RTP | 0.75 (0.59–1.01)c | 0.75 (0.57–0.96)c | 0.81 (0.63–1.07)c | 0.28 |
| TmPi/GFR, mmol/L | 0.76 (0.59–1.04)c | 0.75 (0.57–0.99)c | 0.95 (0.63–1.38)c | 0.11 |
| Intraveinous phosphate supplementation, n (%) | 17 (46)d | 16 (64)d | 1 (8)d | 0.0017 |
| Diagnosis of hyperuricosuria, n (%) | 14 (35)b | 11 (41)b | 3 (23)b | 0.31 |
| Hypouricaemia, n (%) | 18 (44)e | 13 (48)e | 5 (36) | 0.52 |
| SUA, µmol/L | 220 (167–349)e | 213 (153–340)e | 261 (168–392) | 0.48 |
| Fe uric acid value (for hyperuricosuric patients) | 17.6 (13.1–33.3)f | 18.1 (13.4–31.9)f | 15.6 (10.8–42.3)f | 0.67 |
| Diagnosis of normoglycaemic glycosuria, n (%) | 11 (28)g | 9 (35)g | 2 (15)g | 0.27 |
| Glycosuria >0.15 g/L, n (%) | 17 (44)g | 15 (58)g | 2 (15) | 0.017 |
| Glycaemia >1.80 g/L, n (%) | 8 (19) | 8 (29) | 0 (0) | 0.037 |
| Glycosuria value in normoglycaemic patient (<1.80 g/L), g/L | 0.09 (0.04–0.27)g | 0.15 (0.05–0.45)g | 0.23 and 18.80 g/Lg | 0.21 |
Data expressed as median (range) or n (%) when appropriate.
Analysis of ICU versus Medical department.
One missing value in each group.
Two missing values in each group.
Three missing values in the ICU group and two missing values in Medical department.
One missing value in the ICU group.
Regarding 14 patients.
Two missing values in the ICU group and one missing value in medical department.
Bold value: the p is <0.05
ICU patients were more likely than other inpatients to experience a severe Fanconi syndrome (P = 0.038), as shown in Figure 1A, and proteinuria as shown in Table 3. After excluding the two ICU patients with glomerular rank proteinuria (>3000 mg/g), other ICU patients were more likely to experience a significantly increased tubular proteinuria (mg/g) than other inpatients, as shown in Figure 1B (844 ± 345 versus 343 ± 221, P = 0.0001).
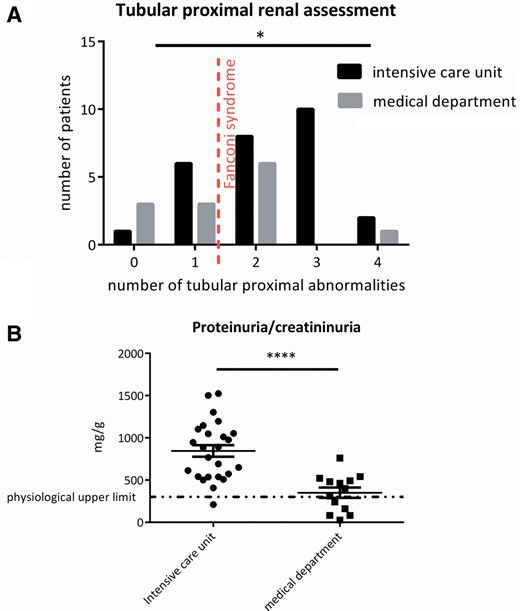
Focus at the time of the first renal evaluation of proximal tubule injury. (A) The trend of number of attacks compatible with tubular proximal diagnosis was significantly different between ICU patients and other inpatients (P = 0.038). The dotted red line defines the diagnosis of proximal tubulopathy. (B) Excluding the two patients with nephrotic-range proteinuria in the ICU, the proteinuria/creatininuria value was significantly more important in ICU patients versus other inpatients (P < 0.0001).
Subsequent assessment of proximal tubule injury
During hospitalization, 22 patients (19 in ICU versus 3 other inpatients, P = 0.008) had two or more evaluations of proximal tubular injury during their hospitalization. At the end of follow-up, 30 of 40 analysable patients (75%) had a diagnosis of Fanconi syndrome. The full analysis of proximal tubule injury assessment during hospitalization and associated biological findings are displayed in Table 4.
Cumulative evaluations of proximal tubular injury during hospitalization and biological associated findings
| Variables | Total (n = 42) | ICU (n = 28) | Medical department (n = 14) | P-valuea |
|---|---|---|---|---|
| Diagnosis of renal proximal tubulopathy during the follow-up, n (%) | 30 (75)b | 22 (81)b | 8 (62)b | 0.24 |
| At least one diagnosis of proteinuria >300 mg/g, n (%) | 35 (88)b | 27 (100)b | 8 (62)b | 0.002 |
| Peak of proteinuria (mg/g) | 651 (483–1051)b | 946 (572–1463)b | 400 (200–505)b | <0.0001 |
| Time to the peak of proteinuria (in days) | 4.5 (2.0–8.0)b | 6.0 (2.0–8.0)b | 4.0 (2.5–7.0)b | 0.55 |
| At least one diagnosis of renal phosphate leakage (TmPi/GFR <0.77), n (%) | 22 (55)b | 17 (63)b | 5 (38)b | 0.19 |
| Baseline serum phosphate, mmol/L | 1.13 (0.88–1.43)c | 1.16 (0.88–1.50)c | 1.08 (0.77–1.34)c | 0.56 |
| Hypophosphatemia at baseline, n (%) | 3 (14)c | 2 (12)c | 1 (25)c | 0.48 |
| Nadir of serum phosphate during the first 10 days, mmol/L | 0.73 (0.58–0.87)d | 0.68 (0.43–0.76)d | 0.77 (0.66–1.07) | 0.044 |
| Hypophosphatemia at nadir during the first 10 days, n (%) | 26 (63)d | 21 (78)d | 7 (50) | 0.09 |
| Time to nadir of serum phosphate during the first 10 days (in days) | 4.0 (3.0–5.0)d | 4.0 (4.0–5.0)d | 4.0 (2.0–5.3) | 0.27 |
| At least one diagnosis of hyperuricosuria, n (%) | 17 (43)b | 13 (48)b | 4 (31)b | 0.33 |
| Baseline SUA, µmol/L | 311 (213–382)e | 337 (230–401)e | 237 (184–289)e | 0.31 |
| Nadir of SUA during the first 10 days, µmol/L | 204 (149–312)f | 198 (128–272)f | 261 (159–354) | 0.21 |
| Hypouricemia at nadir during the first 10 days, n (%) | 17 (45)f | 13 (54)f | 4 (29) | 0.18 |
| Time to nadir of SUA during the first 10 days (in days) | 5.0 (2.8–7.0)f | 5.5 (2.3–7.0)f | 4.5 (2.8–6.0) | 0.52 |
| At least one diagnosis of normoglycaemic glycosuria, n (%) | 12 (30)b | 9 (33)b | 3 (23)b | 0.72 |
Data expressed as median (range) or n (%) when appropriate.
Analysis of ICU versus Medical department.
One missing value in each group.
Eleven missing values in the ICU group and 10 missing values in Medical department.
One missing value in the ICU group.
Twenty missing values in the ICU group and 12 missing values in Medical department.
Four missing values in the ICU.
Bold value: the p is <0.05
The comparison between the two groups regarding proximal tubular abnormalities during the whole hospitalization is hazardous as the ICU patients were more screened. Nevertheless, the nadir of serum phosphate during the 10 first days of hospitalization was lower in the ICU patients (Table 4).
On the second or third proximal tubular evaluations, the previous abnormalities disappeared in some of the patients. No proteinuria was detectable before hospital discharge in five patients with previous proteinuria. Normalization of the TmPi/GFR was found in two patients. No glycosuria was detectable in two patients with initial normoglycaemic glycosuria.
Abnormalities on serum and urine protein electrophoresis patterns
Unquantifiable monoclonal bands on serum protein electrophoresis patterns were detected in four patients. A monoclonal gammopathy of undetermined significance was quantified for 4 g/L. In a total of 24 urine protein electrophoresis pattern (UPEP), 17 tubular proteinuria (albuminuria <50%) and 7 glomerulo-tubular proteinuria (albuminuria between 50% and 80%) were detected. No light-chain proteinuria was detected in all UPEP.
Renal function analysis
The serum creatinine at baseline was not different between ICU and other inpatients (84 ± 24 versus 80 ± 30 µmol/L, P = 0.88). At Day 0, functional Stage 1 KDIGO AKI was retrospectively diagnosed in six ICU patients versus two other inpatients (P = 0.69). Taking into account the baseline creatinine or the level of creatinine after hydration in the latter patients, all patients had an eGFR by Chronic Kidney Disease Epidemiology Collaboration >60 mL/min/1.73 m2, except for two patients (one in each group) with respective eGFRs of 58 and 57 mL/min/1.73 m2. These two patients had initial functional AKI and were, respectively, aged 74 and 85 years. They were not excluded from analysis because no CKD was known before hospitalization.
The mean peak of serum creatinine was 181 (±202) µmol/L in the ICU patients versus 82 (±30) µmol/L in the other inpatients (P = 0.07), respectively at Day 5.9 (±5.7) versus 1.1 (±2.0) (P = 0.0025).
AKI during hospitalization stay was very frequent among this population (50%). With 7 (11%) Stage 3, 1 (4%) Stage 2 and 10 (36%) Stage 1 KDIGO AKI in the ICU patients versus 3 (21%) Stage 1 KDIGO AKI in other inpatients, this condition was more frequent and more severe in the ICU patients (P = 0.045). Although the combination of lopinavir and ritonavir was mostly given to the ICU patients (10 patients) (Table 2), it was not significantly associated with AKI (Supplementary data, Table S1). Haemodialysis was required in five ICU patients versus zero other inpatients (P = 0.15) after 11 (±4.7) days. One patient was free of dialysis after 1 week, two patients still needed haemodialysis after 29 and 9 days, respectively, and the two other patients died after 13 and 27 days of hospitalization.
Among seven patients with Stage 3 KDIGO AKI, all patients experienced previous or concomitant incomplete Fanconi syndrome with two (n = 4), three (n = 2) or four (n = 1) proximal tubular abnormalities. The patient with Stage 2 KDIGO AKI experienced only proteinuria. Among the seven deceased patients, six had AKI (three Stage 1 and three Stage 3 KDIGO AKI) and Fanconi syndrome. The last patient died before urine analysis was performed.
DISCUSSION
This is the first study demonstrating an acute incomplete Fanconi syndrome in 75% patients admitted for mild, moderate or severe lung failure from COVID-19. This condition was always associated with proteinuria, and irregularly with severe renal phosphate leak that may result in life-threatening hypophosphatemia, hyperuricosuria and glycosuria. If the sensitivity of these four markers of proximal tubulopathy is very high among this population, its specificity to demonstrate a viral infection of proximal tubular epithelial cells needs to be addressed in further studies, as no kidney biopsy or urine viral load was performed in our patients. Finding specific biomarkers of kidney injury before AKI in COVID-19 is a challenge, and we strongly believe that these four markers taken together will represent a cheap and reproducible method to assess proximal tubular infection by SARS-CoV-2 in the future.
Renal hypokalaemia, salt loss AKI and renal tubular acidosis, although classically associated with Fanconi syndrome, were not analysed in this study for several reasons. They were indeed infrequent or difficult to diagnose because of potassium supplementation, mechanical ventilation, GFR alterations and/or other unknown factors.
In adults, causes of Fanconi syndrome are mainly acquired, either exogenous by environmental intoxications (lead, cadmium, aristolochic acid) [20–22] or by drugs such as cisplatin, tenofovir, adefovir, ifosfamide [23, 24] or endogenous with monoclonal gammopathy of renal significance with crystal storing histiocytis [25] or light chain proximal tubulopathy [26]. Thus, this study identified a novel acquired cause of human proximal tubule injury.
We support the hypothesis that the occurrence of acute proximal tubule injury is a predictor of AKI. First, 88% of patients (7/8) with severe Stages 2 and 3 KDIGO AKI experienced proximal tubule injury before AKI. Secondly, we demonstrate that ICU patients were more likely to experience more severe proximal tubule injury, proteinuria and more profound hypophosphataemia during their follow-up. These same ICU patients experienced more AKI during hospitalization, suggesting a strong association between the severity of proximal tubule injury and a future AKI. Thirdly, none of the ICU patients presented severe haemodynamic instability requiring temporary cardiac support or high doses of vasopressors. They had a relatively low mean SOFA score at admission, and had neither multiorgan failure state nor severe haematological, neurological and hepatic failure. Finally, the combination therapy of lopinavir/ritonavir is rarely associated with episodes of AKI [27], but it cannot explain our findings as a whole, as only a quarter patients were treated with this therapy. Taken together, we believe that AKI observed in the vast majority of our patients is initiated in the proximal tubule. On the other hand, we also observed that many of the patients with initial Fanconi syndrome did not develop AKI, and were even able to correct their initial tubular proximal abnormalities during their recovery. Understanding the other factors necessary to develop AKI will require further studies.
Renal failure is common during viral infections, and several disease mechanisms are involved [4, 28]. A common mechanism is the direct cell damage from viral infection with hijacking of host cellular functions, such as in HIV-associated nephropathy or segmental and focal hyalinosis during parvovirus B19 infection. The second mechanism is a specific immune response to cell infection leading to destruction of infected cells, as in hantavirus nephropathy. Finally, the third mechanism is an indirect immune response with complications related to circulating of immune complexes or circulating cytokines, as in hepatitis-B virus-related glomerulonephritis, or membranoproliferative/cryoglobulinaemic hepatitis C virus glomerulonephritis or HIV-associated immune complex kidney disease. The best-documented viral infection targeting the renal tubule structure is Puumala hantavirus infection leading to AKI due to tubulointerstitial inflammation. Very interestingly and alongside the findings of our study, signs of proximal tubular dysfunction (renal glycosuria in dipstick urine test) can appear before AKI and predict its severity [29].
Regarding SARS-CoV-2, this novel virus can specifically infect proximal tubular cells by ACE2 [7, 8] and we hypothesize that this is leading to proximal tubule injury by hijacking the normal cell machinery, and as a result leading to cell dysfunction. Subsequently, viral tubular infection could lead in some patients to a local immune and inflammatory response, leading to acute tubular necrosis [7] and acute renal failure.
The main limitation of this study is a possible patient selection bias in the performance of renal function assessments. Further larger and systematic studies should make it possible to evaluate the prevalence of proximal tubule injury in hospitalized and home-care COVID-19 populations. The assessment of tubular proteinuria should require special attention (e.g. retinol-binding protein). Aminoaciduria should be assessed to further refine diagnosis. A specific assessment of phosphocalcic metabolism should be carried out to support a vitamin D1α-hydroxylase deficiency by proximal tubule in this condition and its outcomes.
In conclusion, COVID-19 seems to generate Fanconi syndrome leading to life-threatening plasma abnormalities. This tubulopathy precedes AKI or disappears during the recovery phase. In future studies, the occurrence and persistence of Fanconi syndrome will deserve further attention as a potential prognostic marker of disease severity and as a potential biomarker of proximal tubular epithelial cell infection.
ACKNOWLEDGEMENTS
The authors would like to thank Odette Agulles MD, who greatly contributed to facilitating the connected prescription for renal function assessment using the DxCare software for all physicians managing COVID-19 patients. They acknowledge the contribution of Dr Zakia Ait Djafer MD, who played a major role in the Division of Biochemistry of the Department of Molecular Medicine.
CONFLICT OF INTEREST STATEMENT
None declared.
REFERENCES
Author notes
Asma Alla and Alice Corbel contributed equally to this work.


Comments