


Abstract
No national study has evaluated changes in the appropriateness of US outpatient antibiotic prescribing across all conditions and age groups after the coronavirus disease 2019 (COVID-19) outbreak in March 2020.
This was an interrupted time series analysis of Optum's de-identified Clinformatics Data Mart Database, a national commercial and Medicare Advantage claims database. Analyses included prescriptions for antibiotics dispensed to children and adults enrolled during each month during 2017–2021. For each prescription, we applied our previously developed antibiotic appropriateness classification scheme to International Classification of Diseases, Tenth Revision, Clinical Modification diagnosis codes on medical claims occurring on or during the 3 days prior to dispensing. Outcomes included the monthly proportion of antibiotic prescriptions that were inappropriate and the monthly proportion of enrollees with ≥1 inappropriate prescription. Using segmented regression models, we assessed for level and slope changes in outcomes in March 2020.
Analyses included 37 566 581 enrollees, of whom 19 154 059 (51.0%) were female. The proportion of enrollees with ≥1 inappropriate prescription decreased in March 2020 (level decrease: −0.80 percentage points [95% confidence interval {CI}, −1.09% to −.51%]) and subsequently increased (slope increase: 0.02 percentage points per month [95% CI, .01%–.03%]), partly because overall antibiotic dispensing rebounded and partly because the proportion of antibiotic prescriptions that were inappropriate increased (slope increase: 0.11 percentage points per month [95% CI, .04%–.18%]). In December 2021, the proportion of enrollees with ≥1 inappropriate prescription equaled the corresponding proportion in December 2019.
Despite an initial decline, the proportion of enrollees exposed to inappropriate antibiotics returned to baseline levels by December 2021. Findings underscore the continued importance of outpatient antibiotic stewardship initiatives.
Ensuring outpatient antibiotic appropriateness is crucial to prevent antibiotic-related adverse events [1] and antimicrobial resistance, the latter of which is responsible for 3 million infections and 48 000 deaths in the United States (US) annually [2]. Before the coronavirus disease 2019 (COVID-19) outbreak in March 2020, at least 23% of US outpatient antibiotic prescriptions were written for antibiotic-inappropriate conditions [3]. Although US outpatient antibiotic dispensing declined sharply after March 2020, it had returned to prior levels by the end of 2022 [4]. This rebound suggests that a renewed focus on ensuring outpatient antibiotic appropriateness may be warranted.
To date, most US studies have either evaluated changes in the rate of antibiotic dispensing after March 2020 without assessing appropriateness or evaluated changes in inappropriate antibiotic prescribing for specific conditions, such as COVID-19 and respiratory infections [5–11]. One study evaluated changes in antibiotic appropriateness across all conditions among pediatric patients in a single system [12]. However, we are unaware of any US study that has examined these changes using national data across all age groups. Using a national claims database, we evaluated changes in the appropriateness of outpatient antibiotic prescribing across all conditions among children and adults with private or Medicare Advantage coverage after March 2020.
METHODS
Data Sources
From July 2022 to March 2023, we conducted an interrupted time series analysis using 2017–2021 data from Optum's de-identified Clinformatics Data Mart Database, a national database of claims from approximately 16 million annual enrollees with commercial or Medicare Advantage coverage. Although the database includes enrollees covered by fully insured or self-insured plans in all US states, it overrepresents the South and underrepresents the West [13]. Data elements include demographic characteristics, enrollment data, and International Classification of Diseases, Tenth Revision, Clinical Modification (ICD-10-CM) diagnosis codes on medical claims. To identify pharmacy claims for dispensed oral antibiotic prescriptions, we used a list of national drug codes employed in national quality measures for antibiotic prescribing (Supplementary Appendix 1). Because data were de-identified, the Institutional Review Board of the University of Michigan Medical School exempted analyses from human subjects review.
Study Cohort
We created 60 cohorts, 1 for each month during 2017–2021. For the 55 non-January cohorts, enrollees were eligible if they resided in the US and were continuously enrolled from the 3 days prior to the first date of the month through the end of the month. We required continuous enrollment starting from the 3 days prior to the first date of the month to capture diagnosis codes temporally associated with prescriptions dispensed early during the month. For the 5 January cohorts, we only required continuous enrollment throughout the month to avoid sample size loss owing to the churn that occurs in plans between December and January [14].
The cohort was comprised of 3 subpopulations: privately insured children aged 0–17 years, privately insured adults aged ≥18 years, and Medicare Advantage enrollees aged ≥18 years. We combined these subpopulations in the main analysis and conducted subgroup analyses to assess heterogeneity in changes.
Antibiotic Appropriateness Classification Scheme
For each antibiotic prescription dispensed to enrollees in the 60 cohorts, we identified all unique diagnosis codes occurring on medical claims occurring during the “look-back period,” defined as the 3 days prior to the dispensing date through the dispensing date. For each diagnosis code in the look-back period, we applied an updated version of our previously developed antibiotic appropriateness classification scheme of ICD-10-CM diagnosis codes [3]. The original scheme was developed by 3 study authors (K.-P. C., M. A. F., J. A. L.), all practicing primary care physicians in pediatrics or internal medicine. Following the general approach of a prior ICD-9-CM–based scheme [15], these authors used a consensus-based approach to determine whether the 91 738 diagnosis codes in the 2017 version of ICD-10-CM “always” justified antibiotic use (eg, urinary tract infection), “sometimes” justified antibiotic use (eg, otitis media), or “never” justified antibiotic use (eg, upper respiratory infection). The updated scheme included new diagnosis codes added in the 2018–2021 versions of ICD-10-CM, which similarly were classified by the 3 authors using a consensus-based approach. Except for COVID-19–related pneumonia, which we classified as a “sometimes” code, we considered all other COVID-19–related diagnosis codes to be “never” codes, including the provisional and official codes for COVID-19 infection, COVID-19 exposure, and encounters for COVID-19 screening.
Our original scheme has been used to classify antibiotic appropriateness both in the US and in other countries [12, 16–20]. To facilitate continued use by other investigators, we include the updated scheme in the Supplementary Appendix.
Outcomes
There were 3 main outcomes. First, we calculated the monthly proportion of dispensed antibiotic prescriptions assigned to each of 4 mutually exclusive appropriateness categories:
Appropriate (at least 1 “always” code during the look-back period).
Potentially appropriate (at least 1 “sometimes” code but no “always” codes during the look-back period).
Inappropriate (only “never” codes during the look-back period).
Not associated with a recent diagnosis code (no diagnosis codes during the look-back period). This category, which accounted for almost 3 in 10 antibiotic prescriptions in 2016 [3], includes antibiotic prescriptions written during visits or encounters not billed to insurance (eg, nonbilled portal or telephone encounters, cash-pay urgent care visits), refills of antibiotic prescriptions that occur in the absence of a recent visit, and antibiotic prescriptions filled >3 days after they are prescribed.
Second, we calculated the monthly proportion of enrollees with ≥1 dispensed antibiotic prescription, a measure of population-level exposure to antibiotics. Third, we calculated the monthly proportion of enrollees with ≥1 dispensed antibiotic prescription in each appropriateness category, an outcome that is roughly equal to the product of the first 2 outcomes.
To identify potential factors associated with changes in inappropriate antibiotic prescribing during March 2020, we calculated 2 secondary outcomes. First, among inappropriate antibiotic prescriptions that were not refills of a prior prescription, we calculated the proportion that were associated with a diagnosis code for COVID-19 infection (U071) in the look-back period. Second, we calculated the proportion of these prescriptions that were associated with a claim for a telehealth visit in the look-back period (see Supplementary Appendix 2 for details).
Statistical Analysis
Using an interrupted time series analysis design, we fitted linear segmented regression models assessing for level or slope changes in the main outcomes during March 2020 [21]. To account for temporal variation in outcomes, models included a dummy variable for each 2-month interval (January–February, March–April, etc) [22]. In all models, we employed robust Newey-Robust standard errors with 1 lag to account for first-order autocorrelation revealed by the Cumby-Huizinga test [23].
We used descriptive statistics to assess the 2 secondary outcomes. In subgroup analyses, we repeated analyses among the 3 subpopulations. Analyses employed 2-sided hypothesis tests with α = .05 and were conducted using SAS version 9.4 and RStudio version 4.2.2 software.
RESULTS
Study Cohort
The 60 study cohorts included 37 556 581 enrollees. Enrollees contributed 961 895 505 person-months of data, or a mean of 25.6 (standard deviation [SD], 19.4) per patient. Table 1 shows patient characteristics. Upon sample entry, mean enrollee age was 43.0 (SD, 23.3) years. Among all enrollees, 5 908 509 (15.7%) were privately insured children, 21 685 987 (57.7%) were privately insured adults, 9 962 085 (26.5%) were Medicare Advantage enrollees, 19 154 059 (51.0%) were female, and 16 631 340 (44.3%) resided in the South.
Characteristics of Patients Appearing in Any of the 60 Monthly Cohorts
| Characteristic | All Enrollees | Privately Insured Children Aged 0–17 Years | Privately Insured Adults Aged ≥18 Years | Adults Aged ≥18 Years With Medicare Advantage |
|---|---|---|---|---|
| Sample size | ||||
| Unique enrollees during study period, No. | 37 556 581 | 5 908 509 | 21 685 987 | 9 962 085 |
| Person-months of data contributed, No. | 961 895 505 | 130 181 103 | 491 483 616 | 340 230 786 |
| Mean (SD) person-months per patient | 25.6 (19.4) | 22.0 (17.5) | 22.7 (18.0) | 34.2 (20.9) |
| Agea | ||||
| Mean (SD), y | 42.97 (23.3) | 8.3 (5.4) | 39.6 (13.9) | 71.0 (9.6) |
| 0–11 y | 3 9387 26 (10.5) | 3 938 726 (66.7) | NA | NA |
| 12–17 y | 1 969 783 (5.2) | 1 969 783 (33.3) | NA | NA |
| 18–34 y | 9 122 263 (24.3) | NA | 9 074 019 (41.8) | 48 244 (.5) |
| 35–54 y | 9 131 676 (24.3) | NA | 8 713 405 (40.2) | 418 271 (4.2) |
| 55–64 y | 4 193 077 (11.2) | NA | 3 283 536 (15.1) | 909 541 (9.1) |
| ≥65 y | 9 201 056 (24.5) | NA | 615 027 (2.8) | 8 586 029 (86.2) |
| Sex | ||||
| Female | 19 154 059 (51.0) | 2 889 879 (48.9) | 10 593 374 (48.9) | 5 670 806 (56.9) |
| Region of residencea | ||||
| Northeast | 3 942 342 (10.5) | 523 238 (8.9) | 2 051 968 (9.5) | 1 367 136 (13.7) |
| Midwest | 8 878 085 (23.6) | 1 550 383 (26.2) | 5 364 278 (24.7) | 1 963 424 (19.7) |
| South | 16 631 340 (44.3) | 2 530 029 (42.8) | 9 740 186 (44.9) | 4 361 125 (43.8) |
| West | 8 104 814 (21.6) | 1 304 859 (22.1) | 4 529 555 (20.9) | 2 270 400 (22.8) |
Data are presented as No. (%) unless otherwise indicated.
Abbreviations: NA, not applicable; SD, standard deviation.
aRepresents characteristics at the time of sample entry.
Enrollees filled 60 674 039 antibiotic prescriptions during 2017–2021. The 3 most common antibiotics were amoxicillin (10 204 166 [16.8%]), azithromycin (9 019 819 [14.9%]), and amoxicillin-clavulanate (6 653 926 [11.0%]). Among all enrollees, 17 045 686 (45.4%) filled ≥1 antibiotic prescription during 2017–2021, 10 786 807 (28.7%) filled ≥2 prescriptions, 7 321 555 (19.5%) filled ≥3, and 5 226 582 (13.9%) filled ≥4.
Antibiotic Appropriateness During the Study Period
Among the 60 674 039 antibiotic prescriptions dispensed during the study period, 9 456 021 (15.6%) were appropriate, 17 855 834 (29.4%) were potentially appropriate, 15 184 575 (25.0%) were inappropriate, and 18 177 609 (30.0%) were not associated with a recent diagnosis code. During January 2017–February 2020, the most common diagnoses associated with appropriate prescriptions were urinary tract infection and streptococcal pharyngitis, compared with urinary tract infection and pneumonia during March 2020–December 2021. During both of these periods, the most common diagnoses associated with potentially appropriate prescriptions were acute sinusitis and acute pharyngitis. During January 2017–February 2020, the most common diagnoses associated with inappropriate prescriptions were cough and acute upper respiratory infection, compared with cough and “contact with and suspected exposure to COVID-19” during March 2020–December 2021.
Changes in Antibiotic Appropriateness in March 2020
In March 2020, there was no level change in the proportion of antibiotic prescriptions that were appropriate, but there was a slope decrease (−0.09 percentage points per month [95% confidence interval {CI}, −.14 to −.03]). In January 2017 and December 2021, this proportion was 13.7% and 13.5%, respectively (Figure 1; Table 2).
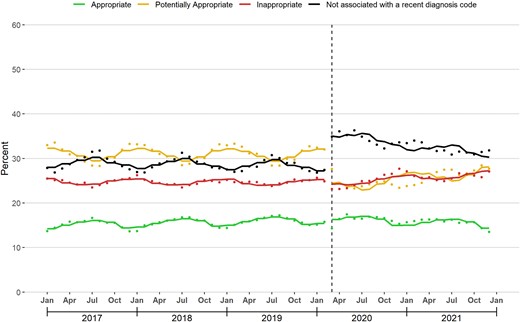
Changes in antibiotic appropriateness associated with the coronavirus disease 2019 (COVID-19) outbreak. The figure displays the monthly percentage of dispensed antibiotic prescriptions assigned to each appropriateness category. The solid line represents the fitted line from linear segmented regression models assessing for abrupt level and slope changes during March 2020 (vertical line).
Association Between the Coronavirus Disease 2019 Outbreak and Changes in the Main Outcomes
| Outcome | Intercept (95% CI) | Slope Before March 2020 (95% CI) | Level Change During March 2020 (95% CI) | Slope Change After March 2020 (95% CI) | Slope From March 2020 Onward (95% CI)a |
|---|---|---|---|---|---|
| % Rx appropriate | 14.19 (13.71–14.67) | 0.03 (.02–.04) | 0.14 (−.73 to 1.00) | −0.09 (−.14 to −.03) | −0.06 (−.12 to .00) |
| % Rx potentially appropriate | 32.27 (30.86–33.68) | 0.00 (−.04 to .03) | −7.08 (−8.89 to −5.28) | 0.17 (.06–.29) | 0.20 (.08–.31) |
| % Rx inappropriate | 25.49 (25.11–25.88) | −0.01 (−.02 to .01) | −0.05 (−1.05 to .96) | 0.11 (.04–.18) | 0.08 (.01–.15) |
| % Rx not associated with recent diagnosis code | 28.05 (26.98–29.12) | −0.02 (−.05 to .01) | 6.99 (5.77–8.21) | −0.20 (−.29 to −.11) | −0.22 (−.29 to −.15) |
| % enrollees with ≥1 antibiotic Rx | 6.51 (5.97–7.05) | −0.01 (−.02 to .00) | −1.47 (−2.13 to −.81) | 0.06 (.01–.10) | 0.05 (.01–0.09) |
| % enrollees with ≥1 appropriate antibiotic Rx | 0.93 (.88–.99) | 0.00 (.00–.00) | −0.23 (−.30 to −.17) | 0.01 (.00–.01) | 0.01 (.00–.01) |
| % enrollees with ≥1 potentially appropriate antibiotic Rx | 2.26 (2.00–2.51) | 0.00 (−.01 to .00) | −0.80 (−1.09 to −.51) | 0.02 (.01–.04) | 0.02 (.01–.04) |
| % enrollees with ≥1 inappropriate antibiotic Rx | 1.77 (1.61–1.94) | 0.00 (−.01 to .00) | −0.39 (−.57 to −.22) | 0.02 (.01–.03) | 0.02 (.01–.03) |
| % enrollees with ≥1 antibiotic Rx not associated with a recent diagnosis code | 1.92 (1.81–2.04) | 0.00 (−.01 to .00) | −0.12 (−.32 to .09) | 0.01 (−.01 to .02) | 0.01 (−.01 to .02) |
Bolded cells indicate point estimates that were significant at the α = .05 level.
Abbreviations: CI, confidence interval; Rx, prescription.
aThe second through fifth columns derive from a linear segmented regression model assessing for level or slope changes in monthly outcomes in March 2020. The sixth column represents the sum of the third and fifth columns.
In contrast, there was a large level decrease (−7.08 percentage points [95% CI, −8.89 to −5.28]) and slope increase (0.17 percentage points per month [95% CI, .06–.29]) in the proportion of prescriptions that were potentially appropriate in March 2020. In January 2017 and December 2021, the proportion of antibiotic prescriptions that were potentially appropriate was 33.0% and 27.7%, respectively.
In March 2020, there was no level change in the proportion of antibiotic prescriptions that were inappropriate, but there was a slope increase (0.11 percentage points per month [95% CI, .04–.18]). In January 2017 and December 2021, this proportion was 25.5% and 27.1%, respectively.
Finally, there was a large level increase (6.99 percentage points [95% CI, 5.77–8.21]) and slope decrease (−0.20 percentage points per month [95% CI, −.29 to −.11]) in the proportion of antibiotic prescriptions that were not associated with a recent diagnosis code in March 2020. In January 2017 and December 2021, this proportion was 27.9% and 31.8%, respectively.
Proportion of Enrollees With ≥1 Antibiotic Prescription
Between January 2017 and February 2020, the median monthly proportion of enrollees with ≥1 dispensed antibiotic prescription was 5.8% (25th–75th percentile: 5.3%–6.3%). In March 2020, there was a level decrease in this proportion (−1.47 percentage points [95% CI, −2.13 to −.81]) and a slope increase (0.06 percentage points per month [95% CI, .01–.10]; Figure 2; Table 2). In December 2021, this proportion was 5.8%, compared with 6.3% in December 2019, the last December before March 2020.
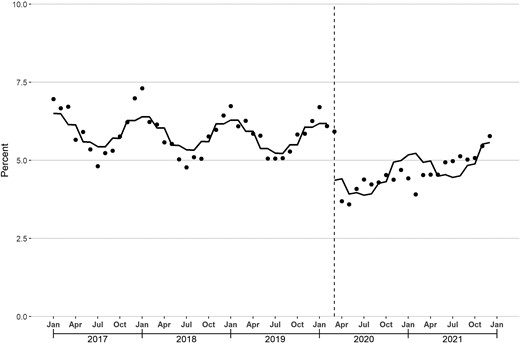
Monthly percentage of enrollees with ≥1 dispensed antibiotic prescription. The solid line represents the fitted line from linear segmented regression models assessing for abrupt level and slope changes during March 2020 (vertical line).
Proportion of Enrollees With ≥1 Antibiotic Prescription in Each Appropriateness Category
In March 2020, there was a level decrease and slope increase in the proportion of enrollees with ≥1 dispensed antibiotic prescriptions in each of the 4 appropriateness categories (Figure 3; Table 2). During January 2017–February 2020, the median proportion of enrollees with ≥1 inappropriate antibiotic prescription was 1.6% (25th–75th percentile: 1.4%–1.7%). This proportion declined sharply in March 2020, reached a nadir of 0.9% in May 2020, and increased to 1.7% by December 2021, equal to the proportion in December 2019.
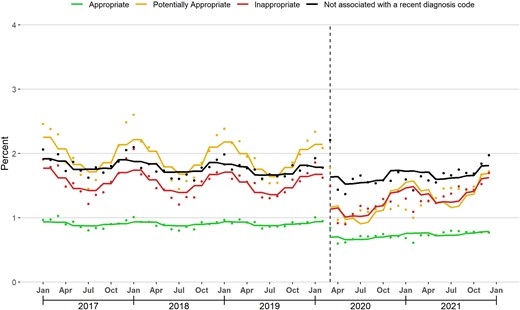
Monthly percentage of enrollees with ≥1 dispensed antibiotic prescription assigned to each appropriateness category. The solid line represents the fitted line from linear segmented regression models assessing for abrupt level and slope changes during March 2020 (vertical line).
Inappropriate Antibiotic Prescribing Associated With COVID-19 Infection
From March 2020–December 2021, 2.2% of all nonrefill antibiotic prescriptions and 9.2% of nonrefill inappropriate antibiotic prescriptions were associated with a diagnosis code for COVID-19 infection. This latter proportion ranged between 0.2% and 3.7% in March–October 2020, increased to 18.1% in January 2021, decreased to 6.8% in June 2021, and reached 15.3% during July–December 2021 (Figure 4).
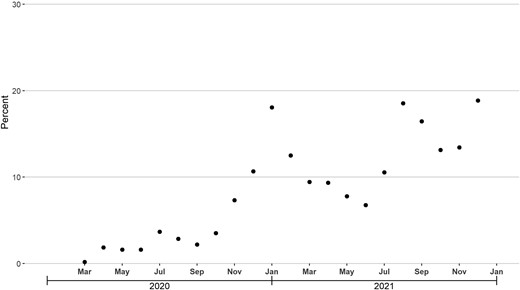
Monthly percentage of nonrefill inappropriate antibiotic prescriptions associated with a diagnosis code for coronavirus disease 2019 (COVID-19) infection during the 3-day look-back period, March 2020–December 2021.
Inappropriate Antibiotic Prescribing Associated With Telehealth Visits
From January 2017–February 2020, the proportion of nonrefill inappropriate antibiotic prescriptions associated with a recent telehealth visit was <1%. This proportion increased to 9.5% in March 2020, peaked at 36.0% in April 2020, then declined afterward (Figure 5). During the second half of 2021, 9.1% of nonrefill inappropriate antibiotic prescriptions were associated with a recent telehealth visit, compared with 13.2% during March–December 2020.

Monthly percentage of nonrefill inappropriate antibiotic prescriptions associated with a telehealth visit during the 3-day look-back period, March 2020–December 2021.
Subgroup Analyses
Supplementary Appendix 3–6 displays results and graphs for each subpopulation. In January 2017 and December 2021, the proportion of antibiotic prescriptions that were inappropriate was 15.5% and 17.0% in privately insured children, 24.0% and 26.0% in privately insured adults, and 31.0% and 29.6% in Medicare Advantage enrollees, respectively.
Antibiotic dispensing rebounded to a lesser degree among children compared with adults. In December 2019 and December 2021, the proportion of privately insured children with ≥1 antibiotic prescription was 6.1% and 4.5%, compared with 5.4% and 5.1% in privately insured adults and 7.6% and 6.9% in Medicare Advantage enrollees, respectively.
The proportion of privately insured children with ≥1 inappropriate antibiotic prescription was 1.0% and 0.8% in December 2019 and December 2021, compared with 1.4% and 1.4% among privately insured adults and 2.5% and 2.3% among Medicare Advantage enrollees, respectively. Finally, from March 2020 to December 2021, the proportion of nonrefill inappropriate antibiotic prescriptions associated with COVID-19 infection and telehealth visits was highest among privately insured adults (12.4% and 15.7%, respectively) and lowest among Medicare Advantage enrollees (7.0% and 10.0%, respectively).
DISCUSSION
To our knowledge, this study provides the first national data on changes in the appropriateness of outpatient antibiotic prescribing across all age groups and conditions after the COVID-19 outbreak in March 2020. Three key findings emerged. First, the proportion of antibiotic prescriptions that were inappropriate increased after March 2020. Second, the proportion of enrollees with ≥1 antibiotic prescription declined sharply in March 2020 and rebounded to a level that was just below the prepandemic baseline by December 2021. Finally, the proportion of enrollees with ≥1 inappropriate prescription similarly declined sharply in March 2020. However, unlike the proportion of enrollees with ≥1 antibiotic prescription, the proportion with ≥1 inappropriate antibiotic prescription had reached the prepandemic baseline by December 2021.
Collectively, findings suggest that fewer individuals were exposed to harms from inappropriate antibiotic prescribing during the early stages of the COVID-19 pandemic, likely owing to sharp declines in visits for infections [24]. However, the share of prescriptions that were inappropriate was increasing as of December 2021. If this trend continues, the incidence of preventable harm from inappropriate antibiotic prescribing could be greater than it was before the pandemic, especially given that US antibiotic dispensing had returned to prepandemic levels by the end of 2022 [4]. This consideration underscores the continued importance of outpatient antibiotic stewardship initiatives.
Two additional considerations potentially further underscore the importance of these initiatives. First, the proportion of antibiotic prescriptions classified as inappropriate is likely a lower bound of the true rate of inappropriate antibiotic prescribing, as a substantial proportion of antibiotic prescriptions were classified as potentially appropriate. Second, the proportion of antibiotic prescriptions that were not associated with a recent diagnosis code increased after March 2020. Owing to data limitations, we cannot ascertain the appropriateness of these prescriptions. However, 1 way in which these prescriptions might arise is if clinicians wrote an antibiotic prescription after an encounter not billed to insurance. To the degree that these encounters are more likely to represent non–in-person visits (eg, phone visits), and to the degree that inappropriate antibiotic prescribing is more likely to occur without the ability to examine or test patients, the rise in the share of antibiotic prescriptions without a recent diagnosis code may represent an increase in unnecessary prescribing.
Subgroup analyses revealed heterogeneity by age group and payer type. Among privately insured children, the proportion with ≥1 inappropriate prescription in December 2021 was still below the corresponding proportion in December 2019 despite an increase in the share of antibiotic prescriptions that were inappropriate, largely because overall antibiotic dispensing had not fully recovered. For Medicare Advantage enrollees, the proportion with ≥1 inappropriate prescription in December 2021 was also still below the proportion in December 2019, but among privately insured adults, these proportions were the same. Findings suggest that targeted antibiotic stewardship initiatives focused on privately insured adults may be warranted.
Among inappropriate antibiotic prescriptions dispensed from March 2020 to December 2021, 9% were associated with a diagnosis for COVID-19 infection. However, in the second half of 2021, when US cases of COVID-19 increased sharply [25], this proportion rose to 15%. This finding suggests that stewardship initiatives focused on preventing inappropriate antibiotic prescribing for COVID-19 may be needed when cases rise.
Before March 2020, few inappropriate antibiotic prescriptions were associated with a recent telehealth visit, likely because telehealth was rarely used. During March–May 2020, when widespread social distancing measures were implemented, the share of inappropriate antibiotic prescriptions associated with a recent telehealth visit increased sharply. After May 2020, however, this share decreased, potentially owing to the relaxation of social distancing measures and the recovery of in-person visits [26, 27]. Findings suggest that antibiotic stewardship initiatives focusing on preventing inappropriate antibiotic prescribing after telehealth visits may be warranted if social distancing measures are required during future pandemics, whether related to COVID-19 or another novel virus.
Our findings are consistent with prior studies in the US and elsewhere that have shown frequent inappropriate prescribing for COVID-19 infection [10, 28, 29] and increases in the rate of inappropriate antibiotic prescribing for specific conditions, such as upper respiratory infections, during the COVID-19 pandemic [12, 30]. Compared with these prior studies, a key strength of our study was its assessment of the appropriateness of outpatient antibiotic prescribing across all conditions.
Another strength was the use of a national claims database. Claims capture all dispensed outpatient antibiotic prescriptions paid with insurance, regardless of whether the prescriptions were temporally associated with a recent in-person visit or virtual visit, or whether the prescriptions were associated with any recent visits at all. Given the dramatic shifts in the site of outpatient care during the pandemic [27], the comprehensiveness of claims makes them an attractive choice for assessing changes in outpatient antibiotic appropriateness compared with databases that only capture care in specific settings, such as electronic health record databases.
However, this study had limitations. First, because we relied on diagnosis codes to assess the appropriateness of antibiotic prescribing, some misclassification likely occurred. Any misclassification would not bias results unless the quality of coding changed during the pandemic, but we acknowledge that such a change may have occurred. Second, our database does not include the Medicaid population or the uninsured and is not representative of all privately insured or Medicare Advantage enrollees. Third, we cannot determine why the proportion of antibiotic prescriptions without a recent diagnosis code rose after March 2020. Fourth, we lacked access to data beyond 2021. Fifth, the database did not report information on race, ethnicity, or socioeconomic status. Sixth, analyzing changes in other key outcomes, such as the choice and duration of antibiotic therapy, was beyond the study's scope.
CONCLUSIONS
In this national study, the share of antibiotic prescriptions that were inappropriate increased after March 2020 and was rising as of December 2021. Antibiotic stewardship initiatives are needed to reverse this rise, thus preventing unnecessary morbidity and morbidity associated with antibiotic-related adverse events and antimicrobial resistance.
Supplementary Data
Supplementary materials are available at Clinical Infectious Diseases online. Consisting of data provided by the authors to benefit the reader, the posted materials are not copyedited and are the sole responsibility of the authors, so questions or comments should be addressed to the corresponding author.
Notes
Author Contributions. K.-P. C. had full access to all of the data in the study and takes responsibility for the integrity of the data and the accuracy of the data analysis. Study concept and design: K.-P. C., M. A. F., M. R., and J. A. L. Acquisition of data and statistical analysis: K.-P. C. and M. R. Analysis and interpretation of data: K.-P. C., M. A. F., M. R., and J. A. L. Drafting of the manuscript: K.-P. C. Critical revision of the manuscript: K.-P. C., M. A. F., M. R., and J. A. L. Study supervision: J. A. L.
Data availability. Because Optum data are proprietary, the data for this study cannot be shared.
Disclaimer. The funders played no role in the design and conduct of the study; collection, management, analysis, and interpretation of the data; preparation, review, or approval of the manuscript; or decision to submit the manuscript for publication.
Financial support. K.-P. C. is supported by the National Institute on Drug Abuse (grant numbers R01DA056438-01, R01DA057284-01, and K08DA048110-05). J. A. L. is supported by the National Institute on Aging (grant numbers P30AG059988, R01AG069762, R01AG074245, P30AG024968, R01AG070054, R33AG057395, and R24AG064025) and the Agency for Healthcare Research and Quality (grant numbers R01HS026506 and R01HS028127).
References
Author notes
Presented in part: 2023 Pediatric Academic Societies Annual Meeting, Washington, District of Columbia, 30 April 2023, Abstract ID #1415474.
Potential conflicts of interest. K.-P. C. reports receiving honoraria from the Benter Foundation and consulting fees from the US Department of Justice for work outside of the submitted manuscript. All other authors report no potential conflicts.
All authors have submitted the ICMJE Form for Disclosure of Potential Conflicts of Interest. Conflicts that the editors consider relevant to the content of the manuscript have been disclosed.

