


Abstract
The Quality Premium was introduced in 2015 to financially reward local commissioners of healthcare in England for targeted reductions in antibiotic prescribing in primary care.
We used a national antibiotic prescribing dataset from April 2013 until February 2017 to examine the number of antibiotic items prescribed, the total number of antibiotic items prescribed per STAR-PU (specific therapeutic group age/sex-related prescribing units), the number of broad-spectrum antibiotic items prescribed, and broad-spectrum antibiotic items prescribed, expressed as a percentage of the total number of antibiotic items. To evaluate the impact of the Quality Premium on antibiotic prescribing, we used a segmented regression analysis of interrupted time series data.
During the study period, over 140 million antibiotic items were prescribed in primary care. Following the introduction of the Quality Premium, antibiotic items prescribed decreased by 8.2%, representing 5933563 fewer antibiotic items prescribed during the 23 post-intervention months, as compared with the expected numbers based on the trend in the pre-intervention period. After adjusting for the age and sex distribution in the population, the segmented regression model also showed a significant relative decrease in antibiotic items prescribed per STAR-PU. A similar effect was found for broad-spectrum antibiotics (comprising 10.1% of total antibiotic prescribing), with an 18.9% reduction in prescribing.
This study shows that the introduction of financial incentives for local commissioners of healthcare to improve the quality of prescribing was associated with a significant reduction in both total and broad-spectrum antibiotic prescribing in primary care in England.
(.)
Antimicrobial resistance is a serious public health problem and a global threat, with an estimated 10 million people a year predicted to die of drug-resistant infections by 2050 [1]. It is known that prescribing and consumption of antibiotics is a key driver of resistance and, given the seriousness of the resistance threat, there was a clear need for a change in prescribing policies to reduce the inappropriate use of antibiotics in both primary and secondary care. In the last decade, there were various antimicrobial stewardship programs with financial incentives (pay-for-performance) or without financial incentives (educational, audits, guidelines) that were implemented across the globe with the intention to reduce antibiotic prescribing [2–10].
Since 1999, there have been various seasonal campaigns in the United Kingdom that attempted to reduce antibiotic prescribing [11]. Despite this, the number of antibiotic items dispensed in the community per 100 inhabitants per year from 2010 to 2014 remained relatively stable [12]. In 2015, National Health Service England published a Quality Premium that was intended to financially reward Clinical Commissioning Groups (CCGs) for improvements in the quality of the services that they commission. CCGs are clinically-led public bodies, responsible for the planning and commissioning of healthcare services for their local population [13, 14]. Among the specified improvements in the 2015–16 Quality Premium was a requirement for CCGs to reduce both the total number of antibiotics prescribed and the proportion of broad-spectrum antibiotics (specifically, co-amoxiclav, cephalosporins, and quinolones) prescribed in primary care [15].
In this study, we assessed the impact of the introduction of the Quality Premium on antibiotic prescribing in primary care using an interrupted time series (ITS) analysis to compare pre-existing trends in prescribing before the intervention with those seen subsequently.
METHODS
Study Design and Setting
We conducted a quasi-experimental ITS analysis that covered a period of 47 months, comprising the 2 years prior to the introduction of the Quality Premium (1 April 2013 to 31 March 2015) and a period of 23 months after its implementation (1 April 2015 to 28 February 2017). We used a national prescribing dataset from the Information Service Portal, provided by NHS Business Services Authority (https://www.nhsbsa.nhs.uk/information-services-portal-isp), which was obtained by submitting a freedom of information request. The dataset included information about the number of dispensed items per month and specific therapeutic group age/sex-related prescribing units (STAR-PUs) in England. A prescription item refers to a single item prescribed by a general practitioner on a prescription form. If a prescription form included 3 different antibiotics, then it was counted as 3 prescription items. The STAR-PU was developed in 1995, and is a cost-based weighting method for overall prescribing that allows comparisons after adjusting for the age and sex distribution of each practice and CCG [16]. The dataset was analyzed to determine both the total number of antibacterial items prescribed and the number of broad-spectrum antibiotic (co-amoxiclav, cephalosporins, and quinolones) items prescribed over time.
Intervention
The Quality Premium 2015–16 guidance for CCGs was published in April 2015 and is based on 5 quality measures that cover a combination of national and local priorities [15]. Among the measures is the improvement of antibiotic prescribing in primary care. It consists of 3 parts: (1) reductions in the number of antibiotics prescribed in primary care by 1% (or greater) from each CCG’s 2013–14 value; (2) reductions in the proportion of broad-spectrum antibiotics, as a percentage of the total number of selected antibiotics prescribed in primary care, either by 10% from each CCG’s 2013–14 value or to be below the 2013–14 median proportion for English CCG’s; and (3) secondary care providers validating their total antibiotic prescription data. The maximum Quality Premium payment for a CCG was expressed as £5 per head of population, calculated using the same methodology as for CCG running costs [15]. The measure of the improvement of antibiotic prescribing in primary care make up 10% of Quality Premium, the amount awarded to CCGs.
Outcome Measures
We used 4 antibiotic prescribing-outcome measures: the total number of antibiotic items prescribed, the total number of antibiotic items prescribed per STAR-PU, the number of broad-spectrum antibiotic items prescribed, and the number of broad-spectrum antibiotic items prescribed, expressed as a percentage of the total number of antibiotic items.
Statistical Analyses
To identify seasonal changes in antibiotic prescribing, we applied the X12 SAS procedure, which is an adaptation of the US Bureau of the Census X-12–Auto-Regressive Integrated Moving Average (ARIMA) model that produces a seasonally-adjusted time series [17–21]. The combination of the F test for both stable (between months) and moving (between years) seasonalities, along with a Kruskal-Wallis test for stable seasonality, were used to test for identifiable seasonality.
We used an ITS analysis, a strong quasi-experimental design, to evaluate the impact of the Quality Premium on antibiotic prescribing [22–26]. To assess an assumption that observations are independent, known as autocorrelation, we used a Durbin-Watson statistic. The ARIMA model was used to adjust for autocorrelation. For estimating seasonal autocorrelation, the auto-regression model needs to evaluate correlations between error terms, separated by multiples of 12 months. Accounting for seasonally-correlated errors usually requires at least 24 months of data points [26]. Using a segmented regression model, we looked for changes in the level and trend of antibiotic prescribing before and after the introduction of the Quality Premium. Changes in the level and trend with Ps < .05 were considered as statistically significant. To assess the fit of the model parameters, the maximum likelihood ratio test was used. Furthermore, a general recommendation to achieve robust estimates of change is a minimum of 100 cases per time point [26]. The absolute change was defined as the difference between the observed value and the estimated value if the Quality Premium had not been introduced (the counterfactual value, based on the pre-implementation trend). The relative change, expressed as a percentage, was defined as the ratio of the observed value to the counterfactual value. We used bootstrapping methods developed by Chang et al [27, 28] to estimate the 95% confidence intervals (CIs) for absolute and relative change.
All statistical analyses were performed using SAS version 9.4 (SAS Institute, Cary, NC).
RESULTS
During the period between April 2013 and February 2017, over 140 million antibiotic items were prescribed in England. Broad-spectrum antibiotic items (co-amoxiclav, cephalosporins, and quinolones) comprised 10.1% of the total number of antibiotic items prescribed (Figure 1). Seasonal variation was observed, with a higher number of antibiotic prescriptions in winter months compared with the summer periods (Supplementary Table 1).
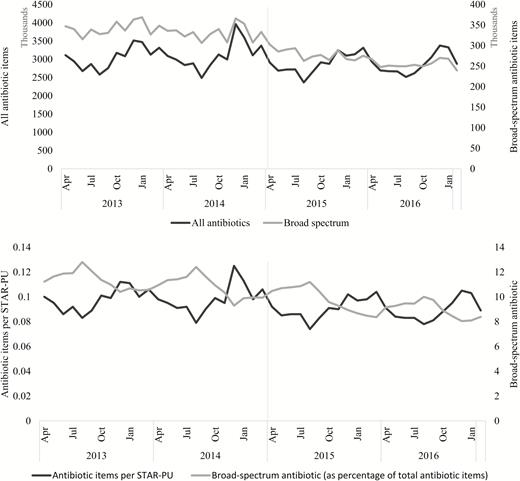
The number of all antibiotic and broad-spectrum antibiotic (co-amoxiclav, cephalosporins, and quinolones) items prescribed; antibiotic items prescribed per STAR-PU; and broad-spectrum antibiotic items prescribed (as a percentage of total antibiotic items) in general practice by month, in England, from April 2013–February 2017 (vertical grey line represents the implementation of the Quality Premium). Abbreviation: STAR-PU, specific therapeutic group age/sex-related prescribing units.
Before the Quality Premium was implemented, there was an increase in the average monthly number of all antibiotic items prescribed, from 3051822 (95% CI 2870381–3233263) in 2013–14 to 3108827 (95% CI 2873893–3343760) in 2014–15, representing a 1.9% increase in overall antibiotic prescribing in 2014–15 from 2013–14. However, looking at the antibiotic items prescribed per STAR-PU, there was only a 0.6% increase in 2014–15 from 2013–14. During the same period, the average monthly broad-spectrum antibiotic items prescribed decreased from 341964 (95% CI 332269–351658) to 330882 (95% CI 319771–341992), representing a 3.2% decrease in broad-spectrum antibiotic prescription in 2014–15 from 2013–14.
Comparing financial year 2015–16 to the year 2013–14, a decrease in antibiotic prescribing was detected. The total number of antibiotic items prescribed dropped by 5.4%, representing almost 2 million fewer antibiotic items dispensed. During the same period, the number of broad-spectrum antibiotic items prescribed dropped by 18.5%, with over 750 thousand fewer broad-spectrum antibiotic items dispensed.
Over the longer term, a segmented regression analysis of monthly data indicated a significant decrease in the level of prescribing for all antibiotic items, for antibiotic items per STAR-PU, and for broad-spectrum antibiotic items following the introduction of the Quality Premium (Table 1, Figure 2). The estimated relative decrease by the end of February 2017 was 8.2% (95% CI -14.2–-2.2%), representing 5933563 fewer antibiotic items prescribed during the 23 post-intervention months, as compared with the expected numbers based on the trend in the pre-intervention period. After adjusting for the age and sex distribution in the population, the segmented regression model also showed a significant relative decrease in antibiotic items prescribed per STAR-PU. A significant decrease was also estimated for broad-spectrum antibiotic items prescribed (-18.9%, 95% CI -24.1–-13.7%), representing 1303410 fewer broad-spectrum antibiotic items prescribed during the 23 post-intervention months, as compared with the expected numbers based on the trend in the pre-intervention period.
Segmented Regression Analysis for Antibiotics Prescribing Measures
| Prescribing Measures | Constant | Pre intervention Trend (P) | Change in Level (P) | Post intervention Trend (P) | Absolute Change in Outcome per Month During the Post intervention Period (95% CI) | Relative Change by the End of the Study, % (95% CI) |
|---|---|---|---|---|---|---|
| All antibiotic items prescribed | 3050481 | 2288 (.41) | –251661 (<.01) | 448 (.65) | –257981 (–462474 to –53483) | –8.2 (–14.2 to –2.2) |
| Antibiotic items prescribed per STAR-PU | 0.0985 | –0.00003 (.75) | –0.00652 (<.01) | –0.00007 (.75) | –0.0074 (–0.0139 to –0.0010) | –7.7 (–13.8 to –1.5) |
| Broad-spectrum antibiotic items prescribed | 350003 | –1082 (<.01) | –28012 (<.01) | –2328 (<.01) | –56670 (–75237 to –38082) | –18.9 (–24.1 to –13.7) |
| Broad-spectrum antibiotic items prescribed (as a percentage of the total number of antibiotic items) | 11.6 | –0.0433 (<.01) | –0.1327 (.44) | –0.0795 (.04) | –0.9 (–1.7 to –0.2) | –10.1 (–17.8 to –2.4) |
Abbreviations: CI, confidence interval; STAR-PU, specific therapeutic group age/sex-related prescribing units.
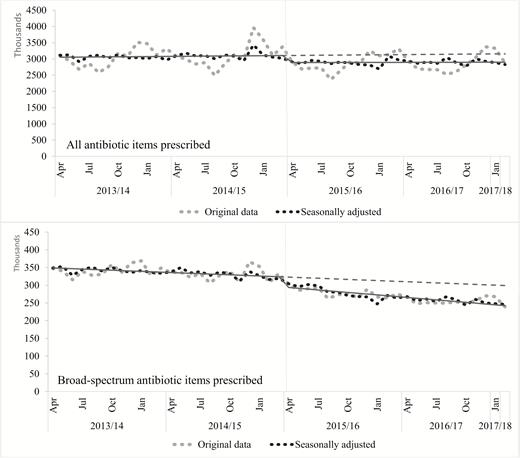
Segmented regression analysis for all antibiotic and broad-spectrum antibiotic items prescribed. The solid line is for the estimates of the segmented regression model; the dotted line is for the estimated regression model without intervention. Implementation of the Quality Premium (represented by a vertical grey line) occurred in April 2015.
DISCUSSION
We found that the Quality Premium was associated with a significant, 8.2% decrease in all antibiotic items prescribed and a significant, 18.9% decrease in broad-spectrum antibiotic (co-amoxiclav, cephalosporins, and quinolones) items prescribed, when compared with the trend in prescribing before its introduction.
An important strength of this study is the use of ITS analysis. ITS analysis is the strongest quasi-experimental research design and is useful when a randomized, controlled trial (RCT) is unfeasible or unethical. Segmented regression analysis addresses threats to internal validity by making multiple assessments of the outcome variable, both before and after the intervention. The key advantage is that it considers the prevailing trends in the outcome prior to the intervention. Furthermore, it can estimate the size of the association at different time points, as well as changes in the trend of the association over time.
Our study has several limitations. Firstly, the dataset obtained from the Information Service Portal, provided by NHS Business Services Authority, only includes antibiotic prescriptions dispensed: that is, it did not include prescriptions written but not dispensed. Secondly, the dataset does not include any information related to general practitioners or clinical diagnoses. And finally, while providing strong evidence for an association, our study was not able to identify a causal relationship between the Quality Premium and antibiotic prescribing. It is difficult and rarely possible to do RCTs to evaluate the impact of policy changes. However, observational studies based on ITS analyses are a valid approach.
Previous studies that investigated the association between antimicrobial stewardship programs with and without financial initiatives (pay-for-performance, educational programs, audits, guidelines) and antibiotic prescribing in primary care have found mixed results [2–10]. A Chinese study using a matched-pair, cluster-randomized experiment found that a pay-for-performance intervention was associated with an approximate 15% reduction in antibiotic prescriptions [2]. Another study in the United States that investigated the impact of 2 pay-for-performance programs on improvements in healthcare quality in California found a 6% improvement of the rate of appropriate antibiotic prescribing [3]. However, in these studies, pay-for-performance was used in conjunction with other important policy changes: a complete restructuring of the payment scheme from fee-for-service to capitation [2] and the introduction of other pay-for-performance indicators [3]. A Swedish study evaluated the effect of pay-for-performance for antibiotic prescribing in the treatment of children with respiratory tract infections, though the financial incentives encouraged physicians to select narrow-spectrum antibiotics [4]. The authors found that pay-for-performance significantly increased the proportion of narrow-spectrum antibiotics (penicillin V) prescribed, which reflected a substitution of penicillin V for broad-spectrum antibiotics. A recent study in England found that the Quality Premium was associated with a 3% reduction in antibiotic prescribing for uncomplicated respiratory tract infections [5]. A practice-based RCT in Wales found that an educational program was associated with a significant, 4.2% reduction in total oral antibiotics dispensed for a year [6]. Another cluster-randomized trial in the United States, which evaluated the effect of antimicrobial stewardship on broad-spectrum antibiotic prescribing for pediatric outpatients, showed that the intervention nearly halved prescribing of broad-spectrum antibiotics by 1 year after the intervention [7]. However, an RCT in Switzerland found no association between a nationwide antibiotic stewardship program and a change in antibiotic prescribing [8]. An antimicrobial stewardship program in Sweden was associated with a reduction of antibiotic use [9]. A literature review that investigated the effect of physician-targeted interventions between 1990 and 2009 on antibiotic prescribing for respiratory tract infections in primary care, more than 90% of which had no financial element, found that interventions, on average, reduced antibiotic prescribing by 11.6% [10]. However, studies included in the literature review focused on the interventions directly targeting physicians rather than organizational structures (CCGs in our case).
CONCLUSIONS
The findings from this study show that the introduction of the 2015–16 Quality Premium was associated with a significant reduction in all antibiotic items and broad-spectrum antibiotic items prescribed. This study shows that pay-for-performance can significantly reduce antibiotic use, and specifically broad-spectrum antibiotic use. However, further research is needed to assess the impact (if any) of the Quality Premium on adverse clinical outcomes to reassure the public, patients, general practitioners, and policymakers that measures to reduce inappropriate antibiotic prescribing do not adversely affect patient safety.
Supplementary Data
Supplementary materials are available at Clinical Infectious Diseases online. Consisting of data provided by the authors to benefit the reader, the posted materials are not copyedited and are the sole responsibility of the authors, so questions or comments should be addressed to the corresponding author.
Notes
Author contributions. All authors contributed to the original research proposal. All authors helped refine the classification of the outcome used. V. B. carried out the analysis. V. B. and P. A. wrote the first draft, and all authors commented on subsequent drafts of the manuscript.
Disclaimer. The views expressed in this article are those of the authors and do not necessarily represent the position of the funder. The findings achieved herein are solely the responsibility of the authors. The Dr Foster Unit at Imperial is affiliated with the National Institute for Health Research (NIHR) Imperial Patient Safety Translational Research Centre, a partnership between the Imperial College Healthcare National Health Service Trust and Imperial College London.
Financial support. This work was supported by the NIHR Policy Research Programme (research to determine the impact of the national antimicrobial stewardship programs on clinical outcomes and patient safety and to establish sustainable systems). The Dr Foster Unit—an academic unit in the Department of Primary Care and Public Health, within the School of Public Health, Imperial College London—receives research funding from the NIHR and Dr Foster Intelligence, an independent health service research organization (a wholly-owned subsidiary of Telstra). This work was supported by the NIHR Health Protection Research Unit in Healthcare Associated Infections and Antimicrobial Resistance at Imperial College London in partnership with Public Health England. The Department of Primary Care & Public Health at Imperial College London is supported by the North West London NIHR Collaboration for Leadership in Applied Health Research & Care and the Imperial NIHR Biomedical Research Centre.
Potential conflicts of interest. A. H. received an honorarium for presenting at a conference entitled South African Antibiotic Stewardship Programme Annual Workshop, sponsored by Merck (MSD Hoddesdon). All other authors report no potential conflicts. All authors have submitted the ICMJE form for disclosure of potential conflicts of interest. Conflicts that the editors consider relevant to the content of the manuscript have been disclosed.
References
Naylor C, Curry N, Holder H, Ross S, Marshall L and Tait E.

