


Abstract
Several clinical trials of tuberculosis preventive treatment (TPT) for household contacts of patients with multidrug- or rifampin-resistant tuberculosis (MDR/RR-TB) are nearing completion. The potential benefits of delivering TPT to MDR/RR-TB contacts extend beyond the outcomes that clinical trials can measure.
We developed an agent-based, household-structured TB and MDR/RR-TB transmission model, calibrated to an illustrative setting in India. We simulated contact investigation in households of patients with MDR/RR-TB, comparing an MDR/RR-TPT regimen (assuming 6-month duration, 70% efficacy) and associated active case finding against alternatives of contact investigation without TPT or no household intervention. We simulated the TB and MDR/RR-TB incidence averted relative to placebo over 2 years, as measurable by a typical trial, as well as the incidence averted over a longer time horizon, in the broader population, and relative to no contact investigation.
Observing TPT and placebo recipients for 2 years as in a typical trial, MDR/RR-TPT was measured to prevent 72% (interquartile range, 45%–100%) of incident MDR/RR-TB among recipients; the median number needed to treat (NNT) to prevent 1 MDR/RR-TB case was 73, compared to placebo. This NNT decreased to 54 with 13–18 years of observation, to 27 when downstream transmission effects were also considered, and to 12 when the effects of active TB screening were included by comparing to a no-household-contact-intervention scenario.
If forthcoming trial results demonstrate efficacy, the long-term population impact of TPT for MDR/RR-TB—including the large effect of increased active TB detection among MDR/RR-TB contacts—could be much greater than suggested by trial outcomes alone.
Household contacts of people diagnosed with tuberculosis (TB) benefit from TB screening and TB preventive treatment (TPT) [1, 2]. Contact with multidrug- or rifampin-resistant TB (MDR/RR-TB) carries additional risk, because delays in diagnosis and effective treatment of MDR/RR-TB prolong exposure among contacts [3] and because the treatment options for contacts who develop MDR/RR-TB are less effective and more toxic [4]. Therefore, interventions to detect or prevent TB, including MDR/RR-TB, in the contacts of MDR/RR-TB patients are a high clinical and public health priority.
Despite the potential for benefit, efforts to intervene among contacts of people with MDR/RR-TB have been limited by the lack of a TPT regimen with proven activity against MDR/RR-TB. Now, however, the World Health Organization (WHO) conditionally recommends preventive treatment for high-risk household contacts of people with MDR/RR-TB [5], and at least 3 clinical trials will soon provide robust data on the efficacy of fluoroquinolones or delamanid as preventive treatment in this population [6–8].
If these trials demonstrate efficacy of TPT in preventing MDR/RR-TB among household contacts, the epidemiological impact of this TPT will extend beyond trial-based estimates of efficacy. TPT could both cure TB infections that would otherwise progress to TB disease after trial completion and prevent secondary transmission events that would otherwise cause TB in individuals who are not clinical trial participants. In addition, household contact investigation itself has important benefits, given that 4% or more of MDR/RR-TB household contacts may have co-prevalent active TB [9] and uptake of contact investigation remains low in many settings [10].
In weighing risks and benefits in decisions about whether to scale up preventive treatment for MDR/RR-TB contacts, it is important to capture this full spectrum of expected impact. We therefore developed an agent-based, household-structured transmission model of a TB epidemic, which we used to better understand the relationship between trial-measured effects and anticipated population-level impact of delivering TPT (and associated contact investigation) to MDR/RR-TB household contacts. We assume that a trial would measure all incident drug-susceptible TB (DS-TB) and MDR/RR-TB occurring within 2 years of initiation of TPT or placebo [comparable to the follow-up periods of 96 weeks in (phase III trial of AMX0035 for amyotrophic lateral sclerosis treatment) PHOENIx [8], 2 years in the tuberculosis child multidrug-resistant preventive therapy (TB-CHAMP) [7], and 2.5 years in V-QUIN A randomized controlled trial of six months of daily levofloxacin for the prevention of tuberculosis among household contacts of patients with multi-drug resistant tuberculosis (MDR TRIAL) [6]] among under-5 or latently infected contacts who screened negative for active TB at enrollment. We compare these trial-observable outcomes to individual- and population-level outcomes on a longer time horizon. The modeled TPT intervention, using a drug to which little resistance currently exists (delamanid), most closely parallels the ongoing PHOENIx trial, but our results would also apply to fluoroquinolone TPT (evaluated by TB-CHAMP and V-QUIN) in settings where the prevalence of fluoroquinolone resistance among MDR/RR-TB is low.
METHODS
At an individual level, the natural history of TB is modeled as shown in Figure 1A . In brief, it includes the potential for infection with DS-TB and/or MDR/RR-TB strains; a risk of progression to active disease that depends on time since infection; and the potential for TB mortality, diagnosis with or without drug susceptibility testing, successful or unsuccessful treatment, and drug resistance acquisition. TB progression risks, infectivity, and contact patterns are age-dependent. Individuals with active TB can transmit infection to other household members and (with lower probability) to their community contacts each month (Supplementary TableE1). Further details are shown in Supplementary MaterialE1.
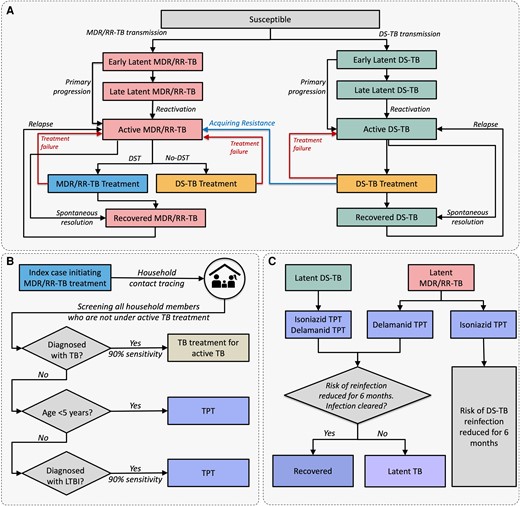
Schematic representation of tuberculosis (TB) natural history and modeled interventions. A, Natural history of drug-susceptible TB and multidrug- or rifampin-resistant TB; risk of mortality is included in the model and applies to all simulated individuals but for simplicity is not shown here. B, Household contact investigation process. Household contacts diagnosed with active TB and those receiving TB treatment are ineligible for TB preventive treatment (TPT). C, Modeled effects of isoniazid and delamanid TPT; prevention of relapse among recently recovered patients is also included but not shown here. Relapse risk is present only in the first 2 years after treatment of active TB and does not apply to those in the recovered state after preventive treatment. Abbreviations: DS-TB, drug-susceptible tuberculosis; LTBI, latent tuberculosis; MDR/RR-TB, multidrug- or rifampin-resistant tuberculosis; TB, tuberculosis; TPT, tuberculosis preventive treatment.
We calibrated the model to data from India, the country accounting for 26% of global MDR/RR-TB. We simulate a growing population, with an arbitrarily selected initial size that results in approximately 800 000 simulated people in 2022 (Supplementary FigureE1). Demographics and TB burden are based on India-wide estimates. Starting from prior distributions informed by literature from India (for treatment practices) and other high-TB-, low-HIV-burden settings (for TB natural history) (Supplementary FigureE2, Table 1 , Supplementary TableE2), we use sampling-importance-resampling to calibrate the model to 2019 estimates from India on TB incidence and its temporal trend [30], TB prevalence [30], TB mortality [30], rifampin resistance among new and previously treated patients [30], and latent TB infection (LTBI) [31], as well as to an estimate from high-burden settings of the proportion of active TB that results from household-based transmission [32] (Supplementary FigureE3 and Supplementary TableE3).
List of Model Parameters and Prior Distributions
| Parameter | Prior Distribution Type | Prior Distribution Valuesa | References |
|---|---|---|---|
| Cumulative probability of primary TB disease in the first 5 y postinfection among persons >15 y old at the time of infection | Lognormal | 0.09 (0.06–0.13) | [11] |
| Relative risk of primary TB disease in the first 5 y postinfection, relative to persons >15 y oldb | [11] | ||
| Persons ≤2 y | Fixed value | 2.22 | |
| Persons >2 to 10 y | Fixed value | 0.22 | |
| Persons >10 to 15 y | Fixed value | 0.33 | |
| Annual probability of reactivation >5 y postinfectionb | Beta | 0.00075 (0.00054–0.001) | [12–14] |
| Relative reduction in reinfection risk if latently infected | Beta | 0.30 (0.14–0.50) | [11, 15] |
| Crude TB transmission risk, per monthb,c,d | |||
| Household contacts | Uniform | [0.0–0.3] | |
| Nonhousehold contacts | Uniform | [0.0–0.005] | |
| Infectiousness of MDR/RR-TB, relative to DS-TB | Beta | 0.75 (0.41–0.95) | [16–18] |
| Infectiousness while failing treatment, relative to untreated TB | Uniform | [0–1] | |
| Infectiousness of children ≥10 y, relative to adults | Beta | 0.001 (0.000026–0.0058) | [19] |
| Monthly probability of spontaneous resolution from ATB | Beta | 0.01 (0.00231–0.02) | [20, 21] |
| Maximum monthly probability of ATB mortalityd | Uniform | [0.0–0.03] | |
| Maximum monthly probability of seeking care for ATBd | Uniform | [0.1–0.15] | |
| Probability of pretreatment loss-to-follow-up | [22, 23] | ||
| DS-TB | Beta | 0.13 (0.10–0.17) | |
| MDR/RR-TB | Beta | 0.23 (0.18–0.29) | |
| Probability of treatment failure | |||
| DS-TB | Beta | 0.03 (0.02–0.04) | [24] |
| MDR/RR-TB | Beta | 0.024 (0.17–0.32) | [25] |
| MDR/RR-TB treated with DS-TB regimens | Beta | 0.90 (0.78–0.97) | [26] |
| Probability of relapse in the 2 years after resolution | Beta | 0.06 (0.04–0.09) | [25, 27] |
| Probability of acquiring resistance following DS-TB treatment (after 1970) | Beta | 0.005 (0.0009–0.02) | [28, 29] |
| Annual reduction in TB transmission post-2000 | Uniform | [0.0–0.012] | |
| Annual reduction in TB reactivation post-2000 | Uniform | [0.0–0.012] |
Abbreviations: ATB, active tuberculosis; DS-TB, drug-susceptible tuberculosis; MDR/RR-TB, multidrug-resistant/rifampin-resistant tuberculosis; TB, tuberculosis.
aPrior distributions are represented as the median (2.5th–97.5th percentile) for Beta and lognormal distributions, and as [minimum–maximum] for uniformly distributed priors. Uniform priors are chosen to be minimally informative, and their ranges were adjusted empirically such that well-fitting models had values far from the endpoints.
bPrior to decline in transmission and reactivation after year 2000.
cThis crude risk applies to a maximally infectious adult DS-TB case and fully susceptible contact. It may be adjusted for the index case's infectiousness and the contact's immunity to reinfection to determine the final transmission probability.
dParameters are modeled as a linear function of time since active disease development, reaching a maximum value at 9 months since infection and staying at that level afterward.
Experimental Scenarios
We simulate a household contact tracing (HHCT) intervention in the households of patients treated for MDR/RR-TB (Figure 1B ). This intervention includes screening for active TB (90% sensitivity, with treatment if positive), followed by TPT for all TB-negative contacts who either test positive for LTBI (90% sensitivity) or are <5 years old. We model 2 alternative 6-month TPT regimens: 1 active only against DS-TB infections (“isoniazid”) and 1 active against all DS-TB and MDR/RR-TB infections (“delamanid”). We further include a “placebo” comparator (screening for active TB but no TPT), and a “no-intervention” comparator (no HHCT). TPT is modeled as having 70% preventive efficacy (Supplementary TableE4).
The modeled intervention is a short-term program: It begins in 2023 and continues for 5 years, reaching 70% of all intervention-naive households of MDR/RR-TB patients diagnosed during that period. TPT recipients and the broader population are followed to 2040 to estimate longer-term effects. An embedded individual-level analysis 2 years after the start of TPT or placebo simulates outcomes that a clinical trial would measure. We use pairwise scenario comparisons to quantify several components of the intervention's impact on incident TB and MDR/RR-TB:
Short-term impact among TPT recipients (as measured in clinical trials [8]): delamanid versus placebo, observing each recipient for 2 years;
Long-term impact among TPT recipients: delamanid versus placebo, following recipients through 2040;
Long-term impact of TPT population-wide (incorporating the impact of TPT on future TB transmission): delamanid versus placebo, following the full population through 2040;
Long-term impact of TPT and HHCT population-wide (estimating the combined impact of both HHCT and TPT on transmission, reflecting the reality that most household contacts are not currently screened for active TB [33]): delamanid versus no intervention, following the full population through 2040.
For illustrative purposes, we also simulate clinical trial survival analysis by aligning the start times of 2000 TPT or placebo recipients per arm drawn from across simulations. Sensitivity analyses identify the parameters that most affect the projected reduction in cumulative, population-wide MDR/RR-TB incidence produced by HHCT plus delamanid TPT, relative to no household intervention.
RESULTS
The model recapitulated most epidemiological targets in 2019 (Figure 2), with simulated mortality, LTBI prevalence, and household contributions to transmission tending to fall near the upper tails of the distributions suggested by prior data (Supplementary FiguresE4 andE5). In the year 2022 (preintervention), a median of 0.28% (interquartile range [IQR], 0.27%–0.29%) of the modeled population had prevalent active TB (ie, 280 per 100 000), and 24% (IQR, 22%–32%) of incident TB arose from transmission within households (Figure 2). Of all incident TB, 3.2% (IQR, 2.7%–3.6%) was drug-resistant. Without additional intervention, TB incidence was projected to fall by 5.1% (IQR, 3.9%–5.3%) per year between 2022 and 2040 (Supplementary TableE5).
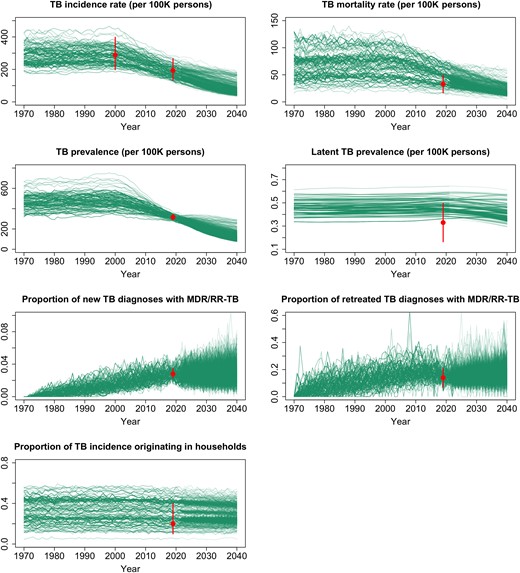
Calibration targets and simulated epidemic trajectories. The curves represent the values for each simulated output listed, among the 1000 best-fitting simulations from 1970 through 2040 and assuming no interventions for multidrug- or rifampin-resistant tuberculosis household contacts (ie, no-intervention scenario). The dots and error bars represent the median and 0.95 quantile range, respectively, of each calibration target (ie, data to which the model was fit). Abbreviations: MDR/RR-TB, multidrug- or rifampin-resistant tuberculosis; TB, tuberculosis.
Within the households of patients diagnosed with TB in 2022, the estimated co-prevalence of active TB was 3.6% (IQR, 3.4%–4.9%), and the prevalence of LTBI was 69% (IQR, 68%–77%). Considering only households where the index case had MDR/RR-TB, 3.9% (IQR, 3.5%–4.8%) had co-prevalent TB, and 74% (IQR, 73%–78%) had LTBI. Of these latently infected MDR/RR-TB contacts, 62% (IQR, 60%–67%) had an MDR/RR-TB infection, most of which were still in the early latent stage with high progression risk (89% [IQR, 86%–90%], in contrast to 27% [IQR, 25%–29%] of DS-TB infections in the same households). The co-prevalent active TB in MDR/RR-TB contact households was even more likely to be MDR/RR-TB (81% [IQR, 71%–98%]).
Simulated Outcomes of an MDR/RR-TB Preventive Treatment Trial
Between 2023 and 2027, in simulated populations of approximately 800 000 people, a median of 169 (IQR, 134–178) people developed incident MDR/RR-TB, and 123 (IQR, 112–127) were diagnosed with MDR/RR-TB. Delivering contact investigation to 70% of these 123 households resulted in screening of a median of 314 (IQR, 255–327) contacts. Among these contacts, 10 (IQR, 8–11) were diagnosed with active TB (80% [IQR, 78%–83%] of which was MDR/RR-TB), and 211 (IQR, 175–225) were identified as eligible for preventive treatment (34 [IQR, 29–36] under age 5 and 176 [IQR, 146–189] older contacts with TB infection) (Supplementary TableE6).
In the “placebo” scenario, the projected 2-year cumulative incidence of DS-TB among TPT-eligible MDR/RR-TB contacts was 0.4% (IQR, 0%–0.8%), and the 2-year cumulative incidence of MDR/RR-TB was 2% (IQR, 1.3%–2.9%) (Table 2). As illustrated for 1 simulated trial in Figure 3, isoniazid TPT reduced the 2-year cumulative incidence of DS-TB to 0% (IQR, 0%–0.04%) among TPT recipients, with negligible impact on MDR/RR-TB incidence, while delamanid TPT additionally reduced the 2-year incidence of MDR/RR-TB to 0.6% (IQR, 0%–1.1%), a 72% (IQR, 45%–100%) reduction. When considering only effects measured by a clinical trial, therefore, the estimated number needed to treat (NNT) with delamanid TPT to prevent 1 TB case relative to placebo was 60 (IQR, 37–130), and the NNT to prevent 1 MDR/RR-TB case was 73 (IQR, 44–176) (Table 2).

Projected tuberculosis (TB) incidence among recipients of TB preventive treatment (TPT) in a simulated trial. For each scenario, 2000 individual TPT recipients per arm (representing 1 realization of a clinical trial) are randomly selected from across all simulations, their TPT start times are aligned, and they are followed until they either develop TB with the specified strain (A, drug-susceptible; B, multidrug- or rifampin-resistant) or are censored due to death, development of active TB with the other resistance profile, or end of follow-up at year 2040. Colored ribbons represent 2-sided 95% uncertainty ranges (R package survfit). Abbreviations: DS-TB, drug-susceptible tuberculosis; MDR/RR-TB, multidrug- or rifampin-resistant tuberculosis.
Simulated Impact of Delamanid Tuberculosis Preventive Treatment for Household Contacts of People Diagnosed With Multidrug-Resistant/Rifampin-Resistant Tuberculosis, From a Clinical Trial Perspective and Increasingly Comprehensive Perspectives
| Perspective | Population Under Considerationa | Comparator Scenario | Median Duration of Follow-up | Cases in Comparator Scenario (per TPT Recipient) | Cases Prevented by Delamanid TPT | % of Cases Prevented Among the Population Under Consideration | NNT to Prevent 1 Case |
|---|---|---|---|---|---|---|---|
| MDR/RR-TB | |||||||
| Clinical trialb | TPT recipients | Placebo | 2 y | 0.02 (0.01–0.03) | 0.01 (0.01–0.02) | 72 (45–100) | 73 (44–176) |
| Extended clinical trialb follow-up | TPT recipients | Placebo | 16 y | 0.04 (0.03–0.05) | 0.02 (0.01–0.03) | 51 (20–72) | 54 (30–183) |
| Including downstream transmission effects | Full population | Placebo | 16 y | 2.2 (1.9–2.4) | 0.04 (−0.01 to 0.09) | 1.6 (−0.6 to 3.8) | 27 (11–no cases avertedc) |
| Including effects of TB screening for contacts | Full population | No household contact screening | 16 y | 2.3 (1.9–2.4) | 0.08 (0.04–0.12) | 3.6 (2–5.2) | 12 (8–22) |
| TB | |||||||
| Clinical trialb | TPT recipients | Placebo | 2 y | 0.02 (0.02–0.04) | 0.02 (0.01–0.03) | 71 (46–88) | 60 (37–130) |
| Extended clinical trialb follow-up | TPT recipients | Placebo | 16 y | 0.06 (0.04–0.08) | 0.03 (0.01–0.04) | 45 (18–64) | 40 (23–124) |
| Including downstream transmission effects | Full population | Placebo | 16 y | 70.2 (67.7–87.6) | 0.05 (−1.4 to 1.6) | 0.08 (−1.8 to 2) | 18 (1–no cases avertedc) |
| Including effects of TB screening for contacts | Full population | No household contact screening | 16 y | 70.4 (67.8–87.2) | 0.13 (−0.15 to 0.39) | 0.19 (−0.19 to 0.52) | 7 (3–no cases avertedc) |
Data are reported as median (interquartile range [IQR]) unless otherwise indicated.
Abbreviations: MDR/RR-TB, multidrug-resistant/rifampin-resistant tuberculosis; NNT, number needed to treat; TB, tuberculosis; TPT, tuberculosis preventive treatment.
aTPT recipients are followed to incident TB or death, while the full population perspective counts all incident TB events including recurrences.
bWhen reporting the results of the clinical trial, all TPT recipients were weighted equally across all simulations, and individuals were sampled randomly from this list to generate a trial of size N (eg, N = 6000 similar to Figure 3). This procedure was replicated n = 500 times; the reported median and IQR values are computed across these randomly simulated trials.
cGiven the small relative impact of a short-term, household-limited intervention on overall TB and MDR/RR-TB incidence in the population, stochastic effects resulted in a negative number of cases averted in >25% of simulations.
Longer-term Measures of Individual and Population Impact
When MDR/RR TPT–eligible contacts were observed through 2040 (median, 16.2 years of follow-up), they experienced a cumulative DS-TB incidence of 1.7% (IQR, 0.9%–2.6%) and cumulative MDR/RR-TB incidence of 3.8% (IQR, 2.6%–5.4%) in the placebo scenario (Table 2; illustrated for 1 simulated trial in Figure 3). The majority of incident TB among these contacts continued to be MDR/RR-TB, although the percentage that was MDR/RR decreased from 86% (IQR, 71%–100%) in the first 2 years to 69% (IQR, 56%–82%) in the remainder of this extended follow-up period, as a declining percentage of their incident TB arose from the initial household MDR/RR-TB exposures.
Over this longer time horizon, recipients of delamanid TPT experienced a 42% (IQR, −13% to 75%) reduction in the cumulative incidence of DS-TB (also experienced by isoniazid recipients) and a 51% (IQR, 20%–72%) reduction in the incidence of MDR/RR-TB, compared to placebo. Thus, among TPT-eligible contacts, the NNT with delamanid to prevent 1 case was 40 (IQR, 23–124) for any TB and 54 (IQR, 30–183) for MDR/RR-TB (Supplementary TableE7).
When also considering potential reductions in population-wide transmission, delivering delamanid TPT to 70% of eligible MDR/RR-TB household contacts from 2023 through 2027 prevented 1.6% (IQR, −0.6% to 3.8%) of all incident MDR/RR-TB in the population between 2023 and 2040, relative to the placebo scenario (Table 2, Figure 4). This incorporation of transmission-related effects decreased the NNT to prevent 1 MDR/RR-TB case to 27 (IQR, 11–no cases averted, due to stochastic effects).
![Projected reductions in multidrug- or rifampin-resistant tuberculosis (MDR/RR-TB) incidence via household contact intervention. The y-axis represents the reduction in MDR/RR-TB incidence relative to the no-intervention baseline in the same year (a tuberculosis [TB] preventive treatment [TPT] recipient–weighted average across simulations, smoothed using locally estimated scatterplot smoothing with a span of 0.5 y). The light blue region shows the effects that could be observed in a placebo-controlled clinical trial with sufficiently long follow-up, and the dark blue shows additional effects of TPT in preventing transmission in the broader population; together, these blue regions represent the difference between the TPT scenario (solid line) and placebo (dotted line). The green region—the difference between the placebo scenario (dotted line) and no household intervention (dashed line)—represents the additional effect of active TB screening in the household contacts of MDR/RR-TB patients. Abbreviations: MDR/RR-TB, multidrug-resistant/rifampin-resistant tuberculosis; TB, tuberculosis; TPT, tuberculosis preventive treatment.](https://oup.silverchair-cdn.com/oup/backfile/Content_public/Journal/cid/78/1/10.1093_cid_ciad557/3/m_ciad557f4.jpeg?Expires=1750293757&Signature=mtcLQ5UMkVVffAV2iDQ~qQO4oQb-e1S1gxrxtb2yxxV7tVyg~Wa1zybXLwGSVcZEwZVkg1MThsxlhVinNlhN6-IAdi5F47p0gcU3mEpryXlduZod8hff3DSkSq6SajOK6ZUMCZi~hmaLMcEOMDAcjXhql~o~3Uid1qskxV3jLiMsHJgee2b4JtOG09h2AmbJSQniKZOH4sFcPh~NWwlZoAGjGcW7vi7ilGF8jpoTB4sXhr9oDa9Y6W8TG2Sm6VhjplwCI79jzm1ddwW13NSRFQ82lca75r0Oq-vOEKUHr4XSPHUmqdu8foV8ORai-y9O8Kl1iLDeS50I0gYlF5EoOA__&Key-Pair-Id=APKAIE5G5CRDK6RD3PGA)
Projected reductions in multidrug- or rifampin-resistant tuberculosis (MDR/RR-TB) incidence via household contact intervention. The y-axis represents the reduction in MDR/RR-TB incidence relative to the no-intervention baseline in the same year (a tuberculosis [TB] preventive treatment [TPT] recipient–weighted average across simulations, smoothed using locally estimated scatterplot smoothing with a span of 0.5 y). The light blue region shows the effects that could be observed in a placebo-controlled clinical trial with sufficiently long follow-up, and the dark blue shows additional effects of TPT in preventing transmission in the broader population; together, these blue regions represent the difference between the TPT scenario (solid line) and placebo (dotted line). The green region—the difference between the placebo scenario (dotted line) and no household intervention (dashed line)—represents the additional effect of active TB screening in the household contacts of MDR/RR-TB patients. Abbreviations: MDR/RR-TB, multidrug-resistant/rifampin-resistant tuberculosis; TB, tuberculosis; TPT, tuberculosis preventive treatment.
Finally, when compared to a scenario of no household intervention (rather than screening for active TB without providing TPT, as in the placebo scenario), the combination of TB screening and delamanid TPT for MDR/RR-TB household contacts from 2023 through 2027 prevented 3.6% (IQR, 2%–5.2%) of all incident MDR/RR-TB in the population from 2023 to 2040 (Figure 4), with a corresponding NNT of 12 (IQR, 8–22) to prevent 1 MDR/RR-TB case (Table 2, Supplementary TablesE8 andE9).
Sensitivity Analysis
The epidemiologic parameters most strongly correlated with the primary outcome (comparing delamanid to no intervention) included the household TB transmission risk, the reduction in reinfection risk if latently infected, the TB mortality rate, the infectiousness of MDR/RR-TB relative to DS-TB, and the primary progression rate. Of these parameters, household transmission was the most influential and the only one associated with a ≥20% variation in the outcome. Among intervention-related parameters, TB incidence among recipients was most sensitive to the efficacy of TPT against preexisting latent infections and the sensitivity of screening for active TB; population-level effects were most sensitive to intervention coverage and LTBI screening sensitivity (Supplementary FiguresE6–E9). Additional analysis suggests that focusing TPT among younger ages would reduce the NNT but limit the population-level impact of the intervention on TB incidence (Supplementary TableE10).
DISCUSSION
This agent-based, household-structured model of MDR/RR-TB transmission illustrates that the observed effect of MDR/RR-TB household contact tracing and TPT in a clinical trial may substantially underestimate the long-term, population-wide impact of such an intervention. Specifically, we estimate that household contact investigation to screen for active TB and provide TPT with 70% efficacy against both DS- and MDR/RR-TB infection could prevent 1 case of TB for every 12 (IQR, 8–22) TPT recipients over a median of 16 years of follow-up. Less than 20% of this impact would be directly observable among TPT recipients themselves within 2 years of treatment. The remainder of this impact, which a typical clinical trial would not directly measure, reflects the preventive effects among recipients over the longer term, the downstream effects of preventing MDR/RR-TB transmission from those recipients to the broader population, and the benefits of identifying and treating active MDR/RR-TB among contacts during implementation of HHCT.
Of these multiple contributions to the impact of MDR/RR-TB HHCT and TPT, the largest contributor (accounting for 56% of the total estimated effect) was screening and treating contacts for active disease. In other words, much of the potential impact of MDR-TPT reflects the fact that having an effective TPT regimen (and newer effective regimens for MDR/RR-TB treatment) might facilitate broader scale-up of contact investigation in the first place. We note that contact investigation to identify and treat active TB in the contacts of MDR/RR-TB patients is a strongly recommended intervention that need not wait for uptake of MDR/RR TPT, yet it remains underutilized. Furthermore, even in settings where TB screening for MDR/RR-TB contacts is already widely implemented, the incremental benefit of adding TPT for this population could be both substantial (1 MDR/RR-TB case prevented per 27 TPT recipients) and considerably underestimated (by more than a factor of 2) in clinical trials.
Despite its large benefit on a per-recipient basis, contact investigation with preventive treatment for MDR/RR-TB is expected to have a relatively small impact on population-level incidence of MDR/RR-TB. This limited impact largely reflects the relatively small percentage of TB transmission that occurs within households [34], together with gaps in the care cascade (eg, imperfect sensitivity of LTBI tests, imperfect uptake and efficacy of TPT), the short 5-year duration of the modeled intervention, and the large proportion of secondary household cases that already have active TB at the time of contact investigation [2, 12]. Nevertheless, for each household contact who receives MDR/RR-TPT, the expected clinical benefits—for the recipient and their future contacts—are substantial.
Among models of TB transmission, ours is distinctive in its representation of individual agents and dynamic household structures, together with co-circulation of DS-TB and MDR/RR-TB strains. These details increase model complexity but are essential to accurately simulate household contacts’ time-varying risks of incident DS-TB and MDR/RR-TB and the resulting effects of household-directed TB prevention. Our model accurately replicates observational data from household contact studies that were not used for calibration. For example, the simulated co-prevalence of active disease at the time of contact investigation (3.6% [IQR, 3.4%–4.9%], 90% of which was detected), is consistent with the 2.87% to 3.29% co-prevalence estimates in systematic reviews [12, 35, 36]; similarly, the prevalence of TB infection among MDR/RR-TB contacts (74% [IQR, 73%–78%]) is consistent with the 72% prevalence observed a multicountry feasibility study for the PHOENIx trial [2], and the simulated strain concordance of co-prevalent TB cases found during MDR/RR-TB contact investigation (81% [IQR, 70%–98%]) and among MDR/RR-TB contacts developing incident TB in the subsequent 2 years (80% [IQR, 78%–83%]) is consistent with the 82.6% (72.3%–90.9%) isoniazid and rifampin concordance estimated among secondary cases in drug-resistant TB patient households in a systematic review [37]. Compared to related modeling analyses, our estimate that delamanid TPT prevents approximately 51% of incident MDR/RR-TB among all TPT recipients is consistent with a previously published estimate of approximately 55% incidence reduction among pediatric contacts [38]. At a population level, our median estimated NNT of 18 MDR/RR-TB contacts receiving preventive treatment to prevent 1 TB case is comparable to the estimated NNT with conventional preventive treatment for DS-TB among people with HIV in South Africa (NNT = 18) [39] and lower than a comparable estimate (NNT = 64) for household contacts of patients with DS-TB in Southeast Asia [40].
This analysis has important limitations. We did not explicitly model HIV, making it difficult to generalize our results to high-HIV-burden settings or HIV-focused TPT strategies. Our results may not generalize to settings with a very high MDR/RR-TB prevalence, due to more diffuse MDR/RR-TB exposure risks and different drug susceptibility testing practices. We considered only DS-TB and MDR/RR-TB strains; as such, we do not represent any effects of isoniazid monoresistance during MDR/RR-TB emergence, nor any potential effects of TPT on MDR/RR-TB susceptibility profiles over time. In extrapolating our model to forthcoming results from fluoroquinolone TPT trials, applicability will be greatest in populations with a low prevalence of fluoroquinolone-resistance among MDR/RR-TB. Our household-structured simulation does not capture all risks that members of the same household may share, such as common nonhousehold contacts or predisposing factors such as malnutrition. Our Bayesian calibration approach captures parameter uncertainty that is often omitted from agent-based simulations, but it assumes a single set of parameter values within each simulation and does not capture interindividual heterogeneity or dynamic changes in parameter values over time (eg, our model's high estimate of the prevalence of latent infection may be explained partly by our model's simplifying assumption that all individuals are equally susceptible to infection [41]). With regard to coronavirus disease 2019 (COVID-19), we assumed continuation of prepandemic trends into the future; accounting for COVID-19's effects—including index case treatment delays and more time spent at home during the pandemic [42]—might increase the MDR/RR-TB risk among contacts and thus the benefits of these interventions.
In summary, this model-based analysis suggests that, if forthcoming trial results indicate 70% efficacy of delamanid or fluoroquinolone TPT in preventing MDR/RR-TB among contacts, then implementing a package of MDR/RR-TB household contact investigation and TPT could avert 1 case of MDR/RR-TB for every 12 TPT recipients. Less than 20% of this impact would be directly observed in a clinical trial comparing MDR/RR-TPT to isoniazid or placebo with 2-year follow-up. Much of the impact would be attributable to prevented transmission, both as a direct result of TPT and through scaled-up household contact investigation leading to earlier MDR/RR-TB case detection. Guidelines and programmatic decisions regarding implementation and scale-up of MDR/RR-TPT should take these expanded benefits into consideration.
Supplementary Data
Supplementary materials are available at Clinical Infectious Diseases online. Consisting of data provided by the authors to benefit the reader, the posted materials are not copyedited and are the sole responsibility of the authors, so questions or comments should be addressed to the corresponding author.
Notes
Author Contributions. P. K. and E. A. K. contributed to conceptualization, methodology, supervision, and writing. P. K. and J. P. contributed to data curation, formal analysis, and software. All authors contributed to writing, review, and editing.
Data availability. The simulation model is available at https://github.com/TB-Modeling/MDRTB-TPT-India and is released under the GPL 2.0 Public License.
Disclaimer. The content is solely the responsibility of the authors and does not necessarily represent the official views of the National Institutes of Health (NIH) or other funders.
Financial support. This work was supported by career development awards from the National Institute of Allergy and Infectious Diseases (NIAID) (K01AI138853 to P. K. and K08AI127908 to E. A. K.), and by Johns Hopkins Catalyst Awards to D. W. D. and E. A. K.
References
Author notes
Potential conflicts of interest. D. W. D. reports institutional grants or contracts unrelated to this project from the NIH, Centers for Disease Control and Prevention, GiveWell.org, the US Agency for International Development, and the Foundation for Innovative New Diagnostics. E. A. K. reports a Catalyst Award for agent-based modeling of drug-resistant tuberculosis from Johns Hopkins University. A. G. reports payment or honoraria from Washington University for St Louis lectureship and from the Asia Pacific Congress of Clinical Microbiology and Infection plenary, and unpaid roles from the IndoUS Governing Board and the NIAID Council. All other authors report no potential conflicts.
All authors have submitted the ICMJE Form for Disclosure of Potential Conflicts of Interest. Conflicts that the editors consider relevant to the content of the manuscript have been disclosed.

