


Abstract
Coronavirus disease 2019 (COVID-19) vaccination coverage remains lower in communities with higher social vulnerability. Factors such as severe acute respiratory syndrome coronavirus 2 (SARS-CoV-2) exposure risk and access to healthcare are often correlated with social vulnerability and may therefore contribute to a relationship between vulnerability and observed vaccine effectiveness (VE). Understanding whether these factors impact VE could contribute to our understanding of real-world VE.
We used electronic health record data from 7 health systems to assess vaccination coverage among patients with medically attended COVID-19-like illness. We then used a test-negative design to assess VE for 2- and 3-dose messenger RNA (mRNA) adult (≥18 years) vaccine recipients across Social Vulnerability Index (SVI) quartiles. SVI rankings were determined by geocoding patient addresses to census tracts; rankings were grouped into quartiles for analysis.
In July 2021, primary series vaccination coverage was higher in the least vulnerable quartile than in the most vulnerable quartile (56% vs 36%, respectively). In February 2022, booster dose coverage among persons who had completed a primary series was higher in the least vulnerable quartile than in the most vulnerable quartile (43% vs 30%). VE among 2-dose and 3-dose recipients during the Delta and Omicron BA.1 periods of predominance was similar across SVI quartiles.
COVID-19 vaccination coverage varied substantially by SVI. Differences in VE estimates by SVI were minimal across groups after adjusting for baseline patient factors. However, lower vaccination coverage among more socially vulnerable groups means that the burden of illness is still disproportionately borne by the most socially vulnerable populations.
(See the Editorial Commentary by Titanji on pages 1626–7.)
The coronavirus disease 2019 (COVID-19) pandemic has led to over 1 million deaths and millions more medical visits and hospitalizations in the United States through August 2022 [1]. This burden has disproportionately affected socially vulnerable populations, and social and structural factors may differentially impact engagement in protective measures, risk of exposure, susceptibility to infection, and risk of adverse health outcomes [2]. Since first authorized in December 2020, COVID-19 vaccines have been a critical public health tool for protection against COVID-19, yet lower coverage within vulnerable populations may result in increased disease incidence [3, 4], and it remains unclear whether we might also expect a relationship between social vulnerability and COVID-19 vaccine effectiveness (VE) estimates.
Previous studies have used the US Centers for Disease Control and Prevention (CDC) and Agency for Toxic Substances and Disease Registry (ATSDR) Social Vulnerability Index (SVI) to characterize COVID-19 disparities [3, 5–8]. SVI captures 15 attributes of social vulnerability across four themes: socioeconomic status, household composition and disability, minority status and language, and housing type and transportation [9]. These elements may be associated with vaccination coverage and may impact VE via mechanisms including: (1) Intensity and duration of severe acute respiratory syndrome coronavirus 2 (SARS-CoV-2) exposure (eg, crowding, reliance on public transportation, occupational requirements); (2) Susceptibility to infection (eg, biological factors such as immune system response) [10, 11]; and (3) Access to healthcare or likelihood of seeking healthcare or testing in a hospital, emergency department, or urgent care clinic versus other settings (eg, insurance status, access to telemedicine and at-home testing). Although age, underlying medical conditions, and geographic region are identified in COVID-19 VE analyses as potential confounders [12–15], additional social and structural factors not routinely captured may also confound or modify the association. Understanding whether these factors impact VE could contribute to our understanding of how VE may vary, particularly in higher-risk communities.
The VISION Network is a multistate collaboration between CDC and health systems with integrated clinical, testing, and immunization records that assesses VE against laboratory-confirmed COVID-19-associated emergency department and urgent care (ED/UC events) and hospitalizations. In this analysis, we assessed vaccination coverage through July 2022 and estimated VE in 2- and 3-dose adult messenger RNA (mRNA) vaccine recipients. Our primary goals were to describe vaccination coverage across SVI quartiles among patients accessing medical services and to determine whether SVI influenced COVID-19 VE estimates in these settings.
METHODS
Setting and Participants
VISION is a research network that evaluates COVID-19 VE across diverse populations and geographic areas using a test-negative case-control study design, comparing the odds of antecedent vaccination between laboratory-confirmed COVID-19 case-patients and test-negative control-patients presenting with COVID-19-like illness (CLI) in ED/UC or hospital settings [13, 16, 17]. Seven partners with facilities in Colorado, Indiana, Minnesota, Oregon, Texas, Utah, Wisconsin, and Washington submitted data for this analysis.
For both vaccination coverage and VE analyses, eligible encounters occurred among adults aged ≥18 years with ≥1 CLI discharge code. CLI criteria were defined as a clinical diagnosis of acute respiratory illness (eg, pneumonia) or associated signs or symptoms (eg, cough, fever). Eligible hospital admissions required a length of stay ≥24 hours. Repeat encounters, defined as >1 ED/UC visit within 24 hours or hospital readmission within 30 days, were analyzed as a single encounter. SARS-CoV-2 infection status was determined by molecular testing performed within 14 days before or up to 72 hours after an encounter. The vaccination coverage analysis included ED/UC events or hospitalizations occurring between 1 January 2021 (2 weeks following the recommendation of the first available COVID-19 vaccine) [18] and 26 June to 8 July 2022 (varying by site), encompassing periods of the Delta and Omicron BA.1, BA.2/BA.2.12.1, and BA.4/BA.5 variant circulation.
Analysis of VE across SVI groups during specified time periods was limited to the Delta and early Omicron (BA.1) periods and was restricted to presumed immunocompetent patients with an event between 30 September 2021 (7 days after CDC recommended a first booster dose for some adults) and March 16–29, 2022 (when the SARS-CoV-2 BA.1 variant no longer accounted for ≥50% of cases at individual sites).
Vaccination Status
Vaccination status was determined from state and local immunization registries and electronic health records as of the encounter index date, defined as the earliest of either the date of molecular SARS-CoV-2 testing or the date of admission. For the vaccination coverage analysis, we considered Pfizer-BioNTech and Moderna (mRNA) and Johnson & Johnson/Janssen (J&J) vaccines. Patients who had received no vaccine doses by the index date were considered unvaccinated. We identified the date of first vaccination (any mRNA or J&J dose) and the date of primary series completion (second mRNA dose or first J&J dose). Date of booster dose was defined as the date of the third mRNA dose among those who received 2 mRNA doses as their primary series or the date of the second vaccine (either mRNA or J&J) among those who received J&J as their primary series. For the VE analysis, we considered mRNA vaccination and estimated VE for 2-dose (primary series) and 3-dose (primary series plus booster dose) recipients. Patients who received 2 doses were further divided into those who received the second dose 14–149 days or ≥150 days prior to the index date. Encounters were excluded from the VE analysis if the patient received only 1 dose, a second mRNA dose 1–13 days before the index date, a third dose 1–6 days before the index date, or ≥4 vaccine doses.
Social Vulnerability
Social vulnerability was measured using 2018 SVI data [9]. US census tracts are ranked across 15 SVI measures, generating percentiles ranging from 0 (least vulnerable) to 1 (most vulnerable). Each tract is ranked overall and for each of 4 SVI themes. Patient addresses from eligible encounters were geocoded to census tracts using various mapping tools (Supplementary Table 1), with corresponding SVI rankings reported to the nearest 5th percentile. Overall and thematic SVI rankings were grouped into quartiles. Encounters missing geocoded data to determine SVI were excluded.
Statistical Analysis
Vaccination coverage was assessed by plotting SVI quartiles over time, including eligible CLI-associated ED/UC and hospital encounters through 8 July 2022. Vaccination status among patients with multiple encounters was determined using data from the latest encounter. Coverage was reported for each SVI quartile as the proportion receiving the specified vaccine regimen (ie, primary series or booster) divided by the number of persons with ≥1 eligible encounter.
VE against a laboratory-confirmed COVID-19 ED/UC visit or hospitalization was estimated using a test-negative design (TND), which has been widely used in COVID-19 VE studies [13, 19–23]. The TND reduces confounding that may otherwise occur due to misclassification or differences in healthcare-seeking behavior between cases and controls [24]. VE was assessed by comparing the odds of being vaccinated between those with positive and negative SARS-CoV-2 test results. Weighted multivariable logistic regression was performed, adjusting for age, site-specific geographical cluster, calendar time, and local SARS-CoV-2 circulation using a 7-day moving average of percent positivity of reverse-transcription polymerase chain reaction (RT-PCR) SARS-CoV-2 tests. Covariates with a standardized mean difference (SMD) of ≥0.20 after weighting by the propensity score were included in VE models to minimize residual confounding. Weights were calculated for each model as the patients’ inverse-propensity-to-be-vaccinated, with generalized boosted regression trees estimating propensity based on facility characteristics, demographics, and underlying medical conditions truncated at the 99th percentile. Results were stratified by receipt of 2 doses 14–149 days prior to the index date, 2 doses ≥150 days prior, and 3 doses, compared to an unvaccinated reference group (Supplemental Methods).
VE estimates were stratified by variant period (Delta and Omicron BA.1) and age (18–49, 50–64, ≥65 years) for the overall SVI score, and by variant period for each of the 4 SVI themes (Supplemental Methods). To directly compare VE across SVI quartiles, an interaction between SVI quartile and vaccination dose was included in the regression models. Models with and without the interaction term were compared using a likelihood ratio test; a significant P value (P < .05) suggested that a difference in VE existed across SVI quartiles. Analyses were performed using SAS version 9.4 and R version 4.1.2. This study was reviewed and approved by the institutional review boards (IRB) at participating sites or under a reliance agreement with Westat, Inc.
RESULTS
Participants in Vaccination Coverage Analysis
From 1 January 2021, through 8 July 2022, 605 220 adult CLI-associated ED/UC encounters and 216 667 adult hospitalizations were identified. Of those, 133 784 (22%) ED/UC encounters and 57 671 (27%) hospitalization encounters were excluded due to missing SVI information or inability to geocode the patient address (Tables 1 and 2). Demographic characteristics were largely similar between patients with and without SVI information. A larger proportion of encounters missing SVI was observed among patients with unknown race/ethnicity and unknown urban-rural classification. A total of 593 668 unique eligible patients were included in the analysis of vaccination coverage, including 257 119 (43%) unvaccinated patients, 209 217 (35%) patients who completed a primary series only, and 91 360 (15%) who completed a primary series and received a booster dose. Characteristics of encounters by SVI quartile are listed in Table 1 for ED/UC encounters and Table 2 for hospitalizations.
Characteristics of Emergency Department and Urgent Care Encounters Among Adults With COVID-19–Like Illness by Social Vulnerability Index (SVI) Quartile, 1 January 2021 to 8 July 2022
| SVI Quartile | |||||||
|---|---|---|---|---|---|---|---|
| Characteristic | Overall (Col %) | SMDa | SVI Q1 (Row %) | SVI Q2 (Row %) | SVI Q3 (Row %) | SVI Q4 (Row %) | Unable to Geocode or Missingb (Row %) |
| Total | 605 220 | … | 169 392 | 123 142 | 96 313 | 82 589 | 133 784 |
| Subvariant predominance era | |||||||
| ȃPre-Delta | 59 737 (10.0) | 0.066 | 15 842 (26.5) | 13 109 (21.9) | 9335 (15.6) | 7880 (13.2) | 13 571 (22.7) |
| ȃDelta | 271 795 (45.4) | … | 78 031 (28.7) | 55 280 (20.3) | 42 539 (15.7) | 34 495 (12.7) | 61 450 (22.6) |
| ȃBA.1 | 155 860 (26.0) | … | 41 235 (26.5) | 31 359 (20.1) | 25 862 (16.6) | 24 000 (15.4) | 33 404 (21.4) |
| ȃBA.2c | 111 263 (18.6) | … | 32 008 (28.8) | 22 089 (19.9) | 17 608 (15.8) | 15 441 (13.9) | 24 117 (21.7) |
| Site | |||||||
| ȃBSWHd | 104 474 (17.3) | 0.741 | 22 149 (21.2) | 19 907 (19.1) | 21 255 (20.3) | 26 948 (25.8) | 14 215 (13.6) |
| ȃHPe | 110 670 (18.3) | … | 53 327 (48.2) | 25 666 (23.2) | 13 693 (12.4) | 14 610 (13.2) | 3374 (3.0) |
| ȃIHf | 164 061 (27.1) | … | 57 513 (35.1) | 36 323 (22.1) | 27 994 (17.1) | 12 233 (7.5) | 29 998 (18.3) |
| ȃKPNWg | 61 437 (10.2) | … | 10 518 (17.1) | 15 222 (24.8) | 12 254 (19.9) | 8722 (14.2) | 14 721 (24.0) |
| ȃPHIXh | 9740 (1.6) | … | 276 (2.8) | 741 (7.6) | 1061 (10.9) | 2601 (26.7) | 5061 (52.0) |
| ȃRGNi | 104 707 (17.3) | … | 16 148 (15.4) | 20 763 (19.8) | 17 929 (17.1) | 15 452 (14.8) | 34 415 (32.9) |
| ȃUCOj | 50 131 (8.3) | … | 9461 (18.9) | 4520 (9.0) | 2127 (4.2) | 2023 (4.0) | 32 000 (63.8) |
| Age group | |||||||
| ȃ18–49 y | 314 953 (52.0) | 0.102 | 83 092 (26.4) | 62 192 (19.7) | 49 439 (15.7) | 44 352 (14.1) | 75 878 (24.1) |
| ȃ50–64 y | 124 176 (20.5) | … | 34 682 (27.9) | 24 919 (20.1) | 20 418 (16.4) | 18 509 (14.9) | 25 648 (20.7) |
| ȃ≥65 y | 166 085 (27.4) | … | 51 617 (31.1) | 36 031 (21.7) | 26 454 (15.9) | 19 728 (11.9) | 32 255 (19.4) |
| Sex | |||||||
| ȃMale | 244 463 (40.4) | 0.021 | 69 566 (28.5) | 49 783 (20.4) | 38 378 (15.7) | 32 458 (13.3) | 54 278 (22.2) |
| ȃFemale | 360 757 (59.6) | … | 99 826 (27.7) | 73 359 (20.3) | 57 935 (16.1) | 50 131 (13.9) | 79 506 (22.0) |
| Race/Ethnicity | |||||||
| ȃNon-Hispanic White | 411 302 (68.0) | 0.505 | 137 529 (33.4) | 91 462 (22.2) | 62 318 (15.2) | 38 248 (9.3) | 81 745 (19.9) |
| ȃNon-Hispanic Black | 59 521 (9.8) | … | 8561 (14.4) | 9938 (16.7) | 11 148 (18.7) | 20 376 (34.2) | 9498 (16.0) |
| ȃHispanic | 66 945 (11.1) | … | 10 560 (15.8) | 12 041 (18.0) | 14 560 (21.7) | 16 866 (25.2) | 12 918 (19.3) |
| ȃNon-Hispanic Other | 36 713 (6.1) | … | 9793 (26.7) | 6973 (19.0) | 5726 (15.6) | 5122 (14.0) | 9099 (24.8) |
| ȃUnknown | 30 739 (5.1) | … | 2949 (9.6) | 2728 (8.9) | 2561 (8.3) | 1977 (6.4) | 20 524 (66.8) |
| Medicaid insurance | |||||||
| ȃNo | 471 396 (77.9) | 0.326 | 146 169 (31.0) | 96 818 (20.5) | 71 129 (15.1) | 53 261 (11.3) | 104 019 (22.1) |
| ȃYes | 123 383 (20.4) | … | 22 019 (17.8) | 24 577 (19.9) | 23 541 (19.1) | 28 072 (22.8) | 25 174 (20.4) |
| ȃMissing/Unknown | 10 441 (1.7) | … | 1204 (11.5) | 1747 (16.7) | 1643 (15.7) | 1256 (12.0) | 4591 (44.0) |
| Urban-rural classification of facility | |||||||
| ȃLarge central metro | 215 203 (35.6) | 0.377 | 72 208 (33.6) | 43 005 (20.0) | 36 814 (17.1) | 40 840 (19.0) | 22 336 (10.4) |
| ȃLarge fringe metro | 126 890 (21.0) | … | 37 784 (29.8) | 26 669 (21.0) | 17 722 (14.0) | 10 700 (8.4) | 34 015 (26.8) |
| ȃMedium metro | 130 405 (21.5) | … | 33 769 (25.9) | 24 778 (19.0) | 18 115 (13.9) | 14 450 (11.1) | 39 293 (30.1) |
| ȃSmall metro | 49 407 (8.2) | … | 10 623 (21.5) | 9854 (19.9) | 11 563 (23.4) | 7204 (14.6) | 10 163 (20.6) |
| ȃMicropolitan | 27 404 (4.5) | … | 6935 (25.3) | 8196 (29.9) | 4071 (14.9) | 2481 (9.1) | 5721 (20.9) |
| ȃNon-core | 15 867 (2.6) | … | 2044 (12.9) | 4598 (29.0) | 3436 (21.7) | 1943 (12.2) | 3846 (24.2) |
| ȃUnknown | 40 044 (6.6) | … | 6029 (15.1) | 6042 (15.1) | 4592 (11.5) | 4971 (12.4) | 18 410 (46.0) |
| Underlying respiratory condition at discharge | |||||||
| ȃNo | 493 424 (81.5) | 0.113 | 142 921 (29.0) | 99 690 (20.2) | 75 580 (15.3) | 63 858 (12.9) | 111 375 (22.6) |
| ȃYes | 111 796 (18.5) | … | 26 471 (23.7) | 23 452 (21.0) | 20 733 (18.5) | 18 731 (16.8) | 22 409 (20.0) |
| Underlying nonrespiratory condition at discharge | |||||||
| ȃNo | 426 794 (70.5) | 0.142 | 126 364 (29.6) | 85 221 (20.0) | 62 724 (14.7) | 52 585 (12.3) | 99 900 (23.4) |
| ȃYes | 178 426 (29.5) | … | 43 028 (24.1) | 37 921 (21.3) | 33 589 (18.8) | 30 004 (16.8) | 33 884 (19.0) |
| Any likely immunocompromised status | |||||||
| ȃNo | 574 942 (95.0) | 0.046 | 161 577 (28.1) | 116 659 (20.3) | 90 558 (15.8) | 77 661 (13.5) | 128 487 (22.3) |
| ȃYes | 30 278 (5.0) | … | 7815 (25.8) | 6483 (21.4) | 5755 (19.0) | 4928 (16.3) | 5297 (17.5) |
| Immunization status and days since last dose | |||||||
| ȃUnvaccinated (referent) | 254 731 (42.1) | 0.299 | 55 083 (21.6) | 50 008 (19.6) | 42 764 (16.8) | 41 386 (16.2) | 65 490 (25.7) |
| ȃ2-dose mRNA <150 d since last dose | 70 419 (11.6) | … | 21 968 (31.2) | 15 161 (21.5) | 10 792 (15.3) | 8392 (11.9) | 14 106 (20.0) |
| ȃ2-dose mRNA ≥150 d since last dose | 129 612 (21.4) | … | 41 057 (31.7) | 26 499 (20.4) | 19 947 (15.4) | 15 765 (12.2) | 26 344 (20.3) |
| ȃ3-dose mRNA <120 d since last dose | 51 283 (8.5) | … | 18 669 (36.4) | 10 816 (21.1) | 7517 (14.7) | 5078 (9.9) | 9203 (17.9) |
| ȃ3-dose mRNA ≥120 d since last dose | 35 190 (5.8) | … | 13 587 (38.6) | 7343 (20.9) | 4840 (13.8) | 3365 (9.6) | 6055 (17.2) |
| ȃOther Immunization combination | 63 985 (10.6) | … | 19 028 (29.7) | 13 315 (20.8) | 10 453 (16.3) | 8603 (13.4) | 12 586 (19.7) |
| SARS-CoV-2 test result | |||||||
| ȃPositive | 107 993 (17.8) | 0.06 | 27 497 (25.5) | 21 304 (19.7) | 17 526 (16.2) | 15 920 (14.7) | 25 746 (23.8) |
| ȃNegative | 497 227 (82.2) | … | 141 895 (28.5) | 101 838 (20.5) | 78 787 (15.8) | 66 669 (13.4) | 108 038 (21.7) |
| Known historical positive SARS-CoV-2 test result | |||||||
| ȃYes | 64 256 (10.6) | 0.069 | 15 624 (24.3) | 13 369 (20.8) | 11 315 (17.6) | 10 507 (16.4) | 13 441 (20.9) |
| ȃNo | 540 964 (89.4) | … | 153 768 (28.4) | 109 773 (20.3) | 84 998 (15.7) | 72 082 (13.3) | 120 343 (22.2) |
Abbreviations: COVID-19, coronavirus disease 2019; mRNA, messenger RNA; SARS-Cov-2, severe acute respiratory syndrome coronavirus 2; SMD, standardized mean difference.
An absolute SMD ≥0.20 indicates a nonnegligible difference in variable distributions between emergency department and urgent care visits for different Social Vulnerability Index Groups. A single SMD was calculated by averaging the absolute SMDs obtained from pairwise comparisons of each SVI quartile category, excluding encounters without SVI due to missing geocoded data.
Unable to geocode or missing includes any patient encounters where the address was not provided or could not be geocoded.
Data from the BA.2 era (defined as the day after the BA.1 predominance period ended at each site (16–29 March 2022) through the last date of data collection at each site (26 June to 8 July 2022) was used for vaccination coverage only and was not included in VE analyses.
Baylor Scott & White Health (Texas).
HealthPartners (Minnesota and Wisconsin).
Intermountain Healthcare (Utah).
Kaiser Permanente Northwest (Oregon and Washington).
Paso Del Norte Health Information Exchange (Texas).
Regenstrief Institute (Indiana).
University of Colorado (Colorado).
Characteristics of Hospitalizations Among Adults With COVID-19–Like Illness by Social Vulnerability Index (SVI) Quartile, 1 January 2021 to 8 July 2022
| SVI Quartile | |||||||
|---|---|---|---|---|---|---|---|
| Characteristic | Overall (Col %) | SMDa | SVI Q1 (Row %) | SVI Q2 (Row %) | SVI Q3 (Row %) | SVI Q4 (Row %) | Unable to Geocode or Missingb (Row %) |
| Total | 216 667 | … | 48 690 | 42 129 | 35 593 | 32 584 | 57 671 |
| Subvariant predominance era | |||||||
| ȃPre-Delta | 39 097 (18.1) | 0.062 | 8603 (22.0) | 7700 (19.7) | 5930 (15.2) | 5159 (13.2) | 11 705 (29.9) |
| ȃDelta | 92 619 (42.9) | … | 20 320 (21.9) | 17 773 (19.2) | 15 075 (16.3) | 13 743 (14.8) | 25 708 (27.8) |
| ȃBA.1 | 50 767 (23.5) | … | 11 394 (22.4) | 9955 (19.6) | 8642 (17.0) | 8282 (16.3) | 12 494 (24.6) |
| ȃBA.2c | 33 408 (15.5) | … | 8101 (24.2) | 6526 (19.5) | 5843 (17.5) | 5295 (15.8) | 7643 (22.9) |
| Site | |||||||
| ȃBSWHd | 43 055 (19.9) | 0.547 | 9654 (22.4) | 8389 (19.5) | 8914 (20.7) | 10 680 (24.8) | 5418 (12.6) |
| ȃHPe | 17 751 (8.2) | … | 7971 (44.9) | 4270 (24.1) | 2308 (13.0) | 2640 (14.9) | 562 (3.2) |
| ȃIHf | 24 203 (11.2) | … | 7525 (31.1) | 5412 (22.4) | 4738 (19.6) | 2058 (8.5) | 4470 (18.5) |
| ȃKPNWg | 15 457 (7.1) | … | 2817 (18.2) | 3991 (25.8) | 3034 (19.6) | 2019 (13.1) | 3596 (23.3) |
| ȃPHIXh | 1364 (0.6) | … | 16 (1.2) | 69 (5.1) | 113 (8.3) | 592 (43.4) | 574 (42.1) |
| ȃRGNi | 82 301 (38.0) | … | 15 422 (18.7) | 16 900 (20.5) | 14 624 (17.8) | 12 636 (15.4) | 22 719 (27.6) |
| ȃUCOj | 32 536 (15.0) | … | 5285 (16.2) | 3098 (9.5) | 1862 (5.7) | 1959 (6.0) | 20 332 (62.5) |
| Age group | |||||||
| ȃ18–49 y | 42 130 (19.4) | 0.185 | 8057 (19.1) | 7507 (17.8) | 7266 (17.2) | 7770 (18.4) | 11 530 (27.4) |
| ȃ50–64 y | 52 772 (24.4) | … | 10 092 (19.1) | 9859 (18.7) | 9330 (17.7) | 9639 (18.3) | 13 852 (26.2) |
| ȃ≥65 y | 121 765 (56.2) | … | 30 541 (25.1) | 24 763 (20.3) | 18 997 (15.6) | 15 175 (12.5) | 32 289 (26.5) |
| Sex | |||||||
| ȃMale | 103 584 (47.8) | 0.038 | 23 863 (23.0) | 19 952 (19.3) | 16 564 (16.0) | 14 889 (14.4) | 28 316 (27.3) |
| ȃFemale | 113 083 (52.2) | … | 24 827 (22.0) | 22 177 (19.6) | 19 029 (16.8) | 17 695 (15.6) | 29 355 (26.0) |
| Race/Ethnicity | |||||||
| ȃNon-Hispanic White | 154 725 (71.4) | 0.483 | 41 473 (26.8) | 34 024 (22.0) | 25 060 (16.2) | 16 620 (10.7) | 37 548 (24.3) |
| ȃNon-Hispanic Black | 23 201 (10.7) | … | 2095 (9.0) | 2864 (12.3) | 4399 (19.0) | 8633 (37.2) | 5210 (22.5) |
| ȃHispanic | 13 224 (6.1) | … | 1645 (12.4) | 2129 (16.1) | 3043 (23.0) | 4142 (31.3) | 2265 (17.1) |
| ȃNon-Hispanic Other | 10 576 (4.9) | … | 2037 (19.3) | 1621 (15.3) | 1551 (14.7) | 1661 (15.7) | 3706 (35.0) |
| ȃUnknown | 14 941 (6.9) | … | 1440 (9.6) | 1491 (10.0) | 1540 (10.3) | 1528 (10.2) | 8942 (59.8) |
| Medicaid insurance | |||||||
| ȃNo | 173 313 (80.0) | 0.296 | 43 048 (24.8) | 35 111 (20.3) | 28 084 (16.2) | 23 012 (13.3) | 44 058 (25.4) |
| ȃYes | 40 076 (18.5) | … | 5154 (12.9) | 6329 (15.8) | 6952 (17.3) | 9193 (22.9) | 12 448 (31.1) |
| ȃMissing/Unknown | 3278 (1.5) | … | 488 (14.9) | 689 (21.0) | 557 (17.0) | 379 (11.6) | 1165 (35.5) |
| Urban-rural classification of facility | |||||||
| ȃLarge central metro | 87 541 (40.4) | 0.338 | 25 701 (29.4) | 17 394 (19.9) | 15 655 (17.9) | 16 957 (19.4) | 11 834 (13.5) |
| ȃLarge fringe metro | 50 557 (23.3) | … | 8790 (17.4) | 8474 (16.8) | 6147 (12.2) | 5362 (10.6) | 21 784 (43.1) |
| ȃMedium metro | 39 746 (18.3) | … | 7077 (17.8) | 7165 (18.0) | 5589 (14.1) | 4655 (11.7) | 15 260 (38.4) |
| ȃSmall metro | 20 747 (9.6) | … | 3803 (18.3) | 4739 (22.8) | 4742 (22.9) | 3305 (15.9) | 4158 (20.0) |
| ȃMicropolitan | 3887 (1.8) | … | 629 (16.2) | 1064 (27.4) | 857 (22.0) | 421 (10.8) | 916 (23.6) |
| ȃNon-core | 2913 (1.3) | … | 403 (13.8) | 827 (28.4) | 639 (21.9) | 341 (11.7) | 703 (24.1) |
| ȃUnknown | 11 276 (5.2) | … | 2287 (20.3) | 2466 (21.9) | 1964 (17.4) | 1543 (13.7) | 3016 (26.7) |
| Underlying respiratory condition at discharge | |||||||
| ȃNo | 96 142 (44.4) | 0.033 | 22 136 (23.0) | 18 274 (19.0) | 15 126 (15.7) | 14 327 (14.9) | 26 279 (27.3) |
| ȃYes | 120 525 (55.6) | … | 26 554 (22.0) | 23 855 (19.8) | 20 467 (17.0) | 18 257 (15.1) | 31 392 (26.0) |
| Underlying nonrespiratory condition at discharge | |||||||
| ȃNo | 32 296 (14.9) | 0.075 | 6227 (19.3) | 6238 (19.3) | 5180 (16.0) | 5186 (16.1) | 9465 (29.3) |
| ȃYes | 184 371 (85.1) | … | 42 463 (23.0) | 35 891 (19.5) | 30 413 (16.5) | 27 398 (14.9) | 48 206 (26.1) |
| Any likely immunocompromised status | |||||||
| ȃNo | 170 552 (78.7) | 0.067 | 37 369 (21.9) | 33 138 (19.4) | 28 345 (16.6) | 26 484 (15.5) | 45 216 (26.5) |
| ȃYes | 46 115 (21.3) | … | 11 321 (24.5) | 8991 (19.5) | 7248 (15.7) | 6100 (13.2) | 12 455 (27.0) |
| Immunization status and days since last dose | |||||||
| ȃUnvaccinated (referent) | 94 136 (43.4) | 0.245 | 17 089 (18.2) | 17 334 (18.4) | 15 768 (16.8) | 16 035 (17.0) | 27 910 (29.6) |
| ȃ2-dose mRNA <150 d since last dose | 26 208 (12.1) | … | 6447 (24.6) | 5163 (19.7) | 4010 (15.3) | 3394 (13.0) | 7194 (27.4) |
| ȃ2-dose mRNA ≥150 d since last dose | 43 821 (20.2) | … | 10 884 (24.8) | 8944 (20.4) | 7330 (16.7) | 6356 (14.5) | 10 307 (23.5) |
| ȃ3-dose mRNA <120 d since last dose | 17 605 (8.1) | … | 5086 (28.9) | 3711 (21.1) | 2806 (15.9) | 2089 (11.9) | 3913 (22.2) |
| ȃ3-dose mRNA ≥120 d since last dose | 12 754 (5.9) | … | 4043 (31.7) | 2710 (21.2) | 1934 (15.2) | 1390 (10.9) | 2677 (21.0) |
| ȃOther Immunization combination | 22 143 (10.2) | … | 5141 (23.2) | 4267 (19.3) | 3745 (16.9) | 3320 (15.0) | 5670 (25.6) |
| SARS-CoV-2 test result | |||||||
| ȃPositive | 37 703 (17.4) | 0.028 | 8096 (21.5) | 7571 (20.1) | 6359 (16.9) | 5753 (15.3) | 9924 (26.3) |
| ȃNegative | 178 964 (82.6) | … | 40 594 (22.7) | 34 558 (19.3) | 29 234 (16.3) | 26 831 (15.0) | 47 747 (26.7) |
| Known historical positive SARS-CoV-2 test result | |||||||
| ȃYes | 20 252 (9.3) | 0.062 | 3999 (19.7) | 4111 (20.3) | 3903 (19.3) | 3589 (17.7) | 4650 (23.0) |
| ȃNo | 196 415 (90.7) | … | 44 691 (22.8) | 38 018 (19.4) | 31 690 (16.1) | 28 995 (14.8) | 53 021 (27.0) |
Abbreviations: COVID-19, coronavirus disease 2019; mRNA, messenger RNA; SARS-CoV-2, severe acute respiratory syndrome coronavirus 2; SMD, standardized mean difference.
An absolute SMD ≥0.20 indicates a nonnegligible difference in variable distributions between emergency department and urgent care visits for different Social Vulnerability Index Groups. A single SMD was calculated by averaging the absolute SMDs obtained from pairwise comparisons of each SVI quartile category, excluding encounters without SVI due to missing geocoded data.
Unable to geocode or missing includes any patient encounters where the address was not provided or could not be geocoded.
Data from the BA.2 era (defined as the day after the BA.1 predominance period ended at each site (16–29 March 2022) through the last date of data collection at each site (26 June to 8 July 2022) was used for vaccination coverage only and was not included in VE analyses.
Baylor Scott & White Health (Texas).
HealthPartners (Minnesota and Wisconsin).
Intermountain Healthcare (Utah).
Kaiser Permanente Northwest (Oregon and Washington).
Paso Del Norte Health Information Exchange (Texas).
Regenstrief Institute (Indiana).
University of Colorado (Colorado).
Vaccination Coverage
From 1 January to 28 February 2021, when only mRNA products (Pfizer-BioNTech, Moderna) were authorized for adults, 48 618 patients had completed a primary vaccination series. An absolute difference in initial vaccine uptake of 8% was observed between the first and fourth SVI quartiles (Q1 = 15%, Q4 = 7%). Starting in March 2021, following CDC recommendations for three vaccine products (Pfizer-BioNTech, Moderna, and J&J) [18, 25, 26], the proportion of adults completing a primary series further diverged by SVI quartile (Figure 1). By 1 July 2021, there was a 20% absolute difference in primary vaccination series completion between highest and lowest quartiles (Q1 = 56%, Q4 = 36%). Similar trends were observed among patients with a completed primary series who received a booster dose (3rd dose mRNA or 2nd dose following J&J) and widened over time (Q1 = 8% and Q4 = 4% on 1 October 2021; Q1 = 44% and Q4 = 32% on 1 June 2022) (Figure 2). Differences remained when stratified by age (Supplementary Figures 1–3).
![Date COVID-19 primary series vaccination (2 mRNA doses or 1 Johnson & Johnson/Janssen [J&J] dose) completed by SVI quartile among unique subjects, 1 January 2021–8 July 2022*. *In the states represented in this analysis, the Delta variant was predominant from 1 June–3 July 2021, through 15 December–28 December 2021, depending on site. The Omicron variant was predominant beginning December 16–29 2021, through the conclusion of the study period. Abbreviations: COVID-19, coronavirus disease 2019; mRNA, messenger RNA; SVI, Social Vulnerability Index.](https://oup.silverchair-cdn.com/oup/backfile/Content_public/Journal/cid/76/9/10.1093_cid_ciad003/1/m_ciad003f1.jpeg?Expires=1750236474&Signature=XDTQLwHdE-q3BCUxehWYAMLkLKWuQy1UeCii~jUoXzE4IFcdvBFvmLWU~Pj-hfRgeAtoA~kRdUxfEkPzbCJZqCZ4mNumyU0xYWwdxHzqxkPmKnOq~wpMO2pf~2kyPCO69DnJm2ix25LU2JKhnIumx-wdnAmSApvh7clMMbfbSLkLgJbplCeV4aPWuR5UD0vw77y50A8EIq27WtPrxkQir8hx4YklxDpLczzHroIB8M4quUWRv0wKCLdLo7jND~M0umKCeR4Ebnri-EDyqNgJQmxZu63gxHZ3HD5uMHoM8LPVebTeEGrO-U7ZuIval6wJWTNkCog4~pPHgMD5-oURSQ__&Key-Pair-Id=APKAIE5G5CRDK6RD3PGA)
Date COVID-19 primary series vaccination (2 mRNA doses or 1 Johnson & Johnson/Janssen [J&J] dose) completed by SVI quartile among unique subjects, 1 January 2021–8 July 2022*. *In the states represented in this analysis, the Delta variant was predominant from 1 June–3 July 2021, through 15 December–28 December 2021, depending on site. The Omicron variant was predominant beginning December 16–29 2021, through the conclusion of the study period. Abbreviations: COVID-19, coronavirus disease 2019; mRNA, messenger RNA; SVI, Social Vulnerability Index.
![Date COVID-19 booster dose completed by SVI quartile among unique subjects with a completed primary series (3 mRNA doses or 1 Johnson & Johnson/Janssen [J&J] dose plus additional vaccine dose), 1 September 2021 to 8 July 2022*. *In the states represented in this analysis, the Delta variant was predominant from 1 June–3 July 2021, through 15 December–28 December 2021, depending on site. The Omicron variant was predominant beginning December 16–29 2021, through the conclusion of the study period. Abbreviations: COVID-19, coronavirus disease 2019; mRNA, messenger RNA; SVI, Social Vulnerability Index.](https://oup.silverchair-cdn.com/oup/backfile/Content_public/Journal/cid/76/9/10.1093_cid_ciad003/1/m_ciad003f2.jpeg?Expires=1750236474&Signature=o3ukz3Rtn~AGaTcYC~Y1IzANMQuaBqkQwtXIA68yYLmkOAT-bVVOkxgYvnZVjAFzGfnkKobtoTUYLh79heoQrwMlLOk5CW4C3fwTo8m74da6F0YUmCdHwp4j74dpgfYvU6u~kiaw2KIW9aa1UE03N4wyM0gBfITbBbmrla0Ie-M3JEZaS0uw1xeK9YpSTPZ6oPd75neZQZAOr6-eI3YUPkyICbVYIzK2KBkC0goJnPtl7Uw0A7zf1Vc~4MaMvh3YOT6MC5pU8biapD1vGb4zr6k7582~pwjvvOpv1eJfJNcIsNjwySGoG2PJNpFPciT45kvLqblvtva9wkLUEomZSA__&Key-Pair-Id=APKAIE5G5CRDK6RD3PGA)
Date COVID-19 booster dose completed by SVI quartile among unique subjects with a completed primary series (3 mRNA doses or 1 Johnson & Johnson/Janssen [J&J] dose plus additional vaccine dose), 1 September 2021 to 8 July 2022*. *In the states represented in this analysis, the Delta variant was predominant from 1 June–3 July 2021, through 15 December–28 December 2021, depending on site. The Omicron variant was predominant beginning December 16–29 2021, through the conclusion of the study period. Abbreviations: COVID-19, coronavirus disease 2019; mRNA, messenger RNA; SVI, Social Vulnerability Index.
Participants in VE Analysis
From 30 September 2021 to March 16–29, 2022, 168 384 adult patients with CLI-associated ED/UC encounters and 43 208 adult patients with CLI-associated hospitalizations were identified. In total, 191 085 ED/UC encounters (93 962 [49%] during the Delta period and 97 123 [51%] during BA.1) and 43 657 hospitalization encounters (21 948 [50%] during the Delta period and 21 709 [50%] during BA.1) were included in the VE analysis (Figures 3 and 4).
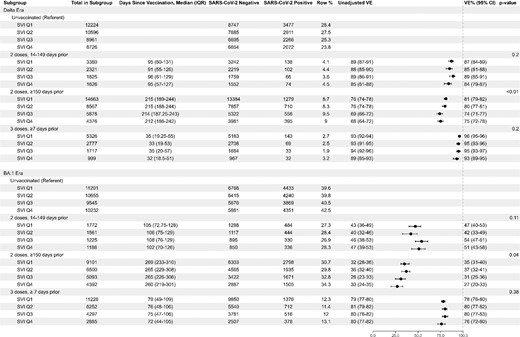
mRNA COVID-19 vaccine effectiveness against laboratory-confirmed COVID-19-associated emergency department or urgent care event by SVI quartile, vaccine doses and timing, and SARS-CoV-2 subvariant era. Abbreviations: COVID-19, coronavirus disease 2019; mRNA, messenger RNA; SARS-CoV-2, severe acute respiratory syndrome coronavirus 2; SVI, Social Vulnerability Index.
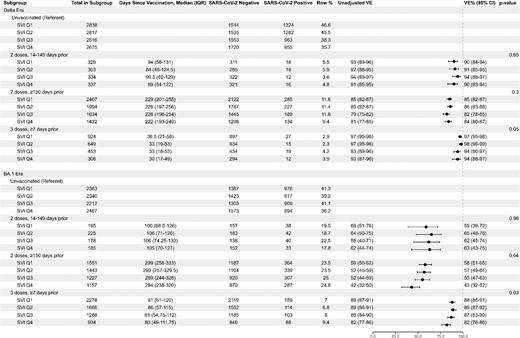
mRNA COVID-19 vaccine effectiveness against laboratory-confirmed COVID-19-associated hospitalization by SVI quartile, vaccine doses and timing, and SARS-CoV-2 subvariant era. Abbreviations: COVID-19, coronavirus disease 2019; mRNA, messenger RNA; SARS-CoV-2, severe acute respiratory syndrome coronavirus 2; SVI, Social Vulnerability Index.
COVID-19 VE by Overall SVI
During the Delta period, VE against COVID-19-associated ED/UC encounters after 2-dose mRNA vaccination 14–149 days prior was similar across all SVI quartiles and without consistent differences across quartiles, ranging from 84% in SVI Q4 (95% confidence interval [CI]: 79–87) to 89% in Q3 (95% CI: 85–91) (Figure 3). VE for 2-dose mRNA vaccination 14–149 days prior during BA.1 was also similar across SVI quartiles, ranging from 42% in Q2 (95% CI: 33–49) to 54% in Q3 (95% CI: 47–61). Similar VE was seen across SVI quartiles for 2-dose mRNA vaccination ≥150 days prior, ranging from 74% in Q3 (95% CI: 71–77) to 81% in Q1 (95% CI: 79–82) during Delta and 27% in Q4 (95% CI: 20–33) to 37% in Q2 (95% CI: 32–41) during BA.1, although the interaction term for both suggested some difference across quartiles (P < .05). During Delta predominance, 3-dose VE was estimated between 93% in Q4 (95% CI: 89–95) and 96% in Q1 (95% CI: 95–96), with no significant differences across quartiles. Three-dose VE remained similar during BA.1, with VE between 76% in Q4 (95% CI: 72–80) and 80% in Q2 and Q3 (95% CI: 77–82).
VE against a COVID-19-associated hospitalization after 2-dose mRNA vaccination 14–149 days prior was similar across SVI quartiles, ranging from 90% in Q1 and Q4 (95% CI: 83–94) to 94% in Q3 (95% CI: 88–97) during the Delta era and 59% in Q1 (95% CI: 39–72) to 65% in Q2 (95% CI: 48–76) during BA.1 (Figure 4). Similar patterns across SVI quartiles were seen for 2-dose mRNA vaccination ≥150 days prior, ranging from 82% in Q3 (95% CI: 78–85) to 86% in Q2 (95% CI: 83–88) during Delta and 43% in Q4 (95% CI: 32–52) to 58% in Q1 (95% CI: 51–65) during BA.1, although the interaction term was significant during BA.1 (P = .03). Similar values across SVI quartiles were observed in the Delta era for 3-dose VE, with estimates between 94% in Q3 and Q4 (95% CI: 88–97) and 98% in Q2 (95% CI: 96–99) (P = .05). During BA.1, 3-dose VE against a COVID-19-associated hospitalization was estimated between 82% in Q4 (95% CI: 76–86) and 89% in Q2 (95% CI: 87–92) (P = .03). Although the interaction term was statistically significant across SVI quartile groups during BA.1, absolute differences in VE were small and confidence intervals generally overlapped.
VE by SVI Theme and Age Group
VE estimates for COVID-19-associated ED/UC encounters were similar for each of the four SVI themes and each age group. Some VE estimates (eg, 2-dose ≥150 days group) for theme 1 (socioeconomic status) were statistically significantly different by quartile, but absolute differences were small (Supplementary Table 2). VE estimates for ED/UC encounters by age group were also statistically significant with similarly small absolute differences (Supplementary Table 3). VE against COVID-19-associated hospitalization by SVI theme and age group yielded similar results: VE estimates were similar across quartiles for each of the SVI themes and by age group. Where there were statistically significant differences in VE estimates, absolute differences remained small (Supplementary Tables 4 and 5).
DISCUSSION
As previously observed [3, 5, 6], COVID-19 vaccination coverage in the VISION Network population varied by SVI through July 2022, with adults in more vulnerable groups less frequently vaccinated. Among vaccinated individuals, those living in areas with greater social vulnerability were also vaccinated later. However, we did not find notable or consistent differences in VE by SVI (overall or within themes) after accounting for other patient-level factors. These findings suggest that differences in vaccine coverage, rather than VE, likely contribute to the disproportionate burden of COVID-19 illness observed within socially vulnerable communities.
The persistent differences in coverage by SVI over 1.5 years after COVID-19 vaccines were authorized suggests that vaccine hesitancy, in addition to barriers to access, is driving lower vaccination coverage within vulnerable communities. This highlights the need for more effective efforts to promote the benefits and safety of COVID-19 vaccines to mitigate disparities. The relationship between race and ethnicity and SVI has been well documented [27, 28], as have differences in vaccine hesitancy by some elements of SVI, including race and ethnicity, education, and income [29–32]. Considered in that context, the findings of this analysis make clear the importance of focusing efforts on identifying strategies to increase vaccination coverage among vulnerable groups with greater vaccine hesitancy to reduce disparities in disease burden and impact. Multipart, communication-based, and community-specific approaches tend to be most successful at reducing hesitancy and increasing vaccination uptake [33–35]. Educational initiatives, incorporating religious or community leaders, and embedding conversations around vaccination within routine healthcare settings have also been shown to be effective [33–37]. Social media has also proven to be a promising tool; for example, when used to provide a platform for information and answers, or to emphasize acceptance of vaccination as a social norm [33, 34, 36].
Evidence of a relationship between social vulnerability and VE is limited. Although several adult and pediatric VE studies have considered SVI as a covariate [20, 38–40], to our knowledge ours is the first study to report COVID-19 VE across SVI quartiles and themes. Studies from other vaccine-preventable diseases have offered clues on the role of social vulnerability. Studies of childhood rotavirus immunizations in high-income countries found decreased VE in lower SES neighborhoods [41, 42]. Further evidence of reduced VE of live oral rotavirus vaccines in low-income countries suggests an interplay of multiple SES-related factors, including differential disease epidemiology, preexisting medical conditions, malnutrition, and immune response [43]. Serology studies from rotavirus and other infectious diseases have demonstrated differences in immunoglobin levels by SES, with malnutrition, psychosocial stressors, and underlying medical conditions diminishing the development of antibodies [44]. However, other studies have shown antibody response by SES to be dependent on pathogen-specific epidemiology, complicating efforts to establish causality [45]. Beyond SES, research on the impact of crowded housing and population density has found that VE remains high despite increased disease transmission, suggesting (as in our findings) the stronger role of vaccination coverage in disease prevention [46]. Other studies have demonstrated the relationship between increased exposure, such as what might occur in areas with greater crowding or population density, and reduced vaccine efficacy [47]. Findings from these studies provide additional evidence to suggest that COVID-19 vaccines are effective across diverse populations.
This analysis was subject to several limitations. First, it did not account for effects of prior infection, which may differ by SVI quartile and impact VE if previous infection reduces the risk of re-infection. Second, about one-quarter of encounters were missing SVI and excluded, which may impact generalizability. Third, findings may not be generalizable to the entire US population. Furthermore, this analysis only assessed SVI in patients presenting for medical care with CLI discharge codes, which may also limit generalizability. Fourth, other factors such as differences in early vaccine priority groups [48, 49] or timing of booster dose eligibility [50] may have differed across SVI groups and affected uptake and timing of primary vaccination or booster doses. However, differences in coverage persisted after vaccines were widely available for all adults, and <1% of patients who completed their primary series <150 days before 1 September 2021 (late adopters), went on to receive a booster dose, so it is unlikely that the timing or uptake of booster doses was impacted by the timing of the primary series. Similarly, there may be unmeasured differences between cases and controls. Finally, under-ascertainment of vaccination coverage may have differed by SVI group, although unlikely to be significant given robust vaccine verification methods.
In this multistate analysis, COVID-19 vaccination coverage varied markedly by SVI. Differences in estimated VE by SVI, however, were small after adjusting for other patient-level factors. Lower vaccination coverage in areas with greater social vulnerability means that the burden of a preventable illness is still disproportionately borne by more vulnerable populations.
Supplementary Data
Supplementary materials are available at Clinical Infectious Diseases online. Consisting of data provided by the authors to benefit the reader, the posted materials are not copyedited and are the sole responsibility of the authors, so questions or comments should be addressed to the corresponding author.
Notes
Disclaimer. The findings and conclusions in this report are those of the authors and do not necessarily represent the official position of the Centers for Disease Control and Prevention.
Financial support. Z. A. W., E. S., T. L. S., V. L., K. D., T. C. O., M. B. D., A. L. N., M. N. S. K., N. G., S. R., E. B., J. A., M. A. B., S. E. R., N. R. V., and E. A. K. R. report support for this work from Centers for Disease Control and Prevention (CDC), payment made to Westat, Inc. S. A. I. reports study funded under subcontract from Westat (Protocol no. 75D30120C07986), paid to institution (KPNW Center for Health Research). O. Z. reports support for this work from CDC. B. E. D. reports support for this work from CDC via Westat, Inc, (VISION Contract with Indiana University). E. H. and C. S.-A. report contract and funding to support data contribution from Westat. A. B. K. reports subcontract through HealthPartners for VISION payment made to Children's Minnesota from CDC. M. G., I.-C. L., K. M., and C. R. report CDC-Westat institutional subcontract. P. J. E. reports Westat/CDC Grant Support for CDC VISION VE. S. B. reports support for this work from CDC, contract no. 200-2019-F-06819, payment made to Westat, Inc. J. N. reports funding from the CDC, paid via Westat to institution (PHIX).
References
Author notes
Potential conflicts of interest. B. E. D. reported consulting fees for advisory panel on HPV vaccination from Merck & Co and book royalties from Elsevier (book on HIE) as well as Springer Nature (book on Public Health Informatics), and grant to evaluate HIE technologies from US National Institutes of Health (NIH), grant to use HIE data for public health surveillance from CDC, R21 grant to evaluate HIE technologies from US Agency for Healthcare Research and Quality, grant to evaluate HIE technologies from US Department of Veterans Affairs. G. V. B. reported grants or contracts from Sanofi for Tdap Vaccine Safety and from CDC for Vaccine Safety Datalink. A. I. N. received institutional support from Pfizer for an unrelated study of meningococcal B vaccine safety during pregnancy and institutional research funding from Vir Biotechnology for unrelated influenza study. S. Rao received grant funding from GlaxoSmithKline. S. A. I. reports contract no. 200-2012-53584 (Vaccine Safety Datalink) from CDC. M. B. reports Columbia University is part of the VISION surveillance network and receives funding from Westat to support work done at Columbia as part of VISION. M. G. reports Ambulatory US Flu/COVID VE Network institutional grant, HAIVEN Adult Inpatient Flu/COVID VE institutional grant from CDC, IVY-3 PHS project institutional subcontract from CDC-Vanderbilt, and RECOVER study institutional subcontract from CDC-Abt. K. M. reports contracts or grants paid to institution from US CDC Ambulatory US Flu VE Network and US CDC HAIVEN—Hospitalized Adult Influenza Vaccine Effectiveness Network. All other authors report no potential conflicts.
All authors have submitted the ICMJE Form for Disclosure of Potential Conflicts of Interest. Conflicts that the editors consider relevant to the content of the manuscript have been disclosed.

