


Abstract
Cholera remains a public health threat for low- and middle-income countries, particularly in Asia and Africa. Shanchol™, an inactivated oral cholera vaccine (OCV) is currently in use globally. OCV and oral poliovirus vaccines (OPV) could be administered concomitantly, but the immunogenicity and safety of coadministration among children aged 1–3 years is unknown.
We undertook an open-label, randomized, controlled, inequality trial in Dhaka city, Bangladesh. Healthy children aged 1–3 years were randomly assigned to 1 of 3 groups: bivalent OPV (bOPV)-alone, OCV-alone, or combined bOPV + OCV and received vaccines on the day of enrollment and 28 days later. Blood samples were collected on the day of enrollment, day 28, and day 56. Serum poliovirus neutralizing antibodies and vibriocidal antibodies against Vibrio cholerae O1 were assessed using microneutralization assays.
A total of 579 children aged 1‒3 years were recruited, 193 children per group. More than 90% of the children completed visits at day 56. Few adverse events following immunization were recorded and were equivalent among study arms. On day 28, 60% (90% confidence interval: 53%–67%) and 54% (46%–61%) of participants with co-administration of bOPV + OCV responded to polioviruses type 1 and 3, respectively, compared to 55% (47%–62%) and 46% (38%–53%) in the bOPV-only group. Additionally, >50% of participants showed a ≥4-fold increase in vibriocidal antibody titer responses on day 28, comparable to the responses observed in OCV-only arm.
Co-administration of bOPV and OCV is safe and effective in children aged 1–3 years and can be cost-beneficial.
ClinicalTrials.gov (NCT03581734).
Poliomyelitis (polio), a highly infectious disease caused by 3 serotypes, predominantly impacts children <5 years. Bivalent oral poliovirus vaccine (bOPV), containing live, attenuated Sabin strain poliovirus serotypes 1 and 3, is licensed for use in campaigns since 2010, and has been used in routine childhood immunization since 2016 [1, 2]. OPV not only stimulates antibody responses in the blood but also on mucosal surfaces, which limits the virus's ability to replicate in the intestinal tract. The countries and areas that implement OPV campaigns because of low routine vaccination coverage are also at risk for cholera. If these vaccines could be co-administered, it would reduce the cost compared with administering bOPV and oral cholera vaccine (OCV) separately.
Cholera remains a public health threat for low- and middle-income countries [3]. An estimated 2.9 million cases and 95 000 deaths occur per year in cholera endemic countries [4, 5]. The Global Task Force on Cholera Control (GTFCC) launched a strategy “Ending Cholera-A Global Roadmap to 2030” in 2017 [6]. The roadmap aims to reduce cholera mortality by 90% by 2030 and focuses on the 47 cholera endemic countries. Cholera-prone countries, technical partners, and donors will need to make action plans in order to eliminate cholera in their settings by 2030 [5, 7]. A new generation of whole-cell killed OCVs are available and studies have shown these vaccines to be safe and effective for 3‒5 years [8–11].
Vaccine co-administration has numerous advantages such as reduction in delivery costs and likely reduction in the numbers of visits in routine immunization schedule. Although immunological interference from co-administration of live and non-live vaccines is thought to be generally low [12–15], one study showed that co-administration of live-attenuated oral human rotavirus vaccine and poliovirus vaccines were well tolerated and immunogenic [16]. But there were no studies to determine if bOPV and OCV can be co-administered without affecting the immunogenicity of either vaccine. This study evaluated the safety and immunogenicity of bOPV and OCV administered simultaneously.
METHODS
Ethics Statement
Informed consent was obtained from the legal guardians of the children. The protocol was approved by the Institutional Review Board (IRB) of the International Centre for Diarrheal Disease Research, Bangladesh (icddr,b), the US Centers for Disease Control and Prevention (CDC), and Stanford University. The trial was registered in ClinicalTrials.gov (NCT03581734).
Study Site
The study was conducted in southern city corporation area of Dhaka, Bangladesh, which included Rayerbazar, Hazaribagh, and Kamrangirchar (Supplementary Figure 1). The study area had densely populated urban slums with a total population of approximately 300 000. The standard schedule for poliovirus vaccines in Bangladesh is bOPV at birth and 6, 10, and 14 weeks of age; inactivated poliovirus vaccine ([IPV], containing all 3 serotypes) is also to be administered intramuscularly at 14 weeks of age.
Study Design
We conducted an open-label, randomized controlled study in 2018 and 2019 among healthy children aged 1–3 years who had previously received no more than 1 dose of bOPV and had not received any dose of IPV or OCV at any time before enrollment. Children were excluded if they had a clinical condition consistent with an immunodeficiency disorder (or in a member of the immediate family) or were on long-term (>3 months) immunosuppressive therapy, had a known history of severe allergic reaction to a component of study vaccine, or had a bleeding disorder. This age group was chosen because OPV campaigns generally target children aged <5 years [17, 18]. We identified children from study area who had received no more than 1 dose of bOPV and had not received any dose of IPV/OCV. Eligible children were enrolled in the study after written informed consent was obtained from caretakers. Participants were randomized to 1 of 3 groups: bOPV-alone, OCV-alone, or combined bOPV + OCV, at an allocation ratio of 1:1:1. Sealed, sequentially numbered, privacy envelopes with group assignments were shared with study staff so that they did not have a priori knowledge of randomization scheme. Children of bOPV-alone and bOPV + OCV groups received bOPV on days 0 and 28 and bOPV plus IPV on day 56. Children of OCV-alone and bOPV + OCV groups received OCV on days 0 and 28. All enrolled children received 3 doses of bOPV plus IPV by completion of the study.
Enrolled children were contacted by the study staff by phone call or home visit to reduce dropouts. Approximately 2–3 mL of blood was collected before administering the first dose of vaccines (Day 0), before administering the second dose of vaccines (Day 28 ± 3) and on Day 56 ± 3. After randomization, the group assignment of participants was known to study staff and participants’ parents. Laboratory staff who tested specimens were not aware of group assignment.
Adverse Event Monitoring
Participants were advised to remain at the vaccination site for at least 30 minutes after the dose was administered so that immediate adverse events such as allergic reactions to the vaccine could be taken care of. In addition, participants were followed up for 14 days after each dose to record any adverse events following immunization (AEFI). Serious adverse events (SAE) were also monitored for the study period.
Laboratory Analysis
We assessed the presence of poliovirus neutralizing antibodies to all 3 poliovirus types using microneutralization assay on serum samples taken on days 0, 28, and 56 at the US Centers for Disease Control and Prevention (CDC) Laboratory in Atlanta, Georgia, USA [19]. Briefly, test sera were serially diluted then mixed with 50% cell culture infectious doses (CCID50) of poliovirus type 1, 2, or 3. After incubating for 3 hours, HEP-2c cells were added to the virus-serum mixture and incubated for 5 days. Staining with crystal violet revealed virus-induced cytopathic effect. Neutralization titers were estimated using the Spearman–Kärber method and reported as the reciprocal of the calculated titer with upper limit of detection of 1448. Immune response was defined as a ≥4-fold increase in the reciprocal antibody titers between pre- and post-immunization specimens or antibody titers from seronegative (<1:8: at baseline) to seropositive (≥1:8). A neutralization titer of 1:8 or greater is correlated with protection from paralytic polio [20].
We evaluated serum vibriocidal antibodies to V. cholerae O1 (El Tor Inaba T-19479; Ogawa X-25049) with a microtiter assay. The vibriocidal titer was defined as the highest dilution causing 50% inhibition of bacterial growth. Twofold serial dilutions of specimens taken on days 0, 28, and 56 were tested simultaneously in duplicates on each plate. To compensate for variations between analysis from different occasions, we adjusted the titers with a reference serum specimen included in each test and repeated the tests if large variations were observed. An immune response was defined as ≥4-fold increase in titer between pre- and post-immunization specimens from baseline to day 28 ± 3 and day 56 ± 3. To control for variations, test plates also contained pooled convalescent serum samples from patients with cholera as a positive control (pooled O1 Ogawa and O1 Inaba) [21, 22].
Both positive and negative controls were used on each plate and all samples were tested in triplicate.
STATISTICAL ANALYSES
Sample size calculation was based on the hypothesis that the immune response to bOPV and OCV administered simultaneously is non-inferior to the immune response observed for each vaccine when administered alone. For polio, the hypothesis was limited to comparing the immune response to poliovirus types 1 and 3. Assuming the percentage of children who show antibody response for bOPV is approximately 50%, a non-inferiority margin of 15% with a 5% level of significance and, 85% study power, we estimated 173 children would be needed in each group. Accounting for 10% attrition, we calculated an enrollment target of 579 children who had received either no or one dose of bOPV (193 per group). A χ2 test was performed to assess the difference in baseline characteristics between study groups. The non-parametric Kruskal–Wallis test was used to assess differences in measured antibody titer distribution among study groups. Non-inferiority was assessed by comparing the lower bound of a 90% (2-tailed) Wald confidence interval (CI) to the non-inferiority margin (−15%). More specifically, we measured the differences in antibody response levels days 28 and 56 after the first dose or cumulative with the second dose. We consider the co-administrated vaccine as non-inferior if the lower limit of the 90% CI of the difference in the 2 proportions was > −15%. The results were analyzed in the modified intention-to-treat populations (children who received bOPV and/or OCV per group assignment and had antibody titer results for days 0, 28, and 56 of enrollment). Data were analyzed using SAS software version 9.4 (SAS Institute Inc) and R (version 4.0.2).
RESULTS
From 2018 to 2019, we enrolled 579 children aged 1–3 years (median age: 28 months) and assigned 193 children to each group. The modified intention-to-treat analysis included 529 (91%) participants (Figure 1). Among all demographic characteristics, only level of education of the household head was significantly different among the study groups. While household head income and household size were similar, there was a significant difference in education level among the 3 groups. At baseline, the seroprevalence of the poliovirus types 1, 2, and 3 did not differ by group (Table 1). When we compared the 28-day and 56-day titers after vaccine administration among the groups we did not observe any significant difference (P > .05) (Table 2).
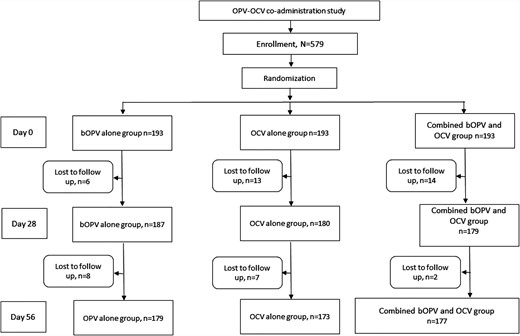
CONSORT flow diagram of OPV-OCV co-administration study. Abbreviations: bOPV, bivalent oral poliovirus vaccine; OCV, oral cholera vaccine; OPV, oral poliovirus vaccine.
Baseline Characteristics of the Participants
| Characteristics | Children Received bOPV Alone | Children Received OCV Alone | Children Received Combined bOPV and OCV | P- value for Pearson χ2 Test or Kruskal–Wallis Test | |
|---|---|---|---|---|---|
| Age | 12−23 m | 67 | 55 | 63 | >.05 |
| 24−35 m | 73 | 74 | 66 | ||
| 36−47 m | 47 | 51 | 50 | ||
| Median (IQR) | 28 (21, 36) | 29 (22, 36) | 29 (21, 36) | >.05 | |
| Prior OPV dose | 0-dose OPV | 68 | 70 | 75 | >.05 |
| 1-dose OPV | 119 | 110 | 104 | ||
| Sex | Male | 79 | 94 | 86 | >.05 |
| Female | 108 | 86 | 93 | ||
| Household Head income BDT | Median (IQR) | 16 000 (13 000, 20 000) | 15 000 (12 000, 20 000) | 16 000 (14 000, 20 000) | >.05 |
| Household size | Median (IQR) | 4 (3, 5) | 4 (4, 5) | 4 (4, 6) | >.05 |
| Education of household head | No education | 75 | 80 | 54 | <.05 |
| Primary level (Class 1–5) | 75 | 61 | 62 | ||
| Secondary level (Class 6–10) | 31 | 32 | 53 | ||
| S.S.C.a (>Class 10) | 6 | 7 | 10 | ||
| Prevalence at baseline | Poliovirus type 1 | 90/179 (50%) | 79/173 (44%) | 77/177 (43%) | >.05 |
| Poliovirus type 2 | 50/179 (28%) | 44/173 (25%) | 47/177 (26%) | >.05 | |
| Poliovirus type 3 | 89/179 (50%) | 81/173 (45%) | 82/177 (46%) | >.05 |
Abbreviations: bOPV, bivalent oral poliovirus vaccine; IQR, interquartile range; OCV, oral cholera vaccine; OPV, oral poliovirus vaccine.
Secondary school certificate.
Antibody Titers (Median and Interquartile Range [IQR]) to Against the Poliovirus and Vibrio cholerae O1 During Study Visits
| Study Day Points | Serotypes | Children Received Only bOPV Median (IQR) | Children Received Only OCV Median (IQR) | Children Received bOPV and OCV Median (IQR) |
|---|---|---|---|---|
| Baseline (Day 0) titers | Poliovirus type 1 | 3.17 (2.5, 9.17) | 2.5 (2.5, 7.83) | 2.5 (2.5, 7.83) |
| Poliovirus type 2 | 2.5 (2.5, 3.5) | 2.5 (2.5, 3.17) | 2.5 (2.5, 3.17) | |
| Poliovirus type3 | 2.83 (2.5, 6.83) | 2.5 (2.5, 6.83) | 2.5 (2.5, 6.17) | |
| Inaba | 5 (5, 10) | 5 (5, 5) | 5 (5, 5) | |
| Ogawa | 5 (5, 5) | 5 (5, 5) | 5 (5, 5) | |
| Visit 2 (Day 28) titers | Poliovirus type 1 | 10.17 (7.5, 10.5) | 2.5 (2.5, 8.5) | 10.5 (7.83, 10.5) |
| Poliovirus type 2 | 2.5 (2.5, 6.17) | 2.5 (2.5, 3.83) | 2.5 (2.5, 6.83) | |
| Poliovirus type 3 | 8.5 (3.5, 10.17) | 3.17 (2.5, 7.17) | 8.5 (4.83, 10.5) | |
| Inaba | 5 (5, 20) | 10 (5, 80) | 40 (5, 160) | |
| Ogawa | 5 (5, 5) | 20 (5, 80) | 20 (5, 160) | |
| Visit 3 (Day 56) titers | Poliovirus type 1 | 10.5 (9.5, 10.5) | 2.83 (2.5, 8) | 10.5 (9.5, 10.5) |
| Poliovirus type 2 | 2.5 (2.5, 7.83) | 2.5 (2.5, 3.17) | 2.5 (2.5, 5.83) | |
| Poliovirus type 3 | 9.5 (7.17, 10.5) | 3.5 (2.5, 7.17) | 9.17 (6.83, 10.5) | |
| Inaba | 5 (5, 10) | 20 (5, 80) | 20 (5, 80) | |
| Ogawa | 5 (5, 5) | 20 (5, 80) | 20 (5, 80) |
When we compared the 28-day and 56-day titers after vaccine administration among the groups (bOPV-only vs bOPV + OCV or OCV-only vs bOPV + OCV), we did not observe any significant difference (P > .05).
Abbreviations: bOPV, bivalent oral poliovirus vaccine; OCV, oral cholera vaccine; OPV, oral poliovirus vaccine.
Polio and Vibriocidal Antibody Titers
On day 28 in the bOPV-alone group, the median neutralizing antibody titers for poliovirus type 1 was 10.17 (interquartile range [IQR]: 7.5–10.5), 2.5 (IQR: 2.5–6.17) for type 2 and 8.5 (IQR: 3.5–10.2) for type 3; on day 56 the median titer for poliovirus type 1 was 10.5 (IQR: 9.5–10.5), type 2 was 2.5 (IQR: 2.5–7.8) and type 3 was 9.5 (IQR: 7.2–10.5). At follow-up on both days 28 and 56 in the OCV-only group, the median vibriocidal antibody titer for serotype Inaba and for Ogawa was 20 (IQR: 5–80). In the group who had bOPV + OCV co-administrated, median neutralizing antibody titers for poliovirus type 1 and type 3 were comparable to titers in the bOPV only group on days 28 and 56. The median vibriocidal antibody titer on day 28 for Inaba was 40 (IQR: 5–160) and for Ogawa, 20 (IQR: 5–80). Median levels of vibriocidal antibodies on day 56 in the co-administration group were 20 (IQR: 5–80) for both assays and comparable to those in the OCV-only group (Table 2).
Immune Response Following bOPV-only Vaccination
On day 28, in the bOPV only group, the immune responses (≥4-fold increase in neutralizing antibody titers) were 55% (98/179) [90% CI: 47%–62%] for poliovirus type 1; for type 2, 12% (21/179) [90% CI: 7%–16%]; and for type 3, 46% (82/179), [90% CI: 38%–53%] Immune responses on day 56 for poliovirus types 1, 2, and 3 were 26% (21/81) [90% CI: 16%–36%], 9% (15/158) [90% CI: 5%–14%) and 42% (41/97) [90% CI: 32%–52%] respectively. Cumulative response after two doses were 66% (119/179) [90% CI: 59%–73%] for poliovirus type 1, 20% (36/179) [90% CI: 14%–26%] for type 2 and 69% (123/179) [90% CI: 62%–76%] for type 3 (Table 3).
Comparison of Immune Response to Poliovirus and Vibrio cholerae O1 Among Study Groups by Study Visit by Comparing the Proportion Seropositive to Each Antigen
| Study Visit (Day) | Serotypes | Children Received Only bOPV [90% CI] | Children Received Only OCV [90% CI] | Children Received bOPV + OCV [90% CI] | Combined bOPV + OCV, bOPV-alone Percent Difference [90% CI] | Combined bOPV + OCV, OCV-alone Percent Difference [90% CI] | P- value for Non-inferior Test |
|---|---|---|---|---|---|---|---|
| Visit 2 (Day 28) | Poliovirus type 1 | 98/179 = 55% [47%, 62%] | … | 106/177 = 60% [53%, 67%] | 5.1% [−3.4%, 13.7%] | … | <.0001 |
| Poliovirus type 2 | 21/179 = 12% [7%, 16%] | … | 31/177 = 18% [12%, 23%] | 5.8% [−.8%, 12.4%] | … | <.0001 | |
| Poliovirus type 3 | 82/179 = 46% [38%, 53%] | … | 95/177 = 54% [46%, 61%] | 7.9% [−.8%, 16.5%] | … | <.0001 | |
| Inaba | … | 89/173 = 51% [44%, 59%] | 109/177 = 62% [54%, 69%] | … | 10.1% [1.5%, 18.8%] | <.0001 | |
| Ogawa | … | 97/173 = 56% [49%, 64%] | 104/177 = 59% [51%, 66%] | … | 2.7% [−5.9%, 11.3%] | .0001 | |
| Visit 3 (Day 56) | Poliovirus type 1 | 21/81 = 26% [16%, 36%] | … | 18/71 = 25% [15%, 36%] | 3.6% [−4.6%, 11.7%] | … | <.0001 |
| Poliovirus type 2 | 15/158 = 9% [5%, 14%] | … | 11/146 = 8% [3%, 12%] | 4.2% [−3.1%, 11.4%] | … | <.0001 | |
| Poliovirus type 3 | 41/97 = 42% [32%, 52%] | … | 36/82 = 44% [33%, 55%] | 6.9% [−1.2%, 15%] | … | <.0001 | |
| Inaba | … | 27/84 = 32% [22%, 42%] | 10/68 = 15% [6%, 23%] | … | −2.5% [−11.1%, 6.1%] | <.0001 | |
| Ogawa | … | 34/76 = 45% [33%, 56%] | 24/73 = 33% [22%, 44%] | … | −3.3% [−11.3%, 4.7%] | .0044 | |
| Cumulative response after 2 doses | Poliovirus type 1 | 119/179 = 66% [59%, 73%] | … | 124/177 = 70% [63%, 77%] | 3.6% [−4.5%, 11.7%] | … | <.0001 |
| Poliovirus type 2 | 36/179 = 20% [14%, 26%] | … | 42/177 = 24% [17%, 30%] | 3.6% [−3.7%, 10.9%] | … | <.0001 | |
| Poliovirus type 3 | 123/179 = 69% [62%, 76%] | … | 131/177 = 74% [67%, 81%] | 5.3% [−2.6%, 13.2%] | … | <.0001 | |
| Inaba | … | 116/173 = 67% [60%, 74%] | 119/177 = 67% [60%, 74%] | … | .2% [−8%, 8.4%] | <.0001 | |
| Ogawa | … | 131/173 = 76% [69%, 82%] | 128/177 = 72% [66%, 79%] | … | −3.4% [−11.1%, 4.3%] | .0054 |
Abbreviations: bivalent oral poliovirus vaccine; CI, confidence interval; OCV, oral cholera vaccine; OPV, oral poliovirus vaccine.
Immune Response to Vibrio Cholerae O1
On day 28, vaccination in the OCV-only group resulted in, vibriocidal antibody response (≥4-fold rise in antibody titer) of 51% (89/173) [90% CI: 44%–59%] for serotype Inaba, and 56% (97/173) [90% CI: 49%–64%] for serotype Ogawa. On day 56, vibriocidal antibody response for serotype Inaba and Ogawa was 32% (27/84) [90% CI: 22%–42%] and 45% (34/76) [90% CI: 33%–56%], respectively. Cumulative response after two doses was 67% (116/173) [90% CI: 60%–74%] for Inaba and 76% (131/173) [90% CI: 69%–82%] for Ogawa (Table 3).
Responses to Vaccine Co-administration
On day 28 in the coadministration group, the poliovirus specific neutralizing antibody responses for poliovirus were 60% [90% CI: 53%–67%], 18% [90% CI: 12%–23%] and 54% [90% CI: 46%–61%] for poliovirus types 1, 2, and 3, respectively. Meanwhile, the poliovirus-specific antibody response on day 56 for poliovirus types 1 and 3 decreased to 25% [90% CI: 15%–26%] and 44% [90% CI: 33%–55%] whereas cholera-specific vibriocidal antibody response for serotype Inaba and Ogawa were 15% [90% CI: 6%–23%] and 33% [90% CI: 22%–44%], respectively (Table 3).
When administered simultaneously, the immunogenicity of OPV + OCV was non-inferior to those vaccines administered separately. On day 28, the percent differences in antibody response point estimates between the OPV + OCV group compared to the OPV-only group were 5.1% [90% CI: −3.4%–13.7%], and 7.9% [90% CI: −.8%–12.4%] for poliovirus type 1 and 3, while the differences for type 1, and 3 on day 56 dropped to 3.6% [90% CI: −4.6%–11.7%] and 6.9% [90% CI: −1.2%–15%], respectively. The difference in vaccine-specific responses between the bOPV + OCV group and the OCV-only group for Inaba and Ogawa was 10.1% [90% CI: 1.5%–18.8%] and 2.7% [90% CI: −5.9%–11.3%] on day 28 vs −2.5% [90% CI: −11.1%–6.1%] and −3.3% [90% CI: −11.3%–4.7%] on day 56 (Table 3 and Figure 2).
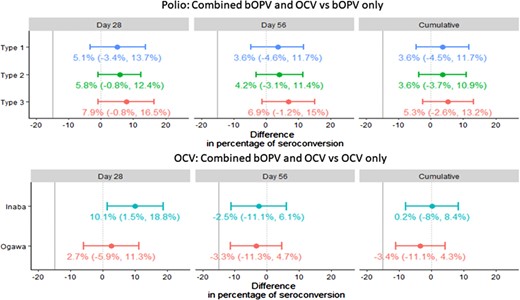
Difference in percentage of immune response in children after receiving combined bOPV and OCV and bOPV only, or combined bOPV and OCV and OCV only. Abbreviations: bOPV, bivalent oral poliovirus vaccine; OCV, oral cholera vaccine; OPV, oral poliovirus vaccine.
We observed comparable levels of poliovirus-specific neutralizing antibody responses in bOPV-alone and combined bOPV and OCV for poliovirus type 1 (55% vs 60%), and 3 (46% vs 54%). We also observed similar levels of vibriocidal antibody responses in participants in OCV-alone group vs combined bOPV + OCV which includes Ogawa (56% vs 59%) and Inaba (51% vs 62%) (Table 2). The difference in the antigen-specific antibody response was less than 15% among all cohorts, indicating non-inferiority of co-administration of bOPV and OCV compared to bOPV- or OCV-alone (Figure 2).
Adverse Events
We recorded a total of 16 AEFI among seven males and nine females during the study period; 7 AEFI were recorded during the first visit and 9 during the second visit. An equal number AEFI (n = 8) were recorded in both OCV-alone and the combined group, consisting of fever, diarrhea and vomiting; children received symptomatic treatment. None of the children in the bOPV-alone group experienced AEFI. There were no serious adverse events (SAE) among the participants during the study.
DISCUSSION
To our knowledge, this is the first study of co-administration of OCV and bOPV in children aged 1–3 years, who are at the highest risk for both diseases. The study results are useful when bOPV and OCV are likely to be co-administered such as integrated OPV and OCV campaign. The results of this study cannot be applied to essential immunization for coadministration of OPV and OCV as part of routine childhood immunization. In the current study, comparable response rate has been observed in comparison to earlier studies that had used same vaccines. However, in addition to this rate, we should also consider indirect protection that will add with the current response rate and that will increase the percentage of protection. Our data suggest that the co-administration of these 2 oral vaccines causes no excess AEFIs, no SAEs, and induces comparable humoral immune responses to those observed with the use of each vaccine independently. Bangladesh and all other member states of the WHO South-East Asian Region were proclaimed free of indigenous endemic WPV transmission by the Regional Certification Commission in 2014 [23, 24]. In 2016, bOPV replaced trivalent OPV (Sabin strain types 1, 2 and 3) for routine childhood polio vaccination [2] and this change of OPV no longer protects against type 2 poliovirus [25]. IPV boost the responses to all poliovirus types, therefore it was included in routine immunization to provide immunity against type 2 poliovirus [26]. Two doses of OCV are recommended for protection against cholera, a single dose of OCV can also prevent cholera cases reducing logistical requirements [27]. Several immunogenicity studies with OCV suggest that a single dose of vaccine elicits antibody responses similar to that seen after two doses given 2–4 weeks apart [28, 29]. Epidemiological studies have shown that single dose of OCV provided moderate protection from cholera [27, 30]. The lower vaccine efficacy after single dose in children is low even after 6 months [30] and is of concern and prompted us to evaluate immunogenicity of 2 additional doses of vaccine administered three year later after initial OCV single dose [31]. Therefore, this is recommended to complete full dose for getting full protection.
Bleeding of the participants for multiple times in close window is sensitive in community. Therefore, by considering feasibility, investigators have designed the blood drawing schedule as mentioned. However, further study can be designed in a subset of participants by considering narrow window for better understanding of the OCV immune response.
The major strength of this study is that participants were randomly assigned to each intervention arm; hence there was a low risk of confounding, and the study further strengthened by selecting a narrow age range. The current study does have several limitations. First, we could not explore the immunogenicity status of the children aged <1 due to current OCV age recommendations. For the children who had already received a dose of OPV, it was not possible to determine if the interaction with OCV interfered with the immune response to the first dose of OPV in non-immunized children. Second, the study was underpowered for detecting rare AE or minor differences in immune responses.
All study activities were conducted after global type 2 OPV cessation. However, we observed a cumulative type 2 immune response of 20–24% in study arms receiving bOPV and in OCV only arm, it was 3%. Another clinical settings in different part of Dhaka by a different set of icddr,b coinvestigators also reported unexpected type 2 immune response [32]. Although the type 2 immune response observed in this study could be from unexpected background exposure to type 2 OPV, responses were only observed in 2 of 3 study arms.
Children under the age of 5 have the highest cholera incidence and account for over half of all cholera deaths [33]. If combined OPV and OCV are administered through campaign, complicated and resource intensive logistics could be simplified, and vaccination coverage might be improved [34, 35]. Co-administration could also reduce the total costs as the number of campaigns will be reduced [36]. The major challenge with co-administration in a campaign is that the age groups will be different, as the target population for OPV is from birth onward, but for OCV it is for children aged ≥1.
In summary, the study suggests the feasibility of co-administration of bOPV and OCV in children >1 year. Co-administration of OCV with bOPV in children can be safely and effectively carried-out to increase population immunity to both. Our study informs policy makers about the benefits of vaccine co-administration.
Supplementary Data
Supplementary materials are available at Clinical Infectious Diseases online. Consisting of data provided by the authors to benefit the reader, the posted materials are not copyedited and are the sole responsibility of the authors, so questions or comments should be addressed to the corresponding author.
Notes
Acknowledgments. The icddr,b is grateful to the Government of Bangladesh, Canada, Sweden, and the United Kingdom for providing core/unrestricted support. They thank the study participants and the study workers. They also thank the Dhaka South and Dhaka North City Corporation, Expanded Program on Immunization (EPI) Office.
Financial support. This work was supported by the Centers for Disease Control and Prevention.
Potential conflicts of interest. The authors: No reported conflicts of interest.
All authors have submitted the ICMJE Form for Disclosure of Potential Conflicts of Interest. Conflicts that the editors consider relevant to the content of the manuscript have been disclosed.
References
Author notes
M. T. I. and K. D. contributed as first author.

