


Abstract
Timely, accurate adherence data may support oral pre-exposure prophylaxis (PrEP) success and inform prophylaxis choice. We evaluated a Food and Drug Administration (FDA)-approved digital health feedback system (DHFS) with ingestible-sensor-enabled (IS) tenofovir-disoproxil-fumarate plus emtricitabine (Truvada®) in persons starting oral PrEP.
Human immunodeficiency virus (HIV)-negative adults were prescribed IS-Truvada® with DHFS for 12 weeks to observe medication taking behavior. Baseline demographics, urine toxicology, and self-report questionnaires were obtained. Positive detection accuracy and adverse events were computed as percentages, with Kaplan Meier Estimate for persistence-of-use. In participants persisting ≥28 days, adherence patterns (taking and timing) were analyzed, and mixed-effects logistic regression modeled characteristics associated with treatment adherence.
Seventy-one participants were enrolled, mean age 37.6 years (range 18–69), 90.1% male, 77.5% White, 33.8% Hispanic, 95.8% housed, and 74.6% employed. Sixty-three participants (88.7%) persisted ≥28 days, generating 4987 observation days, average 79.2 (29–105). Total confirmed doses were 86.2% (95% confidence interval [CI] 82.5, 89.4), decreasing over time, odds ratio (OR) 0.899 (95% CI .876, .923) per week, P < .001; 79.4% (95% CI 66.7%, 87.3%) of participants had ≥80% adherence. Pattern analysis showed days without confirmed doses clustered (P = .003); regular dose timing was higher among participants with ≥80% confirmed doses (0.828, 95% CI .796 to .859) than among those with <80% (0.542, 95% CI95 .405 to .679) P < .001. In multi-predictor models, better adherence was associated with older age, OR 1.060 (95% CI 1.033, 1.091) per year, P < .001; negative vs positive methamphetamine screen, OR 5.051 (95% CI 2.252, 11.494), P < .001.
DHFS with IS-Truvada® distinguished adherent persons from those potentially at risk of prophylactic failure. Ongoing methamphetamine substance use may impact oral PrEP success.
“The art has three factors, the disease, the patient, the physician. The physician is the servant of the art. The patient must cooperate with the physician in combatting the disease.” -Hippocrates
Successful provision of pre-exposure prophylaxis (PrEP), as with any long-term therapy, requires a compassionate art, involving a highly individualized series of investigations into how each patient and their disease risk intertwine over time, with trust and honesty between both patient and physician (A. G. Richey et al, under review). Both providers and patients have described concerns with oral PrEP medication adherence as a barrier to successful implementation [1, 2]. There are still no highly accurate real-time adherence measurement tools used in clinical practice to guide patient and physician discussions around these concerns. Clinicians continue to depend principally on self-reported adherence, subject to recall bias [3–5] and patient’s efforts to avoid a “disciplinary” reply from their physicians when disclosing nonadherence [6]; or pharmacy refills, which indicate what a patient has on hand but provide no information on if and when medications are taken [7].
Consequently, we have limited understanding of patient patterns of oral PrEP adherence beyond a few clinical trials. Such behavior patterns have consequences for prophylactic success based on the post-dose duration of therapeutically effective drug action and the recommended interval between doses, described by the term “drug forgiveness” [8, 9]. These patterns also indicate whether an individual has acquired habit formation around the recommended dosing interval. Long-acting injectable formulations (LAI), such as cabotegravir [10], will now allow choices that expand current oral prophylactic options. To optimally guide and support patients in choosing their best PrEP options over time, accurate understanding of patient patterns of adherence are necessary. Such information would also support oral PrEP lead-in and treatment cessation coverage for successful LAI implementation.
Novel digital medicine technologies can provide accurate remote real-time oral dose ingestion confirmation, as well as bidirectional treatment adherence support [11–13]. The Food and Drug Administration (FDA)-approved Digital Health Feedback System (DHFS) consists of an ingestible sensor, external wearable patch and paired mobile device [14]. It detects and records the timing of ingestion events, plus physiologic measures, that are then automatically uploaded to a secure Internet server, allowing patients and healthcare providers to follow medication taking in real time and facilitate patient provider communication (See Supplementary Figure 1).
We performed an open label clinical trial of the DHFS with digitalized tenofovir disoproxil plus emtricitabine (Truvada®) over a 3-month period in persons at risk of human immunodeficiency virus (HIV) infection starting oral PrEP. We evaluated: DHFS adherence measurement accuracy, persistence of use, adverse events, ability to capture patterns of adherence behavior, and the association of predictors with adherence expressed as both a continuous variable, and based on an a priori “successful” 80% adherence threshold.
METHODS
In this prospective single-arm open label intervention study using DHFS, participants were prescribed co-encapsulated ingestible sensor-enabled oral Truvada (IS-Truvada®) for PrEP for 12 weeks [15]. Study staff directly observed ingestions at baseline (with DHFS use training) and at weeks 1, 2, 4, 8, 12, to determine the DHFS positive detection accuracy (PDA), defined as the proportion of sensors administered under direct observation that were detected by the system. The study was powered to estimate PDA with a margin of error of ≤0.036, with 10% dropout. Accordingly, N = 60 participants provided 80% power to reject the hypothesis of PDA = 0.96, if the PDA ≥ 0.989 by 1-sample binomial test. Any patch skin reactions were reviewed. The 12-week study duration simulates a typical initial PrEP follow-up period.
Eligible participants were HIV and hepatitis B seronegative, ≥18 years old, at risk for HIV, and desiring oral PrEP. Participants were recruited from the University of California San Diego Antiviral Research Center (UCSD AVRC), UCSD Owen Clinic, or other primary care clinics in San Diego, California. The study protocol was approved by UCSD’s Human Research Protections Program (#161618), was conducted according with Good Clinical Practice principles, and registered on ClinicalTrials.gov NCT03693040. Participants provided informed consent. Participants received IS-Truvada® for 12 weeks [15]; post-intervention participants underwent HIV testing and continued on PrEP prescribed by their practitioner.
Baseline laboratory evaluations were required within defined parameters (absolute neutrophil ≥1000/mm3; hemoglobin ≥9.0 g/dL; platelets ≥75 000/mm3; aspartate aminotransferase (AST), alanine aminotransferase (ALT), alkaline phosphatase ≤3 ULN; estimated GFR by Cockcroft-Gault >50 ml/min), repeated at study exit. Participants needed to be able to use mobile devices, willing to use the DHFS, and have no known skin adhesive hypersensitivity.
Baseline demographics, urine toxicology screening, and self-reported questionnaires, including adapted Habitual Self-Control [16], self-efficacy beliefs [17], depression scale (PHQ-8) [18], alcohol use (AUDIT) [19], drug use (DAST-10) [20, 21], Pittsburg Sleep Quality Index (PSQI) [22], and HIV Risk Perception [23], were collected. Participants’ persistence with DHFS and medication taking behavior were observed in their natural setting. Participants changed the monitor patch themselves as needed, and could view the medication ingestion log on their mobile device. Study staff counseled participants on wearing the patch and keeping their paired mobile device consistently charged.
Statistical Analysis
A 95% confidence interval (CI) for PDA was computed via 2-stage bootstrap, with participants sampled with replacement 10 000 times, and observations within participants sampled with replacement. The 95% CI included the middle 95% PDA values from the bootstrap distribution.
Persistent DHFS use was estimated using the Kaplan-Meier method. The day of participants’ DHFS discontinuation was documented by DHFS data transmission, not by participant’s last clinic visit, and was censored at week 12. Baseline demographic and clinical predictors of persistent use were examined by single- and multi-predictor Cox proportional hazards analyses. When 2 covariates were highly correlated only 1 was included, based on clinical relevance, to ease interpretation and avoid statistical artifacts. Here and in all analyses multi-predictor models used backward model selection (BMS), with a P < .20 threshold, starting with predictors significant at P < .20 in single- predictor models.
The primary endpoint was treatment adherence, defined as the proportion of IS-Truvada prescribed doses captured by DHFS, computed for each participant, and overall, for the study (with Student t test, 95% CI). Among participants with ≥28 days persistent use, we examined demographic and clinical predictors of treatment adherence. Within an intent-to-treat paradigm (ITT), all days without confirmed doses were considered failures. These failures conservatively included “data gap” days with no DHFS signal received, either physiological data or ingestion. We analyzed the daily DHFS confirmed doses via longitudinal mixed-effects logistic regression with within-subject correlation modeled via random intercepts. Single-predictor analyses included predictor of interest, random intercepts, and linear time trend. We reported subject-specific (conditional) odds ratios, 95% CI, and likelihood ratio test (LRT) P-values. Similar per-protocol longitudinal analyses were done, excluding days with withheld treatment or data gap. This analysis only included days when patch and tablets were fully functional and correctly utilized, and medication was available. Factors associated with participant-level ≥80% adherence were identified using logistic regression. The association between participants’ characteristics and the daily outcome of no data gap was examined using longitudinal mixed-effects logistic regression.
Dose timing, related to medication taking habit strength [24], was analyzed for consistency. Participant medication taking time was compared to the optimal recommended therapeutic window, defined as median medication time (hour) ±2 hours [25, 26]. (Two participants had a clear mid-study shift in median medication time; their treatment window was modified accordingly at the time of the shift.) The proportion of doses taken within treatment window was compared between participants with ≥80% and <80% adherence using independent samples t test. We tested whether days with no confirmed doses (both ITT and per protocol) and days with data gaps clustered together using a permutation test, with 1000 random permutations and two-sided P-value. The test statistic was the mean number of consecutive days with positive outcome for each participant, averaged over participants. All side effects, device and non-device related, were reported. All analyses used the R statistical environment [27].
RESULTS
Study Enrollment and Demographics
The study screened 83 persons, enrolling n = 71 (Figure 1). The participants had mean age of 37.6 years (range 18–69), were mostly male (90.1%), White (77.5%; 33.8% were Hispanic), housed (95.8%), and employed (74.6%). Baseline toxicology was positive in 40.6%, with 24.6% marijuana, 14.5% amphetamines, and 11.6% methamphetamines.
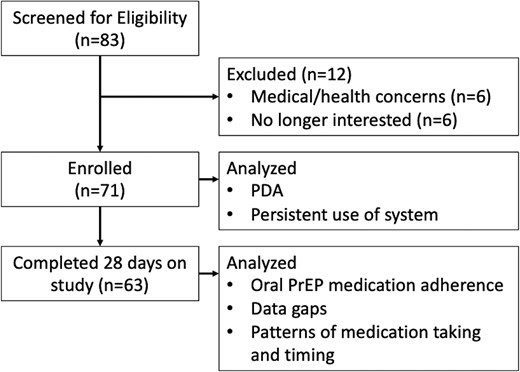
CONSORT diagram. Abbreviations: CONSORT, Consolidated Standards of Reporting Trials; PDA, positive detection accuracy; PrEP, pre-exposure prophylaxis.
Adverse Events
The DHFS was well tolerated, with no serious adverse events. Mild adverse events (all grade ≤2) occurred in 5.6% of participants related to the device (rash, blisters, and pruritus at patch site); 1 occurrence of patch related dermatitis led to study discontinuation.
Positive Detected Accuracy (PDA)
The 71 participants generated 267 confirmed doses from 280 ITT study visits, PDA 95.4% (91.8%, 98.2%); parentheses following effects indicate 95% CI throughout. Of 13 visits without confirmed dose, 11 reported special circumstances where medication was held (1) or DHFS was not properly used: patch not worn (4), removed post-ingestion (3), coming loose (1); tablet disconnected (1), or faulty (1). The PDA with these visits removed is 99.3% (97.2%, 100%).
Persistent Use of System
Persistent use among the 71 participants was 88.7% (81.7%, 96.4%) at week 4 and 66.2% (56.1%, 78.2%) at week 12 (Figure 2). Lower PHQ-8 score (less depressive symptoms) was associated with earlier dropout, HR = 0.866 (0.711, 0.990) per point, P = .032. Further analysis of predictors of participants who persisted for <28 days of DHFS use, showed less depressive symptoms (PHQ-8 mean 0.06 vs 4.15 P = .035) and better global sleep scores on PSQI, mean 6.21 vs 3.00, P = .026, compared to those with ≥28 days.
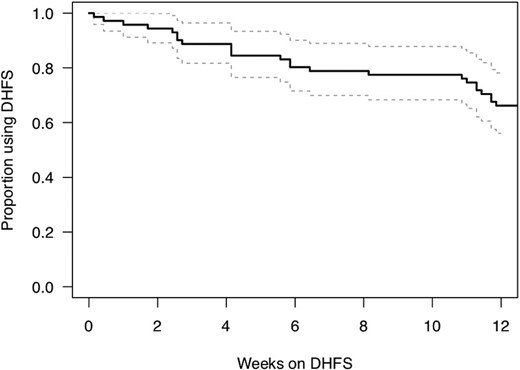
Kaplan-Maier estimated proportion of participants using the DHFS system over the study period. Abbreviation: DHFS, digital health feedback system.
Oral PrEP Medication Adherence
Sixty-three participants (88.7%) persisted with DHFS for ≥28 days, generating 4987 observation days, with an average 79.2 observation days (range 29–105). The total proportion of days with confirmed doses was 86.2% (82.5%, 89.4%).
In multi-predictor ITT analysis, the rate of confirmed doses decreased over time, OR (95% CI) 0.903 (.878, .929) per week, P < .001; better adherence was significantly associated with older age, OR 1.060 (1.033, 1.091) per year, P < .001; negative methamphetamine screen, OR 5.051 (2.252, 11.494), P < .001, and less depressed mood, OR 0.710 (.489, 1.028) per point, 4-point scale, P = .069 (trend level); see Table 1.
Factors Associated With Daily Confirmed Doses, Longitudinal Mixed-Effects Logistic Regression
| Variable | Single-predictor Model | Multi-predictor Model | ||
|---|---|---|---|---|
| OR (95% CI) | P Value | OR (95% CI) | P Value | |
| Age, per year | 1.065 (1.034, 1.098) | <.001 | 1.060 (1.033, 1.091) | <.001 |
| Female or transgender vs male | 1.750 (.528, 5.810) | .354 | ||
| Race/Ethnicity | .704 | |||
| ȃWhite, non-Hispanic | 1 (reference) | |||
| ȃBlack, non-Hispanic | 1.949 (.312, 12.659) | |||
| ȃAsian, non-Hispanic | 0.807 (.113, 5.624) | |||
| ȃHispanic | 0.866 (.298, 2.480) | |||
| Positive screen, any drugs | 0.478 (.237, .965) | .040 | ||
| Number of drugs | 0.589 (.432, .801) | .001 | ||
| Positive methamphetamine screen | 0.162 (.065, .397) | <.001 | 0.198 (.087, .444) | <.001 |
| Unemployed/retired/disabled | 0.879 (.401, 1.932) | .742 | ||
| Transient or homeless | 0.431 (.085, 2.201) | .305 | ||
| Global PSQI score, per point | 0.977 (.875, 1.091) | .670 | ||
| Self-efficacy, per point | 0.921 (.369, 2.321) | .857 | ||
| Habitual self-control, per point | 1.390 (.697, 2.811) | .343 | ||
| HIV risk perception (PRHS 8-item), per point | 1.010 (.952, 1.072) | .730 | ||
| PHQ-8 total, per point | 0.950 (.890, 1.014) | .118 | ||
| Depressed mood (4-level), per level | 0.696 (.446, 1.081) | .105 | 0.710 (.489, 1.028) | .069 |
| Cumulative time on study, per week | 0.899 (.876, .923) | <.001 | 0.903 (.878, .929) | <.001 |
Subject specific ORs and 95% CIs reported. Intent-to-treat analysis, all follow-up days included.
CIs and P values from likelihood ratio test. CIs for race/ethnicity are Bonferroni-corrected. Depressed mood from question 2 of PHQ-8.
Abbreviations: CI, confidence interval; HIV, human immunodeficiency virus; OR, odds ratio; PSQI, Pittsburg Sleep Quality Index.
In multi-predictor per-protocol longitudinal analyses, where data gaps and held doses were excluded, the rate of confirmed adherence decreased over time, OR 0.947 (.904, .991) per week, P = .019.
Worse confirmed adherence was associated with a higher proportion of data gap days, OR 0.964 (.942, .987) per % of days with data gap, P = .003. Factors associated with better confirmed adherence were older age, OR 1.035 (1.009, 1.065) per year, P = .009; no methamphetamine, OR 2.410 (1.166, 5.218), P = .019, see Table 2.
Per Protocol Analysis of Factors Associated with Daily Confirmed Doses, Longitudinal Mixed-Effects Logistic Regression
| Variable | Single-predictor Model | Multi-predictor Model | ||
|---|---|---|---|---|
| OR (95% CI) | P Value | OR (95% CI) | P Value | |
| Percent days with data gap, per point | 0.946 (.926, .965) | <.001 | 0.964 (.942, .987) | .003 |
| Age, per year | 1.054 (1.023, 1.088) | <.001 | 1.035 (1.009, 1.065) | .009 |
| Female or transgender vs male | 1.658 (.536, 5.471) | .379 | ||
| Race/Ethnicity | .336 | |||
| ȃWhite, non-Hispanic | 1 (reference) | |||
| ȃBlack, non-Hispanic | 2.017 (.376, 12.570) | |||
| ȃAsian, non-Hispanic | 0.544 (.099, 2.851) | |||
| ȃHispanic | 1.395 (.528, 3.668) | |||
| Positive screen, any drugs | 0.573 (.302, 1.095) | .090 | ||
| Number of drugs | 0.661 (.499, .872) | .004 | ||
| Positive methamphetamine screen | 0.226 (.100, .496) | <.001 | 0.415 (.195, .858) | .019 |
| Unemployed/retired/disabled | 0.997 (.485, 2.082) | .994 | ||
| Transient or homeless | 0.642 (.138, 3.222) | .577 | ||
| Global PSQI score, per point | 0.987 (.893, 1.093) | .798 | ||
| Self-efficacy, per point | 0.865 (.363, 2.055) | .736 | ||
| Habitual self-control, per point | 1.228 (.665, 2.300) | .504 | ||
| HIV risk perception (PRHS 8-item), per point | 1.022 (.969, 1.080) | .411 | ||
| PHQ-8 total, per point | 0.968 (.911, 1.027) | .268 | ||
| Depressed mood (4-level), per level | 0.834 (.550, 1.256) | .377 | ||
| Cumulative time on study, per week | 0.951 (.910, .994) | .027 | 0.947 (.904, .991) | .019 |
Subject-specific ORs and 95% CIs reported. Days when treatment was held or without digital health feedback system (DHFS) signal (data gap) are excluded from analysis for participants with ≥28 days on study.
Confidence intervals and P values from likelihood ratio test. Confidence intervals for race/ethnicity are Bonferroni-corrected. Depressed mood from question 2 of PHQ-8.
Abbreviations: CI, confidence interval; HIV, human immunodeficiency virus; OR, odds ratio; PSQI, Pittsburg Sleep Quality Index.
In multi-predictor analyses the probability of a DHFS signal (no data gap) decreased over the duration of the study, OR 0.861 (.832, .891) per week, P < .001. Higher odds of DHFS signal were associated with older age, OR 1.067 (1.030, 1.110) yearly, P < .001; negative methamphetamine screen, OR 4.484 (1.531, 13.889), P = .007; and less depressed mood, OR 0.627 (.378, 1.035) per level, P = .067 (trend level), see Supplementary Table 1.
An a priori individual-level adherence proportion of ≥80% confirmed doses was achieved by 79.4% of participants, CI95 (66.7%, 87.3%). The predictors associated with ≥80% confirmed doses in multi-predictor analyses are older age, OR 1.169 (1.055, 1.350), P = .001, fewer drugs in drug screen, OR 0.337 (.122, .777) per drug, P = .010, and less depressed mood, OR 0.389 (.131, 1.027) per level, P = .056 (trend level), see Supplementary Table 2.
Patterns of Medication Taking and Timing
Figure 3 provides comparative visual information across participants, allowing rapid understanding of medication adherence and identification of participants below the a priori ‘adherence threshold’ where prophylactic failure may occur. We found evidence of clustering of both days without confirmed doses when DHFS physiological signal was received (P = .003), and of days with data gap when no physiological signal was received (P < .001).
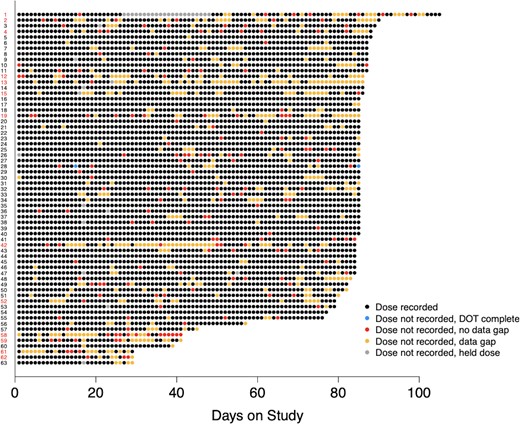
Dot plot displays pattern of daily confirmed ingestions for the study participants who persisted on the system for ≥4 weeks (n = 63). Participant labels (y-axis) are in red for individual participants with <80% confirmed doses (n = 13), and in black for individual participants with ≥80% confirmed doses (n = 50). Individual observation days are color coded according to the legend.
Figure 4 provides examples of individual participant dose timing. Analysis of dose timing (preferred time ±2 hours) found a higher proportion of doses taken within treatment window for participants with ≥80%, 0.828 (.796, .859) vs 0.542 (.405, .679), for those with <80% confirmed doses, P < .001 (Figure 5).
![Online platform displays time and date of IS-Truvada® ingestions; examples of contrast in dose timing patterns by 2 participants are shown here. The participant in the top panel demonstrates erratic dose timing, in contrast to the participant trace in the bottom panel which is highly regular [14].](https://oup.silverchair-cdn.com/oup/backfile/Content_public/Journal/cid/76/1/10.1093_cid_ciac280/7/m_ciac280f4.jpeg?Expires=1750767706&Signature=kFdq20HY8iGSyW2NC9ImqIIn65mydoZTaBK3tSTVBAn2mzzFP2EVydFfVkqkP1VZBuEO41iTm~Isi~ZL5XV-z7R5qJtxwhmNveRqq8c3WptBNm3aSjYrLexrtjajlt7g5I0wwIc8rTWDRrZrU0Vd4UASTJOqyzbvI1VTaB4Cb7iekylIN5KHHMfBRYDUyT02HIK2F3DGP4fvoqC5GQ3dEAW65Qa9lXlQLxbvMM60nlZZf4RWXIfsVInBg5XcW2Atz5VsSRfASK4WVT2vZFTBeqiEg4Ec72WefkF7-0h1nMNYG-routCPHbw-gd9aAoX83lI2fIgK2Ghd5yJ-g60zew__&Key-Pair-Id=APKAIE5G5CRDK6RD3PGA)
Online platform displays time and date of IS-Truvada® ingestions; examples of contrast in dose timing patterns by 2 participants are shown here. The participant in the top panel demonstrates erratic dose timing, in contrast to the participant trace in the bottom panel which is highly regular [14].
![Proportion of doses taken within 2 hours of the participant’s medication time, for participants with high (≥80%) and low (<80%) proportion of confirmed doses [14].](https://oup.silverchair-cdn.com/oup/backfile/Content_public/Journal/cid/76/1/10.1093_cid_ciac280/7/m_ciac280f5.jpeg?Expires=1750767706&Signature=fSibftnD~5KxycQGYcOORJou5pn4u1idQc9nIMcuLeeibmqKYDUlCCQTYCcYy2x9BfRfU61-zBUDP4Q4nz78Vb9~dJIIKyBT36caOk1SFzgvEPcw1EObHG~aL~Sn3yw-CfYfnL7AQlA3W2hUhD44MwM-XJ74f5anemQQVUvcCFcpkovx~hrJA3mS51zWTcuukR6Bmu-M8L2xWxdKFECaL8i1BCdv-FLMCcTNOu8z~kB386JkpO9xMN~cTdlLpOa-wXWyIfFIDU1CliWik7tX0uhPVbEpG8LX106FXe3-P7HVESyGzm2MhumIZou1sslC-uVAmzYAUSoPWZNf~Am2kA__&Key-Pair-Id=APKAIE5G5CRDK6RD3PGA)
Proportion of doses taken within 2 hours of the participant’s medication time, for participants with high (≥80%) and low (<80%) proportion of confirmed doses [14].
The day of the week was not significantly associated with confirmed doses (ITT and per protocol analyses P = .25 and P = .106, respectively). However, the day of the week was significantly associated with no data gap, P = .025, with the highest odds of signal on workdays Monday–Friday (OR 1.510–1.853 vs Sunday) and lowest on weekends (Saturday OR = 1.193 vs Sunday).
DISCUSSION
Our study confirmed that the DHFS provided valid measures of PrEP ingestion with 99.3% (97.2, 100%) accuracy versus direct observation when used as prescribed. This finding is identical to prior reports in TB treatment [13]. The persistence of DHFS use was approximately 90% at one month, dropping to 66% at 12 weeks. This finding is in contrast to prior clinical trials in tuberculosis (TB) and hepatitis C (Hep C) treatment, which reported DHFS persistence of 100% at 20 weeks and 92.6% for 8–12 weeks [12, 13], respectively. Both of these trials included medication adherence support interventions, which may account for the higher persistence of use in these studies [28, 29]. Alternatively, DHFS persistence could differ across patient populations and/or in prophylaxis vs treatment. Adverse events were few, mild, and involved skin reactions to the patch, similar to other studies [11–13].
Although overall ≥80% of prescribed doses were taken, longitudinal analyses confirmed adherence decreased over time, by 5–10% weekly (ITT and per protocol respectively), similar to other studies [30–32]. Individual variation was marked, with 20% of participants below an individual a priori threshold of 80% confirmed ingestions.
Consistent participant characteristics associated with higher confirmed medication adherence across analyses were: older age, absence of drugs, particularly methamphetamine on urine toxicology screening, and lower depressive symptoms. Multiple studies have associated increasing age with higher oral PrEP adherence [33–35]. Prior findings involving substance use and PrEP adherence have varied [36–39]. However, most studies employing measures of drug use and adherence other than self-report have reported methamphetamine use correlated with lower PrEP adherence. Similarly, prior studies have found an inverse relationship between depressive symptoms and PrEP adherence [40, 41]. Thus, using rigorous measures (ingestible sensor technology, urine toxicology screening, validated questionnaires) our study confirms a combination of predictors of oral PrEP adherence reported individually in prior studies.
The consistency of participant predictors of medication adherence we found also reinforces the validity of our analyses. Our individual a priori threshold of ≥80% confirmed ingestions successfully identified participant characteristics captured by the longitudinal analyses, which in turn remained consistent whether technology use was accounted for or not.
Although ingestible sensor technology is highly accurate, the role of adherence to technology itself on the measurement of medication taking is difficult to quantify. As mentioned, the patch technology also captures physiological measures including HR, rest and activity. Our detailed analyses of periods when no signal from the technology was received show that these “data gaps” have a highly significant correlation with and the same predictors as reduced confirmed medication adherence. This suggests that data gaps are surrogates for lapses in medication adherence.
DHFS data provided detailed visual patterns of individual medication taking and timing across participants (Figures 3 and 4). Analysis showed that days without confirmed adherence clustered together significantly, as did days without technology use. This finding provides evidence for testing real-time interventions to support medication taking as medication doses were significantly likely to be missed on successive days. We found no patterns of “event driven” oral.
PrEP use in this cohort, but did find an interesting association with “data gaps” on weekends. Strength of habit around oral medication taking has previously been shown to predict dose timing [24]. Our findings support this and clearly indicate participant variability around dose timing was associated with differences in confirmed medication adherence.
Implications for Clinical Use and Assessment
The extremely high DHFS accuracy to identify IS-Truvada ingestion, identical to prior rigorous evaluation [13], implies that should clinician and patient desire periods of confirmed oral PrEP, DHFS technology used as prescribed is equivalent to directly observed therapy. In expanded real-world PrEP implementation such periods may be useful to ensure adequate drug exposure prior to initiation or post-discontinuation of LAI PrEP in some individuals, to support continued prophylactic success. Our current findings regarding DHFS persistence suggest this technology would be best for short-term use in this population, such as on initiation of oral PrEP, to provide greater understanding of individual patient behaviors, or, instances where patient conversion to/from injectable PrEP formulations would benefit from DOT. The participant characteristics associated with better confirmed PrEP adherence in this and other studies suggests untreated substance use and depressive symptoms may threaten the success of oral PrEP.
The ability of the technology to capture individual daily behavior patterns in real-time while measuring medication adherence has multiple implications for clinical practice and distinct advantages over cumulative adherence measures, such as dried blood spots and hair analysis. Color coded visualizations of DHFS data, including a defined at-risk threshold, may allow healthcare providers to quickly identify which patients to contact to prevent prophylactic failure. Crucially, patient and physician can examine these patterns together. The information may empower patients towards deeper self-insight and allow healthy discussion with their physicians around events linked to missed doses or periods of high adherence. Physicians can explore whether patients’ modifiable logistical issues, attitudes, and beliefs toward medication or comorbidities are influencing adherence. Accurate, detailed, and easily understood data may engender honest, compassionate discussions that promote trust, supporting the therapeutic relationship.
Study Limitations
This single-arm study aimed to evaluate DHFS use characteristics, capabilities to measure and capture patterns of medication taking, of persons taking oral PrEP. Thus, although the technology may facilitate intensive real-time adherence support, further research is necessary to design and evaluate adherence support interventions incorporating the DHFS in this patient population. As study demographics captured MSM of broad age range and race/ethnicity findings are generalizable to MSM but not to other PrEP populations. Whereas study duration was limited to 3 months, however, reports on oral PrEP use indicate 30–50% persistence at 1 year, with decline noted particularly in younger aged patients by 3 months post initiation, and median persistence, even amongst the highest persistence group, of less than 2 years [42]. Editorial Comment in this Journal has recommended the adoption of a “life course” treatment perspective [43] which understands individual patients, their changing needs and focuses on trust within the therapeutic relationship.
Conclusions
The DHFS was highly accurate and captured individual daily behavior patterns in real-time while measuring medication adherence. It distinguished persons with a strong daily habit of medication taking and high oral PrEP adherence from those potentially at risk of PrEP failure. This individualized behavioral information may empower patients and create opportunities for honest, compassionate discussions that support the therapeutic relationship and allow physicians to be servants of their art, and guides to successful provision of PrEP over time.
Supplementary Data
Supplementary materials are available at Clinical Infectious Diseases online. Consisting of data provided by the authors to benefit the reader, the posted materials are not copyedited and are the sole responsibility of the authors, so questions or comments should be addressed to the corresponding author.
Notes
Financial support. This work was supported by the US National Institutes of Health (NIH) through an R01 grant from National Institute of Mental Health (grant number MH110057, awarded to S. H. B. and C. A. B.).
Additional support was provided by the non-profit Specialists in Global Health. The Study medication was kindly provided by Gilead Sciences, Inc.
References
Author notes
Potential conflicts of interest. C. A. B. serves as an expert consultant for NDA Partners, Inc. C. A. B. is the Director of the UCSD Anti-viral Research Center (AVRC) and receives grant/contract support from Gilead for the conduct of a clinical trial (paid to institution). C. A. B. holds a leadership or fiduciary role on CROI Foundation Board and IAS-USA Board, both unpaid. T. F. B. serves as a member of the Board of Directors of Durect Corporation (Cupertino, California), as a scientific advisor to the Guthy Jackson Charitable Foundation (Beverly Hills, California, USA), and as an education advisor to UCSF-Stanford Center of Excellence in Regulatory Science and Innovation (CERSI). T. F. B. also serves or has served as an expert consultant for NDA Partners, LLC., Merck, and for the Bill and Melinda Gates Foundation. A. J. T. serves as an expert consultant for RAND bioPartners, Inc. A. U. reports payment as Lecturer for University of California of San Diego (01/2020–06/2020; 01/2021–06/2021; 01/2022–03/2022). F. L. and S. H. B. report contracts or grants unrelated to this work from the NIH (NIH grant number R01MH110057; UCSD (Sara Browne, PI)). All the above authors state that none of these activities represent any conflicts or competing interests relevant to this research effort. All other authors report no potential conflicts.
All authors have submitted the ICMJE Form for Disclosure of Potential Conflicts of Interest. Conflicts that the editors consider relevant to the content of the manuscript have been disclosed.

