


Abstract
For patients coinfected with hepatitis C virus (HCV) and hepatitis B virus (HBV), HCV treatment with direct-acting antivirals can lead to HBV reactivation. We evaluated HBV reactivation during ledipasvir/sofosbuvir treatment and 108-week follow-up.
In Taiwan, 111 patients with HCV genotype 1 or 2 and HBV received ledipasvir/sofosbuvir (90mg/400mg) once daily for 12 weeks. HBV virologic reactivation was defined as postbaseline increase in HBV DNA from either less than the lower limit of quantification (LLOQ, 20 IU/mL) to equal to or more than LLOQ or equal to or more than LLOQ to >1 log10 IU/mL. HBV clinical reactivation was HBV virologic reactivation with alanine aminotransferase (ALT) >2× upper limit of normal. Factors associated with development of HBV virologic or clinical reactivation were evaluated with logistic regression analysis.
All patients (100%, 111/111) maintained HCV suppression through 108 weeks after treatment. HBV virologic reactivation occurred in 73% of patients (81/111). Clinical reactivation occurred in 9% (10/111). The majority of HBV virologic reactivations (86%, 70/81) occurred by follow-up week 12, whereas clinical reactivation was generally more delayed. Eight (7%, 8/111) initiated HBV therapy. In regression analyses, baseline HBV DNA and hepatitis B surface antigen (HBsAg) levels were associated with HBV virologic reactivation and baseline ALT and HBV DNA, and HBsAg levels were associated with HBV clinical reactivation.
Among HCV/HBV coinfected patients treated with direct-acting antivirals for HCV, HBV virologic reactivation occurred in a majority of patients during treatment and follow-up. In most patients, HBV virologic reactivation was asymptomatic; only a small proportion initiated HBV treatment. Notably, clinical reactivation may still occur >3 months after end of therapy.
NCT02613871.
INTRODUCTION
Patients chronically infected with both the hepatitis B virus (HBV) and the hepatitis C virus (HCV) have a greater risk of cirrhosis, liver decompensation, and hepatocellular carcinoma (HCC) than patients infected with either virus alone [1–5]. In many coinfected patients, the HCV infection is dominant, suppressing replication of HBV to low levels [6]; thus, curing patients of HCV infection can create a favorable environment for increased HBV replication. HBV reactivation has been reported during and after treatment of coinfected patients with peginterferon and ribavirin, or drugs that directly target HCV [7–14]. Data suggest that patients who are positive for hepatitis B surface antigen (HBsAg) are at risk of reactivation. These observations have led to the recommendation that patients undergo HBV testing before initiation of HCV therapy [15–19]. Of note, the US Food and Drug Administration has mandated the addition of a boxed warning to this effect in the label of all direct-acting antiviral (DAA) agents.
In our previous report, the risk of HBV reactivation among HCV/HBV coinfected patients who undergo HCV treatment was investigated [20]. This phase 3b open-label study evaluated the efficacy and safety of ledipasvir/sofosbuvir (LED/SOF) for 12 weeks for the treatment of HCV genotype 1 or 2 in 111 Taiwanese patients coinfected with HBV. We found that 100% of patients achieved a sustained virologic response (SVR). Of the 37 patients with baseline HBV DNA <20 IU/mL, 31 (84%) had at least 1 episode of quantifiable HBV DNA through posttreatment week 12. Of the 74 patients with baseline HBV DNA levels of 20 IU/mL or more, 39 (53%) had increases of HBV DNA greater than 1 log10 IU/mL through posttreatment week 12. Although most patients had an increase in level of HBV DNA, no patient experienced associated adverse events.
The durability of SVR following DAA therapy and risk of delayed HBV reactivation is unknown. Similarly, although transient declines in HBsAg were reported in a study of 12 patients with HBV/HCV coinfection [20], the dynamics of HBsAg need to be validated further. We thus followed this cohort of 111 patients for 108 weeks after the end of the DAA therapy.
METHODS
Study Design and Patients
In this multicenter, open-label trial, eligible patients were 20 years of age or older with chronic infection with HCV genotype 1 or 2 and HBV. Chronic HCV was documented by prior medical history or liver biopsy, and chronic HBV was documented through medical records or via positivity for HBsAg or HBV DNA for at least 6 months. Patients with compensated cirrhosis were included in the study. Major ineligibility criteria were receipt of HBV treatment within the prior 6 months, clinical evidence of hepatic decompensation, or presence of HCC. Full eligibility criteria are provided in the protocol. All patients provided written informed consent.
Patients received a fixed-dose combination tablet of LED/SOF, 90/400mg, administered orally once daily for 12 weeks. Patients were followed for 108 weeks after treatment.
The study protocol was approved by the ethics committee of each institution before study initiation. The study was conducted in accordance with the International Conference on Harmonisation Good Clinical Practice Guidelines and the Declaration of Helsinki. All authors had access to the study data and reviewed and approved the final manuscript.
Assessments
Screening assessments included measurement of serum HCV RNA, HBV DNA, and HBV serology (HBsAg, hepatitis B surface antibody, hepatitis B e antigen [HBeAg], and hepatitis B e antibody), in addition to IL28B genotyping and standard laboratory testing. Serum HCV RNA was measured using the COBAS AmpliPrep/COBAS TaqMan HCV Quantitative Test, version 2.0 (Roche Molecular Systems, Pleasanton, CA), with a lower limit of quantification (LLOQ) of 15 IU/mL. HCV genotype and subtype were determined with the VERSANT HCV Genotype INNO-LiPA 2.0 assay (Siemens, Munich, Germany). HBV and IL28B genotyping were performed using polymerase chain reaction amplification followed by sequencing, with LLOQ 69 IU/mL. Serum HBV DNA was measured using the COBAS AmpliPrep/COBAS TaqMan HBV Quantitative Test, version 2.0 (Roche Molecular Systems), with LLOQ 20 IU/mL. Serum HBsAg was analyzed by Abbott ARCHITECT i2000SR with LLOQ = 0.05 IU/mL.
During and after treatment, assessments included standard laboratory testing, serum HCV RNA level, HBV DNA, HBV serology, HBsAg level, vital signs, electrocardiography, physical examination, and collection of adverse events. Assessment schedules were described previously [20].
Endpoints
The primary efficacy endpoint of the study was achievement of SVR12, defined as having HCV RNA <LLOQ 12 weeks after discontinuing study drug [20]. In this posttreatment week 108 analysis, in addition to sustained HCV virologic response, 3 additional endpoints were evaluated: HBV virologic reactivation, HBV clinical reactivation, and reactivation meeting local criteria for initiating HBV treatment. HBV virologic reactivation was defined as either baseline below LLOQ to postbaseline equal to or above LLOQ or baseline equal to or above LLOQ to >1 log10 increase IU/mL. HBV clinical reactivation was defined as HBV reactivation with alanine aminotransferase (ALT) >2 × upper limit of normal (ULN; 43 U/L in men and 34 U/L in women) at the same time. Local criteria for initiating HBV treatment were as follows: (1) for baseline HBeAg-positive patients, postbaseline HBV DNA ≥20000 IU/mL, and ALT ≥2 × ULN at the same visit; (2) for baseline HBeAg-negative patients, postbaseline HBV DNA ≥2000 IU/mL and ALT ≥2 × ULN at the same visit; and (3) for patients with cirrhosis, baseline HBeAg negative with postbaseline HBV DNA ≥2000 IU/mL at any visit.
Statistical Analyses
Logistic regression analysis was used to evaluate the following factors in association with development of the 3 additional reactivation endpoints: age, sex (male vs female), baseline body mass index, cirrhosis status at baseline (absent vs present), prior treatment for HCV (naive vs experienced), IL28B genotype (CC vs CT), baseline ALT level, baseline HBV DNA level, baseline HBsAg level, baseline HCV RNA level, time to HCV RNA <LLOQ, HBV genotype, and time to HBV reactivation. For categorical variables, P values were obtained using exact logistic regression. For continuous variables, P values were obtained using logistic regression. The risk factor with the smallest P value < .05 in the univariate model was the selected risk factor for the bivariate analysis. The risk factors with the smallest P value < .05 in the bivariate model were the selected risk factors for the multivariate analysis.
RESULTS
Patients
From January 11 through July 22, 2016, 111 patients were enrolled at 14 centers in Taiwan. The mean age of patients was 55 years (range, 32–76 years), and a majority (61%, 68/111) had HCV genotype 1 infection. Eighteen patients (16%) had cirrhosis at baseline [19]. Mean ALT was 68 U/mL (range, 17–281 U/mL). All patients were HBsAg positive at screening; between the screening and baseline visit, 1 patient became HBsAg negative. One patient (<1%) was HBeAg positive. Eighty-six percent of patients (79/111) had HBV genotype B. At baseline, mean HBV DNA was 2.1 log10 IU/mL (range, 1.3–5.8), and one-third of patients (33%, 37/111) had HBV DNA <LLOQ.
All 111 patients completed treatment; 108 patients completed follow-up visits through 108 weeks after treatment. Of the remaining 3 patients, 1 withdrew consent after achieving SVR12 and 2 died after achieving SVR12.
Safety
No patients discontinued treatment because of an adverse event. Through 108 weeks after treatment, all grade 3–4 adverse events (n = 1, optic neuritis) and serious adverse events (n = 4, optic neuritis, postpolypectomy hemorrhage, duodenal ulcer, and meniscus injury) were assessed by the investigator to be unrelated to LED/SOF. One grade 3–4 laboratory abnormality was reported: a man aged 44 years had transient, asymptomatic grade 4 lipase elevation at week 4 of treatment. For the 2 cases of death, each occurred more than 72 weeks after treatment cessation, and causes were brain injury and traumatic shock.
No patients experienced jaundice, liver decompensation, liver failure, or liver transplant.
HCV Virologic Response
All 111 patients who initiated treatment achieved SVR12. At 108 weeks after treatment, the rate of SVR was 100% (108/108), with no cases of HCV virologic relapse.
HBV Virologic and Clinical Reactivation
Throughout treatment and 108 weeks of follow-up, HBV virologic reactivation occurred in 73% of patients (81/111) (Table 1). A greater proportion of patients with virologic reactivation had HBV DNA <LLOQ at baseline than those who did not have reactivation (41% vs 13%) (Table 2). Clinical reactivation occurred in 9% of participants (10/111), with similar percentages having baseline HBV DNA <LLOQ (8%, 3/37) vs ≥LLOQ (10%, 7/74).
Hepatitis B Virologic and Clinical Reactivation
| Baseline HBV DNA | |||
|---|---|---|---|
| <LLOQ n = 37 | ≥LLOQ n = 74 | Overall N = 111 | |
| HBV virologic reactivation (increase to ≥LLOQ or >1 log10 IU/ML increase) | 33 (89) | 48 (65) | 81 (73) |
| Clinical reactivation (HBV reactivation + ALT> 2 × ULN)a | 3 (8) | 7 (10) | 10 (9) |
| Baseline HBV DNA | |||
|---|---|---|---|
| <LLOQ n = 37 | ≥LLOQ n = 74 | Overall N = 111 | |
| HBV virologic reactivation (increase to ≥LLOQ or >1 log10 IU/ML increase) | 33 (89) | 48 (65) | 81 (73) |
| Clinical reactivation (HBV reactivation + ALT> 2 × ULN)a | 3 (8) | 7 (10) | 10 (9) |
ALT, alanine aminotransferase; HBV, hepatitis B virus; LLOQ, lower limit of quantification; ULN, upper limit of normal.
ULN, 34 IU/mL for women and 43 IU/mL for men.
Demographics and Baseline Characteristics of Patients With and Without Hepatitis B Virologic Reactivation
| Hepatitis B Reactivation | ||
|---|---|---|
| Yes (n = 81) | No (n = 30) | |
| Mean (range) age, y | 55 (36–76) | 55 (32–70) |
| Male, n (%) | 30 (37) | 12 (40) |
| Mean (range) BMI, kg/m2 | 25 (17–34) | 24 (19–34) |
| Cirrhosis, n (%) | 14 (17) | 4 (13) |
| Mean (range) ALT, U/L | 73 (17–228) | 54 (17–281) |
| HCV | ||
| Genotype 1, n (%) | 52 (64) | 16 (53) |
| Genotype 2, n (%) | 29 (36) | 14 (47) |
| Mean (range) HCV RNA, log10 IU/mL | 5.8 (4.2–7.1) | 6.0 (3.8–6.9) |
| HCV treatment experienced, n (%) | 30 (37) | 7 (23) |
| IL-28B CC, n (%) | 59 (73) | 26 (87) |
| HBV | ||
| Genotype B, n (%) | 58 (85) | 21 (87) |
| Genotype C, n (%) | 9 (13) | 3 (13) |
| Mean (range) HBV DNA, log10 IU/mL | 1.9 (1.3–5.5) | 2.5 (1.3–5.8) |
| HBV DNA <LLOQ, n (%) | 33 (41) | 4 (13) |
| HBsAg positive, n (%) | 80 (99) | 30 (100) |
| Mean (range) HBsAg, IU/mL | 554 (0–5435) | 646 (0.1–6777) |
| HBeAg positive, n (%) | 1 (1) | 0 |
| HBV treatment experienced, n (%) | 5 (6) | 0 |
ALT, alanine aminotransferase; BMI, body mass index; HBeAg, hepatitis B e antigen; HBsAg, hepatitis B s antigen; HBV, hepatitis B virus; HCV, hepatitis C virus; LLOQ, lower limit of quantification.
The majority of cases of HBV virologic reactivation occurred during the period encompassing treatment and week 12 of follow-up; by follow-up week 12, 70 patients (63%) had HBV reactivation (Figure 1). One-quarter of patients (28/111) had HBV virologic reactivation by week 4 of treatment. The virologic reactivation was transient in 7.4% (6/81). The occurrence of clinical reactivation was generally more delayed relative to HBV virologic reactivation (Figure 1). Of the 10 patients who experienced clinical reactivation, 5 patients did so by week 12 of follow-up, and 4 did so through weeks 12–48 of follow-up.
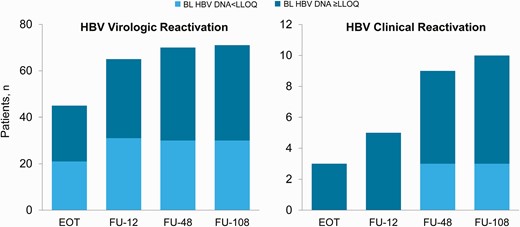
Timing of hepatitis B virologic and clinical reactivation. EOT, end of treatment; FU, follow-up.
To demonstrate the independent profile of serum HBV DNA before the treatment of DAA, we retrospectively collected virologic data from 17 enrolled patients. Their HBV DNA profiles are shown in Supplementary Table 1. Briefly, the pretreatment serum HBV DNA levels remained stationary, suggesting that the change of serum HBV DNA level after start of DAA therapy was not from the fluctuating nature of the HBV DNA levels.
In a univariate analysis, higher baseline HBV DNA (mean baseline HBV DNA 1.92 log10 IU/mL vs 2.54 log10 IU/mL, P = .04) was associated with HBV virologic reactivation. Bivariate analyses with baseline HBV DNA as the selected risk factor found that baseline HBsAg levels was associated with HBV virologic reactivation (P = .003). Higher baseline ALT was found to be associated with HBV clinical reactivation in a univariate analysis (mean baseline ALT 132 U/L vs 61 U/L, P = .001). Bivariate analyses with baseline ALT as the selected risk factor found that baseline HBV DNA (P = .025) and baseline HBsAg (P = .029) were significant factors for HBV clinical reactivation.
Fourteen patients had HBV virologic reactivation and met local criteria for treatment. Among these patients, mean baseline ALT was 121 U/L (range, 32–228), mean baseline HBV DNA was 2.3 log10 IU/mL (range, 1.3–5.5), none were HBV treatment experienced, and 4 (29%) had HBV DNA <LLOQ at baseline. Eight patients (7% of study population) initiated HBV therapy during the study. The median time to initiation of HBV therapy from baseline was 70 weeks (range, 10–99 weeks)
Baseline ALT level, baseline HBsAg level, and time to first HCV RNA <LLOQ were associated with HBV reactivation with meeting local criteria for treatment in both univariate and multivariate analyses (Table 3).
Factors Associated With HBV Clinical Reactivation That Met Local Treatment Criteria
| Odds Ratio (95% CI) | P Value | |
|---|---|---|
| Baseline ALT level | 1.02 (1.01, 1.03) | <.001 |
| Baseline HBsAg level | 2.32 (1.10, 4.88) | .018 |
| Time to first HCV RNA <LLOQ | 1.11 (1.02, 1.21) | .003 |
| Odds Ratio (95% CI) | P Value | |
|---|---|---|
| Baseline ALT level | 1.02 (1.01, 1.03) | <.001 |
| Baseline HBsAg level | 2.32 (1.10, 4.88) | .018 |
| Time to first HCV RNA <LLOQ | 1.11 (1.02, 1.21) | .003 |
ALT, alanine aminotransferase; CI, confidence interval; HBsAg, hepatitis B surface antigen; HBV, hepatitis B virus; LLOQ, lower limit of quantification.
Kinetics and Interactions of Serum HBV DNA and HBsAg
Theoretically, HCV DAA therapy has no direct effect on the replication of HBV. Unexpectedly, we found that serum HBsAg and HBV DNA kinetics during treatment were found to be inversely correlated (−0.09, P = .04) (Figure 2). However, no difference in HBsAg kinetics was observed among patients with or without HBV virologic reactivation.
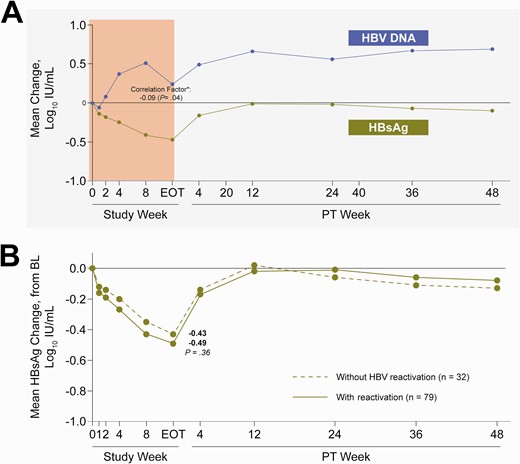
Kinetics of HBsAg during and 48 weeks after end of DAA. A, Mean change in HBV DNA and HBsAg from baseline. P value was determined using Spearman correlation. ∗Spearman correlation factor between HBsAg change and HBV DNA change during treatment. B, HBsAg change in patients with or without HBV reactivation. P value was determined using the Wilcoxon 2-sample test. DAA, direct-acting antiviral; HBsAg, hepatitis B surface antigen; HBV, hepatitis B virus.
Overall, 45% (50/111) patients had HBsAg decline ≥0.5 log10 at least at 1 time point through posttreatment week 48; 84% (42/50) occurred for the first time during the treatment period, and the remaining 16% (8/50) occurred for the first time during the posttreatment follow-up period. In a multivariate analysis, no factor was identified to be associated with HBsAg decline ≥0.5 log10 (factors for selection: age, gender, baseline body mass index, cirrhosis status at baseline, prior treatment for HCV, IL28B genotype, HBV genotype, baseline ALT [U/L], baseline HBV DNA [log10 IU/mL], HBV DNA reactivation, baseline HBsAg level [log10 IU/mL], baseline HCV RNA [log10 IU/mL], and time to first HCV RNA <LLOQ).
Furthermore, 5 patients (5/101, 5%) lost HBsAg during the posttreatment 48-week follow-up period, and 9 patients (9/98, 9%) lost HBsAg during the posttreatment 108-week follow-up period. The clinical features of the 5 patients who lost HBsAg during the posttreatment 48 weeks are shown in Supplementary Table 2. Using serum HBsAg <10 IU/mL as a cutoff, the prediction value of HBsAg seroclearance was as follows: sensitivity, 100%; specificity, 81.13%; positive predictive value, 20%; negative predictive value, 100%; area under the receiver operating characteristic curve, 0.9057.
One patient developed HBsAg seroconversion. In a multivariate model, low HBsAg level at baseline was associated with HBsAg loss.
DISCUSSION
In this trial, treatment with LED/SOF for 12 weeks in patients with HCV/HBV coinfection resulted in an SVR12 rate of 100%; and the SVR was durable in all patients through 108 weeks of posttreatment follow-up. Although the majority of patients (73%) met the criteria for HBV virologic reactivation, no patients developed any related clinical symptoms. The reactivation event occurred most commonly during the treatment period and by week 12 of posttreatment follow-up. Our data suggested that the availability of DAA-based anti-HCV therapy increases the rate of HCV clearance with a better safety profile and fills the unmet gap for those coinfected patients. This follow-up study consistently demonstrated that post-DAA HCV SVR was well maintained.
Reactivation of HBV activity is an important clinical concern in coinfected patients receiving anti-HCV therapy [8–11, 16–19]. HBV reactivation can occur through removal or attenuation of anti-HBV immunity: rituximab by B-cell depletion, steroid-containing or steroid-free chemotherapies by a global immune suppression (T cells depletion mainly), and biologics (for example, anti-tumor necrosis factor alpha) by anticytokines [21]. The mechanism for post-DAA HBV reactivation is unknown but may be due to attenuation of interferon-related immune responses after the start of DAA therapy [22, 23]. To address this issue, a study in cooperation with the National Institutes of Health found that in HCV and HBV coinfected cell culture and humanized mice, HBV replication was suppressed by HCV coinfection [14]. In vitro, HBV suppression was attenuated when interferon signaling was blocked. In vivo, after initial suppression by HCV superinfection, HBV viremia rebounded following HCV clearance by DAA treatment that was accompanied by a reduced hepatic interferon response. These findings may partially explain the high HBV virologic reactivation rate soon after the start of DAA for HCV infection.
A recent paper addressed the kinetics of HBsAg and the risk/outcomes of HBV reactivation in a real-world clinical observatory setting enrolling 79 HCV/HBV coinfected patients [25]. They similarly found: (1) HBsAg levels declined during DAA therapy and rebounded after the end of DAA therapy; (2) a small proportion of patients (8 patients, 10%) lost HBsAg during follow-up; and (3) cumulative risk of HBV reactivation was 40% at the 12th month. Additionally, baseline HBsAg level >10 IU/mL predicted the development of HBV reactivation and was associated with a lower chance of HBsAg seroclearance. In comparison, our case number was large, and the follow-up duration was universally extended to 108 weeks after DAA therapy. Notably, we demonstrated that if the development of virologic and clinical reactivation was closely monitored and promptly managed, the risk of developing severe clinical reactivation or hepatic failure would be low.
Our study demonstrated that early HBV virologic reactivation is usually quickly suppressed by noncytolytic immune responses (without ALT flare); but can be subsequently followed by cytolytic immune responses with resultant clinical reactivation in 12% of the patients. We found that baseline ALT level, baseline HBsAg level, and time to first HCV RNA <LLOQ were associated with HBV reactivation with meeting local criteria for treatment in both univariate and multivariate analyses. These simple parameters may be used to identify patients at risk of reactivation that may be eligible for anti-HBV therapy.
In general, DAA therapies approved for chronic HCV treatment are not expected to have any activity against HBV infection. Therefore, decline or seroconversion of HBsAg is not likely to occur during treatment or after cure of HCV. However, in this study, we observed an unexpected mean decline in serum HBsAg levels during the 12-week treatment period with LED/SOF. This decline in serum HBsAg was not associated with a similar change in serum HBV DNA levels nor with the development of HBV virologic reactivation. It is unknown if the decline in HBsAg observed was a direct effect related to LED/SOF treatment or driven by a change in host immunity that has been shown to be associated with the clearance of HCV infection [26, 27]. Alternatively, we propose a hypothesis to explain the dissociation between HBV DNA rebound and HBsAg dip. Clinically, an increase of serum HBV DNA level will occur in parallel with the increase of the serum HBsAg level in patients with HBeAg-positive HBV infection and active covalently closed circular DNA (cccDNA) activity. However, in patients with background low cccDNA activity (for example, inactive HBeAg-negative infection), the production of HBV DNA may not be linear to the production of HBsAg. Origin of HBV DNA production can be different from that of HBsAg production in these background low cccDNA activity situations. HBV reactivation usually comes from reactivating cccDNA. In contrast, serum HBsAg can be derived from both cccDNA and the integrated HBV subgenome [24]. Among patients with HCV/HBV coinfection, the HBV DNA levels are generally low, indicating background low cccDNA activity. Thus, the HBsAg may be mainly derived from integrated HBV subgenome. During control of HCV replication, host immunity or liver microenvironment may change. We speculate that the change of host immunity or liver microenvironment may have different effects on production of HBV DNA vs production of HBsAg, leading to activation of residual cccDNA but suppression of integrated HBV subgenome transcription. This phenomenon might explain the discrepancy between HBsAg dip and HBV DNA increase. Our speculation needs to be clarified further.
Long-term treatment goals in HCV/HBV coinfected patients are to reduce liver-related mortality and the development of HCC. An analysis of the nationwide database from Taiwan suggested that the treatment with peginterferon plus ribavirin in coinfected patients was associated with improved liver outcomes [28]. In this observational study, the clinical outcomes were generally good; only 2 cases of non–liver-related death were recorded. Nevertheless, the long-term benefits post-HCV cure by DAA in HCV/HBV coinfected patients await further investigation.
We conclude that LED/SOF once daily for 12 weeks was safe and well tolerated in HCV-infected patients coinfected with HBV. Sustained virologic response was maintained through 108 weeks of follow-up. No new safety signals or toxicities were observed compared with those reported in the LED/SOF phase 3 studies in HCV monoinfected patients.
Notes
Author contributions: J.Y., B.M., V.S., F.Z., A.G., C.-J.L., and P.-J.C. contributed to the study concept and design. C.-J.L., W.-L.C., I-S.S., H.-Y.W., C.-Y.C., K.-C.T., T.-T.C., T.-H.H., Y.-C.H., G.-H.L., C.-J.C., J.-J.C., C.-Y.P., R.-N.C., P.-J.C. served as study investigators and collected data. D.J., F.Z., and G.C. contributed to the data analysis. All authors provided critical revision and approval of the manuscript. All authors approved the final version of the article.
Acknowledgments. We thank the patients and their families as well as the study site personnel. Writing assistance was provided by Jennifer King of August Editorial; Sandra Chen of Gilead Sciences, Inc., provided editorial assistance. We acknowledge the contribution of the Taiwan Liver Disease Consortium in the recruitment and follow-up of patients.
Financial support. This work was supported by Gilead Sciences, Inc.
References
Author notes
C.-J.L. and P.-J.C. contributed equally.
Potential conflicts of interest. C.-J.L. has served as a consultant for Gilead Sciences, Inc., AbbVie, BMS, and Spring Bank; has given sponsored lectures for Gilead Sciences, Inc., AbbVie, BMS, and MSD; and has received grants from MSD. W.-L.C. has served as a consultant for Gilead Sciences, Inc., AbbVie, BMS, Roche, and PharmaEssentia, and has given sponsored lectures for Gilead Sciences, Inc., AbbVie, BMS, MSD, and Roche. T.-H.H. has served as a consultant for Gilead Sciences, Inc., AbbVie, BMS, and PharmaEssentia; has given sponsored lectures for Gilead Sciences, Inc., AbbVie, BMS, and MSD; and has received grants from Gilead Sciences, Inc. J.Y., B.M., V.S., G.C., D.J., F.Z., and A.G. are employees of Gilead Sciences, Inc., and may hold stock interest in the company. C.-J.C. has given sponsored lectures for Gilead Sciences, Inc., and BMS. P.-J.C. has received grants from Roche, BMS, and J&J; has served as a consultant for BMS, Roche, Bayer, MSD, and Taiha; and has given sponsored lectures for BMS and received honorarium for reviewing grant applications for LDA as a reviewer for Gilead Research Program grant, Liver Disease Asia.

