


Abstract
Therapeutic drug monitoring (TDM) of beta-lactam antibiotics is recommended to address the variability in exposure observed in critical illness. However, the impact of TDM-guided dosing on clinical outcomes remains unknown. We conducted a systematic review and meta-analysis on TDM-guided dosing and clinical outcomes (all-cause mortality, clinical cure, microbiological cure, treatment failure, hospital and intensive care unit length of stay, target attainment, antibiotic-related adverse events, and emergence of resistance) in critically ill patients with suspected or proven sepsis. Eleven studies (n = 1463 participants) were included. TDM-guided dosing was associated with improved clinical cure (relative risk, 1.17; 95% confidence interval [CI], 1.04 to 1.31), microbiological cure (RR, 1.14; 95% CI, 1.03 to 1.27), treatment failure (RR, 0.79; 95% CI, .66 to .94), and target attainment (RR, 1.85; 95% CI, 1.08 to 3.16). No associations with mortality and length of stay were found. TDM-guided dosing improved clinical and microbiological cure and treatment response. Larger, prospective, randomized trials are required to better assess the utility of beta-lactam TDM in critically ill patients.
Sepsis is common in critically ill patients, being present in up to 40% of those admitted to the intensive care unit (ICU) [1]. For patients hospitalized with septic shock, 30-day mortality rates are as high as 37% [2]. In 2017, sepsis accounted for nearly 20% of deaths (11 million) and 48.9 million cases worldwide [3]. Prompt identification and management with timely and appropriate antimicrobial therapy is a key component in the resuscitation of the septic patient [4–6]. The 2021 Surviving Sepsis Campaign: International Guidelines for Management of Sepsis and Septic Shock recommend dose optimization of antimicrobials based on pharmacokinetic/pharmacodynamic (PK/PD) principles [4]. In the context of beta-lactam antibiotics (beta-lactams), these recommendations include extending the infusion time (3 hours or more) and using therapeutic drug monitoring (TDM), which involves dose adjustment based on measured concentrations to achieve predefined efficacy targets to optimize drug exposure [4]. These recommendations aim to counter the pathophysiological changes that occur in critical illness, which significantly alter beta-lactam pharmacokinetics [7]. Observational studies have demonstrated inferior clinical outcomes in critically ill patients that do not achieve optimal beta-lactam exposure [8–10]. While beta-lactam TDM is gaining wider application in the critical care setting, major barriers to its routine use include limited availability of data on its implementation, cost-effectiveness, and impact on patient-centered outcomes. We conducted a systematic review and meta-analysis to determine whether the use of TDM-guided dose optimization of beta-lactams improves clinical outcomes in critically ill patients.
METHODS
The protocol for this review was registered with the PROSPERO database (CRD42020188965). The study was conducted according to the Preferred Reporting Items for Systematic Reviews and Meta-analysis statement [11]. Ethics approval was not considered necessary as all analyses used previously published data.
Inclusion Criteria
All primary study types were considered, including cohort studies comparing beta-lactam TDM with standard dosing in critically ill patients with suspected or proven sepsis, as well as conference abstracts. Studies had to involve human participants aged ≥18 years who were defined as being critically ill (on the basis of each individual study) with suspected or proven focus of infection.
Exclusion Criteria
We excluded editorials, commentaries, letters to the editor, mathematical modeling papers, case reports, and case series with fewer than 10 participants. Studies on animals or focused on animal data were excluded. We excluded TDM studies that had no control groups; studies on antibiotics other than penicillins, carbapenems, monobactams, or cephalosporins; studies involving children; in vitro TDM studies; and articles with full text published in languages other than English.
Search Strategy
Two review authors (R. P. M., A. A.) independently searched the MEDLINE, Embase, and Cochrane CENTRAL databases for peer-reviewed articles published in English from database inception to March 2022. The reference lists from review articles were hand-searched to identify additional relevant references. We searched for relevant trials on ClinicalTrials.gov and the World Health Organization International clinical Trial Registry Platform and online conference abstract databases of the European Society of Clinical Microbiology and Infectious Diseases, ID Week, American Society for Microbiology, and International Association of Therapeutic Drug Monitoring and Clinical Toxicology for relevant conference abstracts. PROSPERO and the Cochrane Library were also searched for systematic reviews. The search strategy was supported by an independent librarian (L. R.). The detailed electronic search strategy is included in Supplementary File 1. Two review authors (R. P. M., A. A.) independently screened titles and abstracts of the references identified using Covidence [12]. The full text of relevant titles and abstracts was then independently assessed to identify studies that fulfilled inclusion criteria. Disagreements were resolved through discussion and, in case of nonconsensus, by consulting an additional review author (A. A. U.).
Data Extraction
Two reviewers (R. P. M., A. A.) independently extracted relevant information from all included studies using a customized data extraction form. The following information was collected from each study: study center, design, year, location, sample size, patient demographic, type of interventions, predominant site of infection, type of pathogen, minimum inhibitory concentration (MIC), type of beta-lactam, dose, dosing interval, type of infusion, dose adjustments, number of TDMs performed per patient, target attainment, dosing algorithm, use of concomitant antibiotics, primary and secondary outcomes, definitions used, and illness severity measures (eg, inflammatory markers, disease severity scores).
Risk of Bias Assessment
Two review authors (R. P. M., A. A.) independently assessed the risk of bias for each randomized, controlled trial (RCT) using the Cochrane risk of bias evaluation [13]. Risk of bias plots for RCTs were generated using the robvis tool [14]. The Newcastle–Ottawa scale (NOS) was applied to evaluate the quality of any observational studies [15]. The scale ranges from 0 to 9, with higher scores indicating higher quality [15]. Studies were assessed according to the criteria outlined in Supplementary File 2, Supplementary Table 1. Studies that scored 3 to 4 in the selection domain, 1 or 2 for comparability, and 2 or 3 for outcomes were deemed to be of “good quality.” We therefore chose a cutoff of ≥6 for good-quality studies. Any disagreements were resolved by discussion with a third review author (A. A. U.).
Outcomes
The primary outcome was all-cause mortality (at 28 days or longest follow-up). Secondary outcomes were clinical cure (resolution of signs and symptoms of sepsis or as defined by the study), treatment failure (as defined by the study), microbiological cure (clearance of organism from blood culture or site of infection or as defined by the study), hospital and ICU length of stay (LOS), target attainment (as defined by each individual study; target attainment was evaluated only in studies that reported beta-lactam concentration measurements in both intervention and control groups), antibiotic-related adverse events (acute kidney or liver injury; gastrointestinal, neurological, and hematological adverse events; and allergic reactions), and emergence of new antimicrobial resistance (as defined by the study). The definitions of clinical, microbiological, and biochemical improvement are summarized in Supplementary File 2, Supplementary Table 2.
Data Analysis and Statistical Method
Data were extracted into RevMan (Review Manager computer program, version 5.4; the Cochrane Collaboration, 2020). Risk ratios (RRs) were used to quantify the primary outcome. The standardized mean difference (SMD) was used to compare continuous outcomes (LOS). The I2 statistic was used to assess heterogeneity. An I2 value ≥50% indicated significant heterogeneity. Publication bias was assessed by visual inspection of funnel plots [16]. The meta-analysis was conducted using random effects models to obtain pooled RRs using estimates of heterogeneity from the Mantel–Haenszel model. Subgroup analyses were performed based on study design (RCTs only and non-RCTs), quality of cohort studies (NOS <6 and ≥6), and duration of infusion of study beta-lactam (30 minutes vs ≥2 hours). Median (interquartile range, range) values for LOS were converted to mean ± standard deviation (SD) using statistical calculations described in the literature [17]. If data for a particular outcome were not provided, this was noted. Not all studies reported all outcomes of interest. For each outcome, studies that were included were specified in the results.
RESULTS
From 4295 records identified through the literature search, 102 publications were retrieved for full text review; 11 studies (n = 1463 participants; TDM group, n = 765; standard dosing group, n = 698) that fulfilled the inclusion criteria were identified [18–28] (Figure 1). Among the included studies, 4 were RCTs [18–21] and 7 were retrospective observational studies [22–28], including 3 conference abstracts [25, 27] (Table 1). The sample size ranged from 32 to 249 participants. All studies were single-center, except for 1, which was conducted across 13 sites [18]. The specific beta-lactam antibiotics and mode of infusion used in each study are listed in Table 1. Concomitant antimicrobial therapy was reported in 3 studies [18, 20, 24, 26]. These included aminoglycosides, colistin, daptomycin, glycopeptides, linezolid, macrolides, metronidazole, quinolones, and trimethoprim/sulfamethoxazole. There were no evident conflicts of interest reported in the studies.
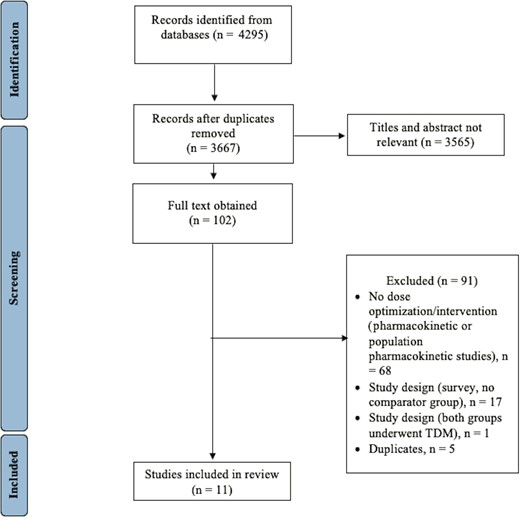
Flow diagram showing the number of included studies. Abbreviation: TDM, therapeutic drug monitoring.
Characteristics of Included Studies
| Author and Year/Country/Study Type/Aim or Hypothesis | Population/Intervention and Control | Antibiotic Type and Infusion/Pharmacokinetic–Pharmacodynamic Target/MIC | Notes and Mortality End Point |
|---|---|---|---|
| De Waele et al 2014 [19] Belgium Randomized, controlled trial Hypothesis: TDM-guided dosing will result in improved target attainment | N = 41; critically ill septic patients with normal renal function Intervention: daily TDM and dose adjustment as needed, n = 21; control: daily TDM, treating physicians blinded to result, n = 20 | Piperacillin and meropenem extended infusion Target: 100% fT > MIC; 100% fT >4 × MIC MIC: epidemiological cutoff value of wild-type Pseudomonas species | Dose adaptation was required in 16/21 (76%) patients; TDM-guided doses were 33%–100% higher than SOC doses Mortality end point: ICU and 28-day mortality |
| Sime et al 2015 [20] Australia Randomized, controlled trial Objective: assess the utility of TDM-guided dosing in achieving pharmacokinetic/pharmacodynamic target | N = 32; febrile neutropenia Intervention: daily TDM and dose adjustment as needed up to day 3, n = 16; control: daily TDM, no dose adjustment, n = 16 | Piperacillin intermittent bolus infusion Target: 100% fT > MIC; 50% fT > MIC MIC: EUCAST clinical breakpoint for Pseudomonas aeruginosa and Enterobacteriaceae | No difference in time to neutrophil recovery or fever resolution Mortality: not assessed as an outcome |
| Fournier et al 2018 [21] Switzerland Randomized, controlled trial Objective: determine the range of concentrations achieved and evaluate the impact of TDM and real-time dose adaptation on antibiotic concentrations | N = 38; burn patients Intervention: alternate day TDM, with dose adjustment, n = 19; control: no dose adjustment, n = 19 | Intermittent bolus, various beta-lactams;a predefined concentration ranges MIC: actual MIC of isolated pathogen or EUCAST clinical breakpoint for P. aeruginosa and Enterobacteriaceae Target: predefined concentration for each beta-lactam | Target attainment: appropriate antibiotic levels were seen in 79/118 (66.9%) concentrations in the TDM group when compared with 72/126 (57.14%) in the SOC group; more participants remained in the therapeutic range in the TDM group over the course of their treatment (193/297 days [65%]) compared with the standard dosing group (171/311 days [55%]), adjusted odds ratio, 1.64 (95% CI, 1.16 to 2.32; P = .005) Mortality end point: ICU mortality |
| Hagel et al 2022 [18] Germany Multicenter, randomized controlled, trial Objective: assess the effect of TDM-based dose optimization of piperacillin/tazobactam on sepsis-related organ dysfunction | N = 249; critically ill patients with sepsis Intervention: TDM, n = 125; control: without TDM, n = 124 | Continuous infusion, piperacillin/tazobactam MIC: actual MIC of isolated pathogen Target: 100 fT > MIC | Risk of extreme variability in concentrations was lower in TDM group (40% lower for subtherapeutic concentrations and 50% lower for supratherapeutic concentrations) Dose adjustments in the TDM group: 52% required dose increments and 48.8% required dose reduction Mean SOFA score TDM: 7.9 SOC: 8.2 (ΔSOFA = 0.3; 95% CI, −.4 to 1.0; P = .39) Mortality end point: 28-day mortality |
| Nikolas et al 2021 [28] Germany Retrospective cohort study Aim: describe the effect on clinical outcome of piperacillin TDM | N = 160; critically ill patients with sepsis Intervention: TDM, n = 114; control: without TDM, n = 46 | Continuous infusion, piperacillin/tazobactam MIC: NR Target: 100 fT > MIC | 271 concentrations obtained from 114 participants—194 (71.6%) were 22.5–100 mg/L, 71 (26.12%) were >100 mg/L, and 6 (2.2%) were <22.5 mg/L; identification of potential toxic concentrations (>100 mg/L) resulted in early dose adaptations in 30 measurements (11.1%); further dose adaptations for subtherapeutic and supratherapeutic concentrations were made based on 84 measurements (31%) Mortality end point: not specified |
| Kunz Coyne et al 2021 [27] United States Retrospective cohort study/conference abstract Objective: assess impact of beta-lactam antibiotic TDM-guided dose optimization on clinical outcomes in patients with Pseudomonas aeruginosa pneumonia and bloodstream infections | N = 200; critically ill patients with P. aeruginosa pneumonia and bloodstream infections Intervention: TDM, n = 95; control: without TDM, n = 105 | Infusion: NR, cefepime, ceftazidime, ceftazidime/avibactam, aztreonam, meropenem, and piperacillin MIC: actual and Clinical and Laboratory Standards Institute breakpoint Target: NR | Predictors of nonachievement of clinical cure; SOFA score ≥7 (OR, 2.962; P = .008; 95% CI, 1.357 to 6.469); renal replacement therapy (OR, 3.359; P = .005; 95% CI, 1.313 to 8.596) Mortality end point: all-cause in-hospital mortality |
| Aldaz et al 2021 [26] Spain Retrospective cohort study Objective: evaluate safety and efficacy of TDM-guided dose adaptation compared with standard meropenem doses in critically ill patients | N = 154; critically ill patients Intervention: TDM, n = 77; control: without TDM, n = 77 | Extended infusion, meropenem MIC: 1 mg/L based on local antibiogram data Target: fT > 4 × MIC | No patients in the TDM cohort required dose increments; peak and trough concentrations obtained were reported for the TDM cohort Reduction in procalcitonin: ≥80% reduction: TDM: 55 participants (71.43%); control: 41 participants (53.25%), P = .02 Procalcitonin concentrations before meropenem TDM: 4.58 (28.25–0.24); control: 4.70 (29–0.26), P = .86; Procalcitonin concentrations after meropenem TDM: TDM cohort: 0.31 (22.71–0.03); control: 0.78 (25.35–0.02), P = .0130. C-reactive protein normalization: TDM: 27 participants (35.06%); control: 11 participants (14.20%), P = .003 Fever: start of study: TDM: 73 participants (91.25%); control: 72 participants (77.42%), P = .731; end of study: TDM: 10 participants (12.99%); control: 20 participants (25.97%), P = .036 Mortality end point: in-hospital and 14-day mortality |
| Meyer et al 2019 [25] Germany Retrospective cohort study/conference abstract Aims: primary, assess effect of TDM on meropenem use; secondary, assess impact of meropenem TDM on clinical outcomes | N = 247; critically ill patients with sepsis Intervention: TDM, n = 146; control: without TDM, n = 101 | Infusion: NR meropenem MIC and target: NR | Mortality lower in TDM group, 24% vs 20% (P = .042); an average of 3.2 meropenem plasma concentrations were performed in TDM cohort; dose adaptations were performed in 1.6 in TDM cohort vs 0.8 in SOC Mortality end point: ICU mortality |
| Machado et al 2017 [24] Brazil Retrospective cohort study Aim: assess the effect of TDM on healthcare-associated infections in burn patients Hypothesis: TDM may influence clinical outcome and survival | N = 140; critically ill burn patients Intervention: TDM, n = 77; control: without TDM, n = 63 | Infusion: NR Meropenem, imipenem, piperacillin MIC: based on susceptibility breakpoints Target: 60% fT > MIC for meropenem. 100% fT > MIC for piperacillin | Mortality was significantly associated with older age, severity of burns, and presence of bacteremia Mortality end point: in-hospital mortality |
| McDonald et al 2016 [23] Australia Retrospective cohort study Aim: determine if higher-than-recommended TDM-guided doses of piperacillin and meropenem were associated with drug toxicities in critically ill patients | N = 93; critically ill patients TDM (high-dose group): n = 45; control (licensed dose group): n = 48 | Infusion: intermittent bolus, meropenem and piperacillin Continuous infusion in high-dose group to achieve target concentration MIC: EUCAST clinical breakpoint Target: 100% fT > MIC | Dose increments were performed in 17/53 treatment courses in TDM cohort vs 9/47 treatment courses in SOC cohort; reductions were required in 5/53 treatment courses in TDM cohort and 6/47 treatment courses in SOC cohort; mean daily doses for both drugs were >40% higher in the high-dose group compared with the licensed dose group Mortality end point: not specified |
| Fournier et al 2015 [22] France Retrospective cohort study Objective: determine the impact of TDM on appropriateness of carbapenem dosage in burn patients | N = 109; critically ill burn patients Intervention: TDM, n = 27; no TDM, n = 82 | Intermittent bolus, meropenem and imipenem MIC: of causative organism; if no organism isolated, MIC of 1 mg/L; later, this was changed to 2 mg/L (per EUCAST) Target: trough concentration > MIC, upper trough limit of 8 mg/L; 100% fT > MIC | Among 23 Imipenem TDMs, 52.2% (12/23) were within range and 47.8% (11/23) were insufficient; among 37 meropenem TDMs, 40.5% (15/37) were within range and 59.5% (22/37) were inappropriate (32.4% [12/37] were insufficient; 27% [10/37] were excessive) Mortality end point: ICU mortality |
Abbreviations: CI, confidence interval; EUCAST, European Committee on Antimicrobial Susceptibility Testing; fT > MIC, duration of time the free fraction the antibiotic remains over the MIC; ICU, intensive care unit; MIC, minimum inhibitory concentration; NR, not reported; OR, odds ratio; SOC, standard of care; SOFA, score, sequential organ failure assessment score; TDM, therapeutic drug monitoring.
Amoxicillin, cefazolin, ceftazidime, ceftriaxone, ertapenem, flucloxacillin, imipenem, meropenem, piperacillin/tazobactam.
Clinical Outcomes
Mortality
Of the 11 studies, Sime et al [20] did not report mortality. Ten studies (1431 participants), with follow-up ranging from 7 days to 3 months, reported on mortality (Table 1). Overall, 17.8% (133 of 749 participants) in the TDM group and 21.4% (146 of 682 participants) in the standard dosing group died (Table 2). The RR was 0.85 (95% confidence interval [CI], .69 to 1.04; I2 = 0%; Figure 2). Analysis of studies that reported mortality time points (14-day and 28-day, 584 participants) and ICU mortality (666 participants) showed pooled RRs of 0.85 (95% CI, .59 to 1.23; I2 = 0%; n = 4 studies; Supplementary File 2, Supplementary Figure 1A) and 0.78 (95% CI, .43 to 1.43; I2 = 33%; n = 5 studies; Supplementary File 2, Supplementary Figure 1B), respectively. No statistically significant between-group association was found for mortality.

Forest plot showing the risk of mortality with TDM-guided beta-lactam dosing compared with standard dosing. The blue squares represent the effect estimates from individual studies; the size of the square is proportional to the weight of the study. The horizontal lines represent the 95% CI of the study estimate. The black diamond represents the pooled effect size. Abbreviation: CI, confidence interval; df, degrees of freedom; M-H, Mantel-Haenszel Test; RR, risk ratio; TDM, therapeutic drug monitoring.
Summary of Outcomes
| TDM-Guided Dose Optimization of Beta-Lactam Antibiotics Compared With Standard Dosing in Critically Ill Patients With Sepsis | ||||||
|---|---|---|---|---|---|---|
| Patient or Population: Critically Ill With Sepsis Setting: Intensive Care Unit/Critical Care Setting Intervention: TDM-Guided Beta-Lactam Antibiotic Dose Optimization Comparison: Standard Dosing of Beta-Lactam Antibiotics, SOC | ||||||
| Absolute Effect | ||||||
| Outcomes | SOC | TDM | Absolute Risk Difference | Relative Effect (95% Confidence Interval) | Number of Participants (Studies) | Comments |
| Mortality | 146/682 (21.41%) | 133/749 (17.78%) | There were 36.3 more deaths per 1000 participants in the SOC group compared with the TDM group | RR 0.85 (.69 to 1.04) | 1431 (10 studies) | Includes 3 RCTs |
| Target attainment | 52/203 (25.62%) | 103/207 (49.76%) | There were 241 more target attainments per 1000 participants in the TDM group compared with the SOC group | RR 1.85 (1.08 to 3.16) | 410 (4 studies) | Includes 3 RCTs |
| Clinical cure | 215/379 (56.73%) | 260/377 (68.97%) | There were 122 more clinical cures per 1000 participants in the TDM group compared with the SOC group | RR 1.17 (1.04 to 1.31) | 756 (6 studies) | Includes 1 RCT |
| Treatment failure | 124/302 (41.1%) | 94/300 (31.33%) | There were 13.1 more treatment failures per 1000 participants in the SOC group compared with the TDM group | RR 0.78 (.65 to .95) | 602 (5 studies) | Includes 2 RCTs |
| Microbiologic cure | 131/192 (68.23%) | 154/194 (79.38%) | There were 111.5 more microbiologic cures per 1000 participants in the TDM group compared with the SOC group | RR 1.14 (1.03 to 1.27) | 386 (4 studies) | Includes 2 RCTs |
| Narrative summary | |||||||
|---|---|---|---|---|---|---|---|
| Author | SOC | TDM | Significance | ||||
| Intensive care unit length of stay, days | Nikolas 2021 Mean ± SD | 4.4 ± 2 | 8.4 ± 4.7 | NR | |||
| Kunz Coyne 2021 Median (IQR) | 14 (8–23) | 19 (11–28) | P = .019 | ||||
| Hagel 2021 Median (IQR) | 11 (7–17) | 9 (4–15) | P = .24 | ||||
| Aldaz 2021 Median (range) | 7 (3–99) | 8 (3–98) | P = .473 | ||||
| Meyer 2019 Mean ± SD | 14.6 ± 9.8 | 14.7 ± 10.7 | P value NR | ||||
| Fournier 2018 Median (IQR) | 20 (12–40) | 27 (13–45) | P value NR | ||||
| McDonald 2016 Mean ± SD | MEM: 16.4 ± 7.4 PIP: 14.8 ± 11 | MEM: 20 ± 9.9 PIP: 13 ± 7.3 | MEM: P = .17 PIP: P = .52 | ||||
| Fournier 2015 Median (IQR) | 27.5 (16–47.25) | 53 (35–78) | P = <.0001; length of stay significantly lower in the SOC group | ||||
| Hospital length of stay, days | Kunz Coyne 2021 Median (IQR) | 21 (11–29) | 21 (15–33) | P = .337 | n/a | 696 (4 studies) | Includes 1 RCT |
| Hagel 2021 Median (IQR) | 25 (11–17) | 24 (15–28) | P = .52 | ||||
| Aldaz 2021 Median (range) | 39 (4–343) | 28 (5–219) | P = .007 | ||||
| McDonald 2016 Mean ± SD | MEM: 156.6 ± 185 PIP: 26.8 ± 11.8 | MEM: 68.4 ± 130.8 PIP: 27.1 ± 12.5 | MEM: P = .06 PIP: P = .93 | ||||
| Antibiotic-related adverse drug reactions | Hagel 2022 | Hypernatremia, 13/27 | Hypernatremia, 12/20 | n/a | No study found any significant association between TDM-guided dosing and incidence of adverse reactions/toxicity; Aldaz et al and Hagel et al reported adverse drug events per participant; whereas McDonald et al and Kunz Coyne et al reported adverse events per treatment course per beta-lactam | ||
| GI, 6/27 | GI, 3/20 | ||||||
| Kunz Coyne 2021 | GI, 6/105 | GI, 3/95 | P = .497 | ||||
| Renal, 29/105 | Renal, 31/95 | P = .440 | |||||
| CNS, 3/105 | CNS, 5/95 | P = .481 | |||||
| Aldaz 2021 | GI, 11/77 | GI, 11/77 | P = 1 | ||||
| Hepatobiliary, 36/77 | Hepatobiliary, 36/77 | P = 1 | |||||
| Hematologic, 31/77 | Hematologic, 40/77 | P = .148 | |||||
| CNS, 10/77 | CNS, 4/77 | P = .093 | |||||
| Dermatologic, 2/77 | Dermatologic, 3/77 | P = .649 | |||||
| McDonald 2016 | Hepatobiliary PIP (hepatitis), 4/25 PIP (cholestasis), 1/25 MEM (hepatitis), 7/22 MEM (cholestasis), 3/22 | Hepatobiliary PIP (hepatitis), 4/23 PIP (cholestasis), 3/23 MEM (hepatitis), 5/28 MEM (cholestasis), 7/28 | P = .90 P = .26 P = .25 P = .32 | ||||
| Hematologic PIP (thrombocytopenia), 1/25 PIP (neutropenia), 0/25 MEM (thrombocytopenia), 2/22 MEM (neutropenia), 1/22 | Hematologic PIP (thrombocytopenia), 1/23 PIP (neutropenia), 1/23 MEM (thrombocytopenia), 3/28 MEM (neutropenia), 1/28 | P = .87 P = .33 P = .87 P = .33 | |||||
| CNS (seizure) PIP, 0/25 MEM, 1/22 | CNS (seizure) PIP, 0/23 MEM, 2/28 | P = .70 | |||||
| Renal (CRRT) PIP (incidence), 2/25 PIP (resolved), 2/25 MEM (incidence), 2/22 MEM (resolved), 1/22 | Renal (CRRT) PIP (incidence), 0/23 PIP (resolved), 0/23 MEM (incidence), 0/28 MEM (resolved), 0/28 | P = .16 P = .33 P = .10 P = .25 | |||||
Abbreviations: CNS, central nervous system; CRRT, continuous renal replacement therapy; GI, gastrointestinal; IQR, interquartile range; MEM, meropenem; n/a, not applicable; NR, not reported; PIP, piperacillin; RCT, randomized controlled trial; RR, risk ratio; SD, standard deviation; SOC, standard of care; TDM, therapeutic drug monitoring.
Target Attainment
Four of the 8 studies [18–23, 26, 28] that reported target attainment could be included in the analysis (410 participants; Figure 3A). Target attainment data from the other 4 studies could not be pooled as they were disparate. These are described in Table 1. TDM-guided dosing was significantly associated with (85% increased) target attainment: 1.85 (106 of 207 TDM vs 54 of 203 no TDM; 95% CI, 1.08 to 3.16; I2 = 76%; Figure 3A).
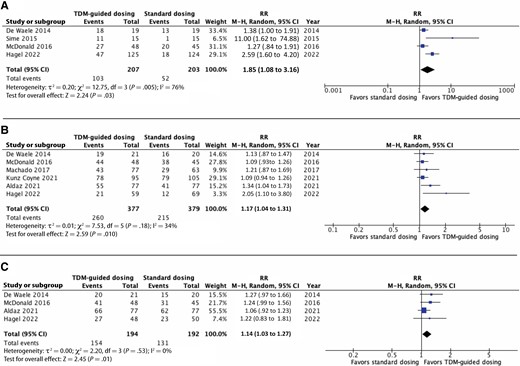
Forest plot comparing subgroup target attainment (A), clinical cure (B), and microbiologic cure (C). The blue squares represent the effect estimates from individual studies; the size of the square is proportional to the weight of the study. The horizontal lines represent the 95% CI of the study estimate. The black diamond represents the pooled effect size. Abbreviation: CI, confidence interval; df, degrees of freedom; M-H, Mantel-Haenszel Test; RR, risk ratio; TDM, therapeutic drug monitoring.
Clinical Cure
Six studies [18, 19, 23, 24, 26, 27] reported on clinical cure (756 participants), and 5 studies [18, 19, 23, 24, 27] reported on treatment failure (602 participants). TDM-guided dosing was significantly associated with an increase (17% increase) in clinical cure: 1.17 (260 of 377 TDM vs 215 of 379 no TDM; 95% CI, 1.04 to 1.31; I2 = 0%; Figure 3B) and reduced risk of treatment failure (21% reduced): 0.79 (94 of 300 TDM vs 124 of 302 no TDM; 95% CI, .66 to .94; I2 = 0%; Supplementary File 2, Supplementary Figure 1C), respectively.
Microbiological Cure
Microbiological cure was assessed in 4 studies (386 participants) [18, 19, 23, 26]. TDM-guided dosing was significantly associated with an increase (14% increase) in microbiological cure: 1.14 (154 of 194 TDM vs 131 of 192 no TDM; 95% CI, 1.03 to 1.27; I2 = 0%; Figure 3C).
Length of Stay
Eight studies [18, 21–23, 25–28] reported ICU LOS, and 4 studies [18, 23, 26, 27] reported hospital LOS (Table 2). The pooled ICU LOS (mean ± SD) was 17.19 ± 17.04 days in the TDM group and 17.65 ± 16.16 days in the standard dosing group. The pooled hospital LOS (mean ± SD) was 36.81 ± 46.78 days in TDM group and 47.79 ± 72.36 days in standard dosing group. No statistically significant between-group differences were identified for ICU (1250 participants) or hospital (696 participants) LOS: standardized mean difference (SMD) of 0.27 (95% CI, −.04 to .58; I2 = 85%; Supplementary File 2, Supplementary Figure 1D) and SMD of −0.07 (95% CI, −.55 to .41; I2 = 90%; Supplementary File 2, Supplementary Figure 1E), respectively.
Antibiotic-related Adverse Events
Adverse drug events (ADE) attributable to antibiotics were reported in 4 studies [18, 23, 26, 27] (Table 2). A range of ADEs were reported (Table 2). There were 185 antibiotic-related adverse events among 260 participants (71.2%) in the TDM group and 185 among 254 participants (72.8%) in the standard dosing group. Individual studies did not find any statistically significant between-group differences in ADEs. Two studies reported increased hepatobiliary ADEs in both groups [23, 26].
Emergence of Antibiotic Resistance
No studies reported on emergence of antibiotic resistance.
Risk of Bias Assessment
The risk of bias for RCTs per the Cochrane risk of bias assessment is illustrated in Figure 4A and 4B. There was a high risk of bias among 3 [18, 19, 21] of the 4 included RCTs.
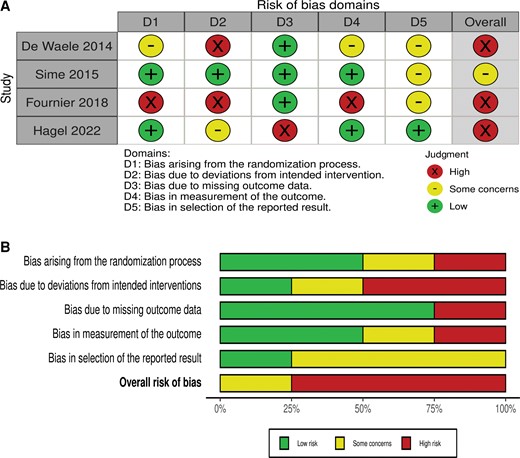
A, Traffic light plot with summary of risk of bias for each randomized controlled trial: low (+), some concerns (–), and high (×). B, Summary plot. Each risk of bias item is presented as percentage.
The quality of cohort studies as assessed using the NOS is shown in Table 3. Among the cohort studies, 4 had a score of ≥6 (Table 3). Better-quality cohort studies scored higher in the comparability category.
Quality Assessment of Studies Using the Newcastle–Ottawa Scale
| Selection | Outcomes | ||||||||
|---|---|---|---|---|---|---|---|---|---|
| Study | Representativeness of the Exposed Cohort | Selection of Nonexposed Cohort | Ascertainment of Exposure | Outcome of Interest Not Present at Start of Study | Comparability | Assessment of Outcome | Adequacy of Length of Follow-up | Adequacy of Follow-up | Total |
| Nikolas 2021 | ⋆ | ⋆ | ⋆ | … | … | … | … | … | 3⋆ |
| Kunz Coyne 2021a | ⋆ | ⋆ | ⋆ | ⋆ | ⋆⋆ | … | ⋆ | … | 7⋆ |
| Aldaz 2021 | ⋆ | ⋆ | ⋆ | ⋆ | ⋆⋆ | … | ⋆ | ⋆ | 8⋆ |
| Meyer 2019a | ⋆ | ⋆ | … | ⋆ | … | … | … | … | 3⋆ |
| Machado 2017 | ⋆ | ⋆ | ⋆ | ⋆ | ⋆⋆ | … | … | … | 6⋆ |
| McDonald 2014 | ⋆ | ⋆ | ⋆ | ⋆ | ⋆⋆ | … | … | … | 6⋆ |
| Fournier2015 | ⋆ | ⋆ | ⋆ | ⋆ | … | … | … | … | 4⋆ |
The retrospective studies were assessed using the Newcastle–Ottawa Scale, which consists of 3 main sections including cohort selection (1 ⋆ for each criterion), comparability (maximum of 2 ⋆), and outcome (1 ⋆ for each criterion). A score range of 0–9 ⋆ was allocated to each study. Studies with scores ≥6 were considered to be of higher quality.
Conference abstracts.
Subgroup Analysis
Subgroup analysis by study design, study quality (NOS score <6 vs ≥6), and duration of beta-lactam infusion used (prolonged infusion vs intermittent bolus) did not show statistically significant between-group differences for mortality (Supplementary File 2, Supplementary Table 3).
Publication Bias
The funnel plot (Figure 5) was asymmetric, indicating potential heterogeneity, reporting bias, or chance [16]. The plots remained asymmetric when repeated according to study type (RCT and cohort). However, evaluation of the funnel plot for publication bias was limited due to the small number of studies.
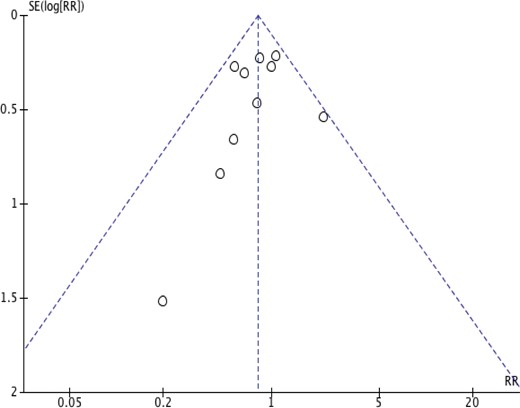
Funnel plot showing the assessment of publication bias. Abbreviations: RR, risk ratio; SE, standard error.
DISCUSSION
In this analysis, we found no significant pooled effect of TDM-guided dosing of beta-lactams on all-cause mortality in critically ill patients with suspected or proven sepsis. TDM-guided dose adaptation was associated with greater target attainment (85% higher), improved clinical (17% higher) and microbiological cure (14% higher), and a 21% reduction in risk of treatment failure. No associations were observed with the application of TDM for LOS (ICU and hospital).
To our knowledge, we are the first to analyze the association between clinical outcomes and beta-lactam TDM in this systematic review and meta-analysis. In a systematic review, Lechtig-Wasserman et al [29] examined the association between carbapenem TDM and clinical outcomes. The authors were unable to demonstrate any significant relationship between carbapenem TDM and clinical outcomes (mortality and LOS) [29]. Only 3 studies could be included in the mortality analysis and 2 for LOS and microbiological cure [29]. Several other cohort studies that have reinforced improved target attainment with beta-lactam TDM are reported in the literature [7, 30–34]. While none of these were able to demonstrate superior clinical outcomes, they underscored the inferior beta-lactam exposure in critically ill patients due to unpredictable pharmacokinetic variability. The lack of beneficial findings in these studies could be explained by small sample size and study designs (predominantly retrospective). In a systematic review of beta-lactam pharmacokinetic studies, Sime et al [35] concluded that the variability in concentrations warrants dose optimization approaches that improve exposure. Huttner et al [36] and Muller et al [37] have similarly reinforced the need for beta-lactam TDM in critical illness to improve exposure.
Using TDM to overcome this variability and individualizing doses to achieve concentrations within the therapeutic range in at-risk patients is an intuitive and appealing solution [37]. However, incorporating TDM in daily practice is expensive and requires substantial resources, infrastructure, and expertise [38]. A paucity of data on cost-effectiveness and impact on clinical outcomes in patients with sepsis are additional major barriers to its routine use in the clinical setting [38]. Our review demonstrates that there is a need for larger, prospective, interventional studies to establish the evidence for this therapeutic intervention. This is particularly important as TDM is being increasingly recommended in the management of the critically ill septic patient [4].
Our study has several limitations. Critical illness is a highly heterogenous condition with variable presentation and underlying etiologies. We included studies that involved critically ill patients who underwent beta-lactam TDM. However, it is unclear whether all patients had confirmed infection or were necessarily septic. The inclusion of patients who were not septic would increase the likelihood of finding no impact of TDM on mortality. Given the small number of studies that evaluated beta-lactam TDM and clinical outcomes and the overall small number of patients in each study, we included retrospective, observational studies and conference abstracts (which are not yet peer reviewed). However, 4 of the 7 retrospective studies were determined to be good quality using the NOS scale. We also found that the measure of heterogeneity (I2 statistic) was low for the included studies. The included studies focused on different beta-lactams, with inherent differences in their pharmacodynamic properties (eg, cephalosporin vs penicillin vs carbapenem). However, pragmatically, we included all studies that reported beta-lactam TDM, regardless of the beta-lactam antibiotic type, so as to provide a more generalizable assessment of the impact of this intervention. The included studies also evaluated overarching targets of 100% fT > MIC or 100% fT > 4 × MIC regardless of the individual beta-lactam. While the inclusion of these higher targets further improved generalizability, we acknowledge that significant uncertainty exists regarding optimal beta-lactam PK/PD targets in critically ill patients [39].
CONCLUSIONS
Our systematic review did not show a significant association between beta-lactam antibiotic TDM in critically ill patients and mortality; however, clinical and microbiological cure and treatment failure were all improved in those who underwent TDM. Higher-quality, larger, prospective studies in patients with clearly defined infections are required to assess the utility and impact of beta-lactam antibiotic TDM-guided dosing in critically ill patients.
Supplementary Data
Supplementary materials are available at Clinical Infectious Diseases online. Consisting of data provided by the authors to benefit the reader, the posted materials are not copyedited and are the sole responsibility of the authors, so questions or comments should be addressed to the corresponding author.
Notes
Author contributions. R. P. M. conceived of and designed the study. R. P. M. and A. A. performed the literature review and extracted the data. R. P. M. coded the statistical analysis, figures, and appendix, and S. J. L. provided statistical support. R. P. M. interpreted the data and wrote the first draft of the manuscript. All authors reviewed and revised subsequent drafts and approved the final version.
R. P. M. is the recipient of National Health and Medical Research Council (NHMRC) postgraduate scholarship. T. N. P. is the recipient of NHMRC Career Development Fellowship and has received consultancy fees from Merck Sharp & Dohme Corp; A. Y. P. is funded by a NHMRC Practitioner Fellowship, Australia and is the recipient of a grant from Merck Sharp & Dohme Corp. A. A. U. is the recipient of grants from NHMRC and The Department of Health, Australia. S. J. L, L. R., A. A. have no financial disclosures.
References
Author notes
Potential conflicts of interest. R. P. M. reports a doctorate support scholarship from the National Health and Medical Research Council of Australia (NHMRC) unrelated to this work. A. A. U. reports grant funding from the NHMRC (paid to Monash University), the Medical Research Future Fund (MRFF) Australia (paid to Monash University), and the Department of Health, Commonwealth of Australia (paid to Monash University) for research projects outside the current work and in-kind support (trial consumables) from Integra Lifesciences for a project outside the current work. A. Y. P. reports grant funding from the NHMRC (Practitioner Fellowship; paid to Monash University) for research projects outside the current work and an investigator-initiated research grant from Merck Sharp & Dohme Corp. T. N. P. reports an NHMRC Career Development Fellowship; funds for advisory board consultancy for Merck Sharp & Dohme Corp outside the scope the submitted work and paid to author’s institution; and fees from Australian Health Unity as a consultant advising on coronavirus disease 2019 preparedness in residential aged care facilities. All authors declare that they have no known conflicts of interest, financial or otherwise that could have influenced the research reported in this paper. All authors have submitted the ICMJE Form for Disclosure of Potential Conflicts of Interest. Conflicts that the editors consider relevant to the content of the manuscript have been disclosed.

