


Abstract
After an initial decline from April through June 2020 (from 22.2% to 11.9%), adjusted in-hospital mortality in coronavirus disease 2019 (COVID-19) inpatients peaked twice and was significantly higher than June 2020 for subsequent months except in July and October 2020. Adjusted mortality trends differed across age groups between November 2020 and February 2021.
As of August 2021, coronavirus disease 2019 (COVID-19) has contributed to over 624 000 deaths in the United States [1]. During the early months of the pandemic (April to June of 2020), a sharp decrease in in-hospital mortality was widely reported [2, 3]. Monthly crude in-hospital mortality among inpatients with confirmed COVID-19 has been estimated using a geographically diverse all-payer hospital administrative database (Premier Healthcare Database [PHD]) that accounts for approximately 20–25% of total inpatient encounters in the United States at the Centers for Disease Control and Prevention (CDC) COVID Data Tracker site (https://covid.cdc.gov/covid-data-tracker/#hospitalizations-severity). Although such information is helpful to the public, crude mortality may not reflect true changes in mortality associated with shift in patient demographics and clinical and hospital characteristics during the pandemic [2, 4–6].
Since both patient and hospital factors can affect mortality among inpatients with COVID-19, it is important to know whether differences in these factors explain any of the observed changes in mortality over the course of the pandemic [7–10]. This study aimed to describe covariate-adjusted monthly trends in overall, age-, and sex-specific in-hospital mortality among US inpatients with COVID-19 from April 2020 through February 2021 during both initial encounter and 30-day follow-up.
METHODS
Study Design, Data Source, and Study Population
We performed a retrospective cohort study using the PHD COVID-19 special release (PHD-SR) [9, 11], a stand-alone version of PHD from 1 January 2019 to the most current data available to accommodate urgent COVID-19 research needs. The PHD-SR contains data from approximately 800+ hospitals and is currently used by the National Institutes of Health and CDC for COVID-19–related studies [5, 12, 13].
All data were statistically deidentified and compliant with the Health Insurance Portability and Accountability Act. Based on US Title 45 Code of Federal Regulations, Part 46, the study was exempted from institutional review board approval. The study followed the Strengthening the Reporting of Observational Studies in Epidemiology (STROBE) [14] guideline.
All inpatient discharges between 1 April 2020 and 28 February 2021 with a principal/secondary discharge diagnosis of COVID-19 (International Classification of Diseases, 10th revision, Clinical Modification [ICD-10-CM], diagnosis code U07.1) were analyzed [15]. To avoid variation over time in hospitals submitting data to PHD-SR, we only included visits from hospitals that continuously submitted data during the study period.
Outcome Measures and Patient, Hospital, and Visit Characteristics
The primary outcome was “in-hospital mortality” (discharge status equal to “expired”) during the “index hospitalization” (first COVID-19–related inpatient admission during the study period) or subsequent COVID-19–related inpatient or outpatient visits to the same hospital within 30 days of discharge.
Patient demographic and clinical characteristics assessed at the index hospitalization included age, sex, self-reported race and ethnicity, primary insurance payer, and comorbidities. Hospital characteristics included urbanicity of population served (ie, urban or rural), teaching status, United States Census region (ie, Midwest, Northeast, South, or West), and bed size (ie, 1–299, 300–499, 500+ beds). Two separate fields for race and ethnicity were combined into 1 race/ethnicity field and categorized as Hispanic, White, Black, or other/unknown.
Comorbidities—including hypertension, history of smoking, morbid obesity, and comorbidities included in the Charlson-Deyo Comorbidity Index (CCI) [16]—were identified using ICD-10-CM discharge diagnosis codes (Supplementary Table 1) during index hospitalization or any prior visit to the same hospital within 180 days. Weighted CCI score was grouped into 3 categories: 0, 1–4, and 5+.
Statistical Analysis
Unadjusted in-hospital mortality was calculated as the proportion of hospitalized patients who died either during index hospitalization or within 30 days of discharge for each month. Adjusted odds of in-hospital mortality by month were assessed using multivariable logistic regression models with mortality as outcome and discharge month as predictor (the lowest point of mortality during study period, June 2020, was used as the reference month). A priori covariates included patient characteristics (sex, age group, race/ethnicity, comorbidities) and hospital characteristics (urban/rural population served, teaching status, geographical region, size). Final model covariates were selected using a backward-selection method, with a significance level of P < .10 for covariates to stay in the model and robust standard errors to adjust for clustering of patients within hospitals. Based on the variance inflation factor, covariate multicollinearity was not present in the final model. Lastly, covariate-adjusted in-hospital mortality was estimated using the recycled prediction method to calculate predicted margins [17–20]. Age- and sex-specific results were calculated using the same methods and covariates, except age (for age-specific) or sex (for sex-specific).
All analyses were performed using SAS version 9.4 (SAS Institute, Inc, Cary, NC), and the figures were generated using R version 4.0.2 (R Foundation for Statistical Computing, Vienna, Austria).
RESULTS
A total of 528 620 adult patients with 1 or more COVID-19–related inpatient discharges from 876 hospitals between April 2020 and February 2021 were identified in the PHD-SR. Of these patients, 58 527 were excluded due to noncontinuous hospital data submission, leaving 470 093 patients from 508 hospitals in the final study cohort. Excluded patients were more likely to be hospitalized in small (1–299 beds; 66.9% vs 35.5%), nonteaching (67.9% vs 51.7%), and rural (33.3% vs 9.8%) hospitals.
The average age of the study population was 63.9 years; 51.7% were male, 53.4% were White, 18% were Black, and 18% were Hispanic (Table 1). Common comorbidities were hypertension (69.9%), diabetes mellitus (42.3%), chronic pulmonary disease (23.6%), and morbid obesity (21.5%) (Table 1, Supplementary Figure 1). Most patients (46.1%) were hospitalized in the South (reflective of hospitals included in PHD) and in urban hospitals (90.2%), but patients were evenly distributed across small, medium, and large hospitals.
Baseline Demographics of Adult Inpatients With COVID-19 (Total and Deceased) Discharged Between April 2020 and February 2021
| Total (N = 470 093) | Deceased (n = 67 975) | |
|---|---|---|
| Patient characteristics | ||
| Age category, n (%) | ||
| 18–44 years | 70 719 (15.0) | 1981 (2.9) |
| 45–54 years | 58 449 (12.4) | 3987 (5.9) |
| 55–64 years | 91 667 (19.5) | 10 535 (15.5) |
| 65–74 years | 106 170 (22.6) | 18 500 (27.2) |
| 75–84 years | 90 159 (19.2) | 19 682 (29.0) |
| 85+ years | 52 929 (11.3) | 13 290 (19.6) |
| Age, years, continuous | ||
| Mean ± SD | 63.9 ± 17.5 | 72.9 ± 13.1 |
| Median (IQR) | 66.0 (53.0, 77.0) | 74.0 (65.0, 82.0) |
| Sex, n (%) | ||
| Female | 226 306 (48.1) | 27 611 (40.6) |
| Male | 243 196 (51.7) | 40 313 (59.3) |
| Unknown | 591 (0.1) | 51 (0.1) |
| Race/ethnicity,a n (%) | ||
| White | 250 964 (53.4) | 37 620 (55.3) |
| Black | 84 447 (18.0) | 10 845 (16.0) |
| Hispanic | 84 474 (18.0) | 11 418 (16.8) |
| Other/unknown | 50 208 (10.7) | 8092 (11.9) |
| Payer, n (%) | ||
| Medicaid | 63 381 (13.5) | 5630 (8.3) |
| Medicare | 254 892 (54.2) | 49 715 (73.1) |
| Private insurance | 114 220 (24.3) | 8791 (12.9) |
| Other/uninsured | 37 604 (8.0) | 3839 (5.6) |
| Baseline comorbidities, n (%) | ||
| Morbid obesity | 101 261 (21.5) | 14 589 (21.5) |
| Hypertension | 328 543 (69.9) | 56 051 (82.5) |
| History of smoking | 39 382 (8.4) | 4745 (7.0) |
| Myocardial infarction | 47 923 (10.2) | 13 009 (19.1) |
| Congestive heart failure | 84 334 (17.9) | 20 303 (29.9) |
| Peripheral vascular disease | 21 286 (4.5) | 4841 (7.1) |
| Cerebrovascular disease | 21 232 (4.5) | 5195 (7.6) |
| Dementia | 58 646 (12.5) | 13 678 (20.1) |
| Chronic pulmonary disease | 110 893 (23.6) | 19 311 (28.4) |
| Rheumatic disease | 11 492 (2.4) | 2083 (3.1) |
| Peptic ulcer disease | 5486 (1.2) | 1153 (1.7) |
| Diabetes mellitus | 198 763 (42.3) | 35 287 (51.9) |
| Hemiplegia or paraplegia | 6425 (1.4) | 1316 (1.9) |
| Chronic kidney disease | 85 718 (18.2) | 20 898 (30.7) |
| Mild liver disease | 5201 (1.1) | 1123 (1.7) |
| Moderate or severe liver disease | 5326 (1.1) | 1708 (2.5) |
| Any malignancy | 23 632 (5.0) | 5315 (7.8) |
| Metastatic solid tumor | 6174 (1.3) | 1456 (2.1) |
| HIV | 1400 (0.3) | 194 (0.3) |
| Charlson Comorbidity Index score category, n (%) | ||
| 0 | 132 574 (28.2) | 8043 (11.8) |
| 1–4 | 274 253 (58.3) | 43 064 (63.4) |
| 5+ | 63 266 (13.5) | 16 868 (24.8) |
| Hospital characteristics | ||
| Hospital size, n (%) | ||
| 1–299 beds | 166 829 (35.5) | 22 429 (33.0) |
| 300–499 beds | 149 490 (31.8) | 22 878 (33.7) |
| 500+ beds | 153 030 (32.6) | 22 545 (33.2) |
| Other/unknown | 744 (0.2) | 123 (0.2) |
| Teaching status, n (%) | ||
| Non-teaching hospital | 242 993 (51.7) | 33 078 (48.7) |
| Teaching hospital | 227 100 (48.3) | 34 897 (51.3) |
| Urbanicity of population served, n (%) | ||
| Rural | 46 021 (9.8) | 6591 (9.7) |
| Urban | 424 072 (90.2) | 61 384 (90.3) |
| Geographic location, n (%) | ||
| Midwest | 97 588 (20.8) | 13 196 (19.4) |
| Northeast | 88 912 (18.9) | 15 085 (22.2) |
| South | 216 616 (46.1) | 29 476 (43.4) |
| West | 66 977 (14.2) | 10 218 (15.0) |
Abbreviations: COVID-19, coronavirus disease 2019; HIV, human immunodeficiency virus; IQR, interquartile range.
aIf the patient self-reported Hispanic ethnicity, the patient was categorized as Hispanic. Patients with ethnicity as “not Hispanic or unknown” were categorized using race, as White, Black, or other/unknown. (ie, “White” is White with unknown or non-Hispanic ethnicity).
In-Hospital Mortality Over Time
Trends in mortality were very similar before and after adjusting for significant patient and hospital characteristics (sex, age group, race/ethnicity, CCI score category, morbid obesity, hypertension, chronic kidney disease, diabetes mellitus, hospital urban/rural population served, teaching status, geographical region, bed size) (Figure 1a, Supplementary Figure 2 and Supplementary Table 2). From the initial high of 22.2% in April 2020, in-hospital mortality declined to 11.9% by June 2020 but showed no further decline through February 2021. Instead, in-hospital mortality showed 2 peaks between July 2020 and February 2021—increasing to 14.0% in August 2020 (P < .01 vs June 2020) and decreasing to 12.2% in October 2020 (12.2%, P = .36 vs June 2020), and then increasing again to 14.1% in January 2021 (P < .01 vs June 2020). Relative to June 2020, the month with the lowest mortality, the odds of in-hospital mortality were significantly higher (by ~20%) in August, September, and December of 2020 and January and February of 2021 (adjusted odds ratio: 1.23, 1.17, 1.21, 1.24, and 1.21, respectively, all P < .05).
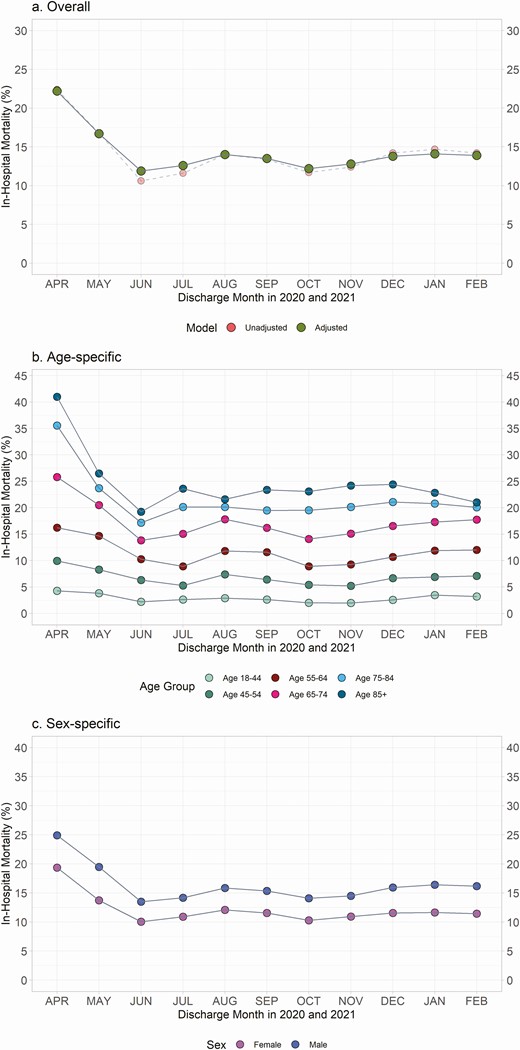
Monthly adjusted and unadjusted trends in in-hospital mortality during index hospitalization and 30 days postdischarge overall, by age group, and by sex among hospitalized patients with COVID-19. a, Overall. b, Age-specific. c, Sex-specific. *Adjusted for month, sex, age group, race/ethnicity, Charlson Comorbidity Index score category, morbid obesity, hypertension, chronic kidney disease, diabetes mellitus, hospital size, hospital teaching status, hospital region, and urbanicity of population served. Age and sex were not included in the model for age- and sex-specific results, respectively. Abbreviation: COVID-19, coronavirus disease 2019.
We also evaluated age-specific and sex-specific monthly trends in in-hospital mortality. In patients aged 85 years and older, adjusted mortality significantly increased from June to July 2020 (19.2% to 23.6%; P < .01) and decreased from December 2020 to February 2021 (from 24.4% to 21.0%; P < .01) (Figure 1b, Supplementary Table 3). The adjusted in-hospital mortality in the 75–84-year-old group was stable between November 2020 and February 2021 (between 20.1% and 21.1%). Between November 2020 and February 2021, increase in in-hospital mortality was observed in both 55–64- and 65–74-year-old groups (from 9.3% to 12.0% and 15.1% to 17.7%, respectively; all P < .05). Age-specific trends showed that, for all age groups, the lowest mortality was seen in June or July 2020, without additional improvement through February of 2021. Sex-specific trends (Figure 1c, Supplementary Table 4) showed that, for both men and women, in-hospital mortality was higher in August and September 2020, and again in November 2020 through February 2021, than in June 2020.
DISCUSSION
Using a national database, this study provides covariate-adjusted monthly trends in in-hospital mortality of inpatients with COVID-19 from April 2020 through February 2021. Like prior reports [2, 3], our study demonstrated that overall in-hospital mortality decreased approximately by half from 22.2% to 11.9% between April and June of 2020. We extended the observation period and showed that, from July 2020 through February 2021, there was no further decline, and instead, adjusted in-hospital mortality peaked twice and was significantly higher in all months except for July and October 2020 compared with June 2020. Our results are congruent with but extend the analytics posted by the CDC COVID tracker using the same database by including 30-day follow-up, requiring continuous data submission by hospitals, and adjusting for differences in important hospital and patient characteristics across time.
The explanation for persistently high in-hospital mortality among inpatients with COVID-19 is not clear. However, the peaks may be due at least in part to overcrowding in hospitals when cases surge. Kadri et al. [5] found that, between March and August 2020, surges in hospital COVID-19 caseload possibly eroded benefits gained from better treatments. Our study supports these findings by showing that adjusted in-hospital mortality peaked again between December 2020 and February 2021, when cases were surging.
These results are sobering, showing that, despite more time and experience in treating COVID-19, there has been no further decline in mortality among inpatients. The current study also adds to the literature by showing the differences in adjusted in-hospital mortality trend in different age groups and by sex, especially between November 2020 and February 2021. Continuous monitoring of COVID-19 mortality and exploration of effective ways to reduce mortality are warranted.
Supplementary Data
Supplementary materials are available at Clinical Infectious Diseases online. Consisting of data provided by the authors to benefit the reader, the posted materials are not copyedited and are the sole responsibility of the authors, so questions or comments should be addressed to the corresponding author.
Notes
Acknowledgments. The authors thank Ms. Denise Juliano and Ms. Myla Maloney for their support of the study and the PHD-SR data team for making the data available for analysis.
Disclaimer. The funder has no role in the design and conduct of the study; collection, management, analysis, and interpretation of the data; preparation, review, or approval of the manuscript; or decision to submit the manuscript for publication.
Financial support. This work was supported by Premier, Inc.
Potential conflicts of interest. All authors worked on the study as full-time employees of Premier, Inc. Z. C., N. A. R., and J. A. G. report owning stock in Premier, Inc. No other conflicts of interest exist. All authors have submitted the ICMJE Form for Disclosure of Potential Conflicts of Interest. Conflicts that the editors consider relevant to the content of the manuscript have been disclosed.

