


Abstract
Gram-negative bloodstream infections (BSIs) represent a significant complication facing allogeneic hematopoietic cell transplant (allo-HCT) recipients, as a result of intestinal translocation during neutropenia. In this study we sought to better understand how the composition of the intestinal microbiota is connected to risk of gram-negative BSIs, expanding on our prior work in these patients.
Fecal specimens were collected from recipients of allo-HCT and analyzed using 16S ribosomal RNA gene sequencing. Samples and clinical data extending from the pretransplant conditioning period through stem cell engraftment were used in the analysis. Intestinal domination (relative abundance ≥ 30%) by gram-negative bacteria was used as predictor of gram-negative BSI using Cox proportional hazards modeling. Further analysis of microbiota composition was performed at the genus level.
Seven hundred eight allo-HCT subjects were studied (7.5% developed gram-negative infection), with 4768 fecal samples for analysis. Gram-negative intestinal domination was associated with subsequent BSI, which was observed overall and individually at the genus level: Escherichia, Klebsiella, Enterobacter, Pseudomonas, and Stenotrophomonas. Fluoroquinolone prophylaxis was associated with decreased BSI and intestinal colonization by gram-negative microbes. In fluoroquinolone-prophylaxed patients, Escherichia coli was more frequently observed as breakthrough, both in terms of intestinal colonization and BSIs, compared with nonprophylaxed patients. Initial colonization by members of Ruminococcaceae and Bacteroidetes were associated with protection against gram-negative BSI.
Gram-negative intestinal colonization is highly predictive of BSI in the setting of allo-HCT. Fluoroquinolones appear to reduce these infections by influencing gut colonization.
Gram-negative bacteria have a high propensity for antibiotic resistance and are common causes of bloodstream infection (BSI). Although many bacterial phyla contain or consist of gram-negative bacteria, the Proteobacteria phylum is notorious for the frequency of BSIs. Many well-known genera and species with pathogenic potential exist within Gammaproteobacteria, including Escherichia coli, Klebsiella, Enterobacter, Citrobacter, Pseudomonas, or Stenotrophomonas. While many of these genera reside within the intestinal lumen and thus can be considered members of the microbiota, under normal circumstances they are present in low abundance.
Allogeneic hematopoietic cell transplantation (allo-HCT) is an intense, potentially curative treatment for a subset of malignancies that includes some leukemias and lymphomas and multiple myeloma. Because allo-HCT is associated with a transient period of intense immunocompromise, there is a high risk of bacterial infection. During the initial phase of allo-HCT, patients receive pretransplant conditioning, leading to neutropenia, mucosal barrier injury, and a particularly high risk of BSI. Gram-negative bacteria are one of the leading causes of bacteremia in allo-HCT patients in transplant centers across the United States and Europe, accounting for up to 65% of BSIs [1–3].
We previously examined the intestinal microbiota of patients undergoing allo-HCT by serially collecting and performing 16S ribosomal RNA (rRNA) sequence analyses of stool specimens, leading to the discovery that changes in the intestinal bacterial composition, in particular expansion of pathogens such as vancomycin-resistant Enterococcus, often precede BSIs. In this study, we extended our analysis by increasing the number of patients and the frequency of fecal sample collection, with a specific focus on gram-negative BSIs. Our analyses demonstrate the dynamic microbiota changes that occur during allo-HCT and identify clinical factors that shape those dynamics and influence the risk of gram-negative BSI.
METHODS
Adult patients undergoing allo-HCT at Memorial Sloan Kettering Cancer Center (MSKCC) were studied from 2009 to 2018. Participants were enrolled into a fecal collection banking study, where fecal samples were collected over the course of their initial transplant hospitalization. Samples were aliquoted and stored frozen within 24 hours of collection. This biospecimen bank has been described previously [4,–7]. Patients were excluded from study if they provided < 3 samples or if their first sample was not collected prior to hematopoietic cell infusion.
Fecal specimens and clinical variables were analyzed from the start of pretransplant conditioning (up to 15 days prior to hematopoietic cell transplantation), until engraftment (defined as absolute neutrophil count > 0.5 × 10⁹ cells/L for 3 consecutive days, after nadir). In a few instances, the observation period continued until death, discharge, or repeat transplantation, if they occurred prior to engraftment.
The study protocol was approved by the institutional review board at MSKCC; informed consent was obtained from all subjects prior to specimen collection. The study was conducted in accordance with the Declaration of Helsinki and the Strengthening the Reporting of Observational Studies in Epidemiology (STROBE) guidelines for observational cohort studies.
Stool Specimen Collection, Sequencing, and Analysis
DNA was extracted and purified from each fecal sample, and the V4–V5 region of the 16S rRNA gene was polymerase chain reaction (PCR)–amplified using modified universal bacterial primers. Purified PCR products were sequenced using the MiSeq Illumina platform.
DADA2 was used to perform quality filtering on resulting sequences, infer exact amplicon sequence variants (ASVs) resulting sequences, and filter and remove chimeras [8]. A small number of samples of insufficient quality (< 100 16S rRNA sequences) were excluded from the analysis. Taxonomic assignment to species level was performed using an algorithm incorporating nucleotide BLAST (Basic Local Alignment Search Tool) [9], with National Center for Biotechnology Information (NCBI) RefSeq [10] as reference training set. The ASV tables, taxonomic assignment, and sample metadata were assembled using the phyloseq package construct [11]. Construction of the sequence table and phyloseq object and all subsequent end-analyses were performed using R version 3.4 software (R Development Core Team, Vienna, Austria). Raw sequence data were uploaded and made available on the NCBI Short Read Archive (bioproject number PRJNA548153).
Statistical Analysis
Cause-specific Cox proportional hazards modeling was used to evaluate the clinical and microbiome predictors of gram-negative BSI. We analyzed time beginning 15 days prior to HCT, where observations were left-censored at the time of hospital admission. Analysis time continued through peritransplant neutropenia, until engraftment. Additional censoring was performed upon death, hospital discharge, or repeat transplantation. Intestinal domination, defined as a relative abundance of > 30% in a single taxon, was used to assess the microbiome as a predictor of gram-negative BSI. Initial colonization, defined as any detectable amount within the first collected sample, was also assessed in the model. In addition to these 2 microbiome variables, we also assessed the following clinical variables as predictors: age, sex, race, underlying disease, conditioning regimen intensity, hematopoietic cell source, human leukocyte antigen match, ex vivo T-cell depletion, prior history of gram-negative BSI, and administration of prophylactic antibiotics: fluoroquinolones, trimethoprim-sulfamethoxazole, and intravenous vancomycin. Proteobacteria domination and antibiotic administration variables were encoded as time-dependent predictors in the hazard model.
All predictors were first analyzed as univariate predictors of gram-negative BSI. Variables with a univariate P value < .2 were included in a multivariate model. We performed additional analysis between intestinal domination and risk of BSI at the individual genus and species level to characterize the specificity of the association for specific gram-negative groups. For these analyses involving rare events, we used logistic regression, to avoid likelihood convergence issues. In addition, Firth penalized likelihood was employed to minimize underestimation due to small sample bias and to further avoid convergence issues with monotone likelihood.
To identify microbiota features that were associated with either increased or decreased risk of domination, we employed linear discriminant analysis effect size (LEfSe) [12] on the microbiota of each subject’s initial sample, collected at the start of pretransplant conditioning, to predict Proteobacteria domination occurring in other samples collected subsequent to the initial sample. A Kruskal-Wallis P value cutoff of .05 and linear discriminant analysis cutoff of 2.0 was used. In an attempt to obtain a more robust, nonbiased microbiota survey assessment, we used fluoroquinolone prophylaxis (given 2 days prior to hematopoietic cell transplantation) as the subclass variable.
RESULTS
A total of 708 allo-HCT subjects (696 patients; 12 patients underwent allogeneic HCT on 2 separate occasions) met study criteria and were selected for analysis. Subjects were followed for a total of 16 907 patient-days (median, 22 days per patient). Over this period, a total of 4768 samples were collected (1 sample collected every 3.5 days, on average). A total of 200 658 526 high-quality 16S rRNA gene sequences were obtained for analysis (average, 42 084 per sample).
Table 1 shows the baseline clinical characteristics of participants, with separation by whether they received fluoroquinolone prophylaxis and their transplantation course. Between prophylaxed and nonprophylaxed subjects, there were modest differences in conditioning intensity, ex vivo T-cell depletion, time to engraftment, and other forms of antibiotic prophylaxis. Our institutional transplantation prophylaxis practices did change over time, in that routine ciprofloxacin prophylaxis for patients undergoing myeloablative and reduced intensity conditioning for all-HCT varied. Gram-negative BSIs occurred in 53 (7.5%) subjects; patients who received fluoroquinolone prophylaxis had fewer gram-negative BSIs compared with those who did not (6.3% vs 11.4%).
Clinical Characteristics of Subjects (N = 708a)
| Characteristic | No Fluoroquinolone Prophylaxis (n = 166) | Fluoroquinolone Prophylaxisb (n = 542) | Total (N = 708) | Fisher P Value |
|---|---|---|---|---|
| Age, y | ||||
| ≤ 29 | 6 (3.6) | 36 (6.6) | 42 (5.9) | .350 |
| 30–49 | 42 (25.3) | 141 (26.0) | 183 (25.8) | |
| ≥ 50 | 118 (71.1) | 365 (67.3) | 483 (68.2) | |
| Sex | ||||
| Female | 65 (39.2) | 207 (38.2) | 272 (38.4) | .855 |
| Male | 101 (60.8) | 335 (61.8) | 436 (61.6) | |
| Race | ||||
| White | 144 (86.7) | 436 (80.4) | 580 (81.9) | .161 |
| Black | 8 (4.8) | 47 (8.7) | 55 (7.8) | |
| Other | 14 (8.4) | 59 (10.9) | 73 (10.3) | |
| Underlying disease | ||||
| Leukemia | 87 (52.4) | 273 (50.4) | 360 (50.8) | .752 |
| Lymphoma | 29 (17.5) | 84 (15.5) | 113 (16.0) | |
| Myeloproliferative disorder | 6 (3.6) | 28 (5.2) | 34 (4.8) | |
| Other | 44 (26.5) | 157 (29.0) | 201 (28.4) | |
| Risk | ||||
| High | 52 (31.3) | 146 (26.9) | 198 (28.0) | .502 |
| Intermediate | 33 (19.9) | 123 (22.7) | 156 (22.0) | |
| Low/not applicable | 81 (48.8) | 273 (50.4) | 354 (50.0) | |
| HCT source | ||||
| Related identical | 48 (28.9) | 128 (23.6) | 176 (24.9) | .269 |
| Unrelated identical | 71 (42.8) | 225 (41.5) | 296 (41.8) | |
| Cord blood | 22 (13.3) | 103 (19.0) | 125 (17.7) | |
| Other | 25 (15.1) | 86 (15.9) | 111 (15.7) | |
| Conditioning intensity | ||||
| Myeloablative | 88 (53.0) | 284 (52.4) | 372 (52.5) | .004 |
| Reduced intensity | 51 (30.7) | 215 (39.7) | 266 (37.6) | |
| Nonmyeloablative | 27 (16.3) | 43 (7.9) | 70 (9.9) | |
| Graft manipulation: ex vivo T-cell depleted graft | 85 (51.2) | 220 (40.6) | 305 (43.1) | .020 |
| Time to engraftment ≥ 14 d | 38 (22.9) | 203 (37.5) | 241 (34.0) | .001 |
| Pre-HCT history of prior gram-negative BSI (60 d) | 3 (1.8) | 15 (3) | 18 (2.5) | .778 |
| Other prophylactic antibiotic administrationb | ||||
| TMP-SMX | 43 (25.9) | 182 (34) | 225 (31.8) | .070 |
| Vancomycin (IV) | 138 (83.1) | 518 (95.6) | 656 (92.7) | .000 |
| Gram-negative bloodstream infection detected | 19 (11.4) | 34 (6.3) | 53 (7.5) | .041 |
Data are presented as no. (%) unless otherwise indicated.
Abbreviations: BSI, bloodstream infection; HCT, hematopoietic cell transplantation; IV, intravenous; TMP-SMX, trimethoprim-sulfamethoxazole.
aSix hundred ninety-six individual patients; 12 patients underwent allogeneic HCT on 2 separate occasions.
bAll prophylaxis agents (fluoroquinolones, TMP-SMX, and vancomycin IV) were given starting HCT day −2 or earlier.
A total of 54 gram-negative BSIs occurred in this study cohort (1 patient developed 2 infections) and are described in Table 2. The specific organisms encountered (at genus level) were Escherichia, Klebsiella, Pseudomonas, Stenotrophomonas, Citrobacter, Sphingomonas, and Neisseria. The relative distribution of these organisms differed significantly depending on whether they received fluoroquinolone prophylaxis; Escherichia coli was more commonly observed in the most common gram-negative BSI, though it was more common within patients who received fluoroquinolone prophylaxis. In addition, fluoroquinolone resistance was also more common in the fluoroquinolone-prophylaxed group.
Gram-negative Blood Isolates (n = 54 Isolatesa)
| Variable and Category | No Fluoroquinolone Prophylaxis (n = 19) | Fluoroquinolone Prophylaxis (n = 35) | Total | Fisher P Value |
|---|---|---|---|---|
| Organism | ||||
| Escherichia | 31.6% (6/19) | 74.3% (26/35) | 32/54 (59.3%) | .006 |
| Klebsiella | 36.8% (7/19) | 8.6% (3/35) | 10/54 (18.5%) | |
| Enterobacter | 10.5% (2/19) | 2.9% (1/35) | 3/54 (5.6%) | |
| Pseudomonas | 10.5% (2/19) | 2.9% (1/35) | 3/54 (5.6%) | |
| Stenotrophomonas | 0.0% (0/19) | 5.7% (2/35) | 2/54 (3.7%) | |
| Citrobacter | 5.3% (1/19) | 0.0% (0/35) | 1/54 (1.9%) | |
| Otherb | 5.3% (1/19) | 5.7% (2/35) | 3/54 (5.6%) | |
| Fluoroquinolonec | ||||
| Susceptible | 72.2% (13/18) | 12.1% (4/33) | 17/51 (33.3%) | < .001 |
| Intermediate | 11.1% (2/18) | 0.0% (0/33) | 2/51 (3.9%) | |
| Resistant | 16.7% (3/18) | 87.9% (29/33) | 32/51 (62.7%) | |
| ESBL detectedc | 11.1% (2/18) | 30.3% (10/33) | 12/51 (23.5%) | .174 |
Abbreviation: ESBL, extended-spectrum β-lactamase.
aIsolated from 53 subjects; 1 subject developed a simultaneous Escherichia and Klebsiella bloodstream infection, all other blood isolates developed in individual subjects.
bOther gram-negative blood isolates consisted of Sphingomonas paucimobilis (n = 1) or Neisseria species (n = 2).
cIsolates in “Other” category were not assessed for fluoroquinolone susceptibility or ESBL production.
Analysis of microbiome and clinical predictors of gram-negative BSIs is shown in Table 3. Intestinal domination by Proteobacteria within the fecal samples was associated with subsequent gram-negative BSI; this was independent of other predictive factors, including age, sex, ex vivo T-cell depletion, history of gram-negative infection, antibiotic prophylaxis including fluoroquinolone administration, and initial Proteobacteria colonization. Fluoroquinolone administration itself was independently associated with decreased gram- negative infection.
Predictors of Gram-negative Bloodstream Infections
| Univariate | Multivariate | |||
|---|---|---|---|---|
| Predictor | HR (95% CI) | P Value | HR (95% CI) | P Value |
| Age (> 50 y) | 2.48 (1.29–5.31) | .005 | 2.83 (1.46–6.13) | .002 |
| Sex (female) | 0.52 (.27–.94) | .031 | 0.57 (.29–1.03) | .063 |
| Race (nonwhite) | 1.32 (.67–2.41) | .404 | … | |
| Underlying disease (leukemia vs other) | 0.90 (.52–1.54) | .693 | … | |
| Risk (high vs other) | 1.27 (.70–2.22) | .413 | … | |
| Intensity (MA vs other) | 1.20 (.70–2.08) | .498 | … | |
| Cord source | 1.36 (.70–2.48) | .345 | … | |
| HLA matched source | 0.93 (.54–1.65) | .795 | … | |
| T-cell depleted graft | 2.27 (1.31–4.02) | .004 | 1.95 (1.09–3.56) | .024 |
| Prior GNR BSI (60 d) | 2.68 (.74–6.87) | .120 | 2.26 (.61–5.95) | .194 |
| Fluoroquinolone administrationa | 0.44 (.25–.78) | .006 | 0.45 (.26–.81) | .009 |
| TMP-SMX administrationa | 0.64 (.33–1.17) | .150 | 0.66 (.33–1.24) | .207 |
| Vancomycin (IV) administrationa | 2.83 (.62–30.20) | .212 | … | |
| Initial Proteobacteria colonization | 2.01 (1.05–4.32) | .035 | 1.73 (.87–3.80) | .120 |
| Proteobacteria dominationa,b | 9.66 (5.44–16.75) | .000 | 7.52 (4.14–13.39) | .000 |
Abbreviations: BSI, bloodstream infection; CI, confidence interval; GNR, xxx; HLA, human leukocyte antigen; HR, hazard ratio; IV, intravenous; MA, xxx; TMP-SMX, trimethoprim-sulfamethoxazole.
aTime-dependent predictor.
bIntestinal domination: > 30% relative abundance.
To provide a compositional view of the intestinal microbiota, the genus-level peak relative abundances for Gammaproteobacteria and other bacteria are shown in Figure 1. Bacterial taxa that attained the highest abundances within the gut did include the same organisms we most commonly encountered observed as BSIs: Escherichia, Klebsiella, Enterobacter, Stenotrophomonas, Pseudomonas, and Citrobacter. In the subset of patients with gram-negative BSI, we observed a high degree of organism-specific concordance between peak abundances and BSI: Corresponding peak abundances were detectable in 85% (46 of 54) of BSIs, though the peak abundances varied in height. Higher peak abundances seemed more predictive for BSI; 24 (44%) of detected BSIs had achieved intestinal domination (> 30% relative abundance). We observed high abundances and percentage colonization in Serratia and Haemophilus; however, we did not detect BSIs with these microbes.
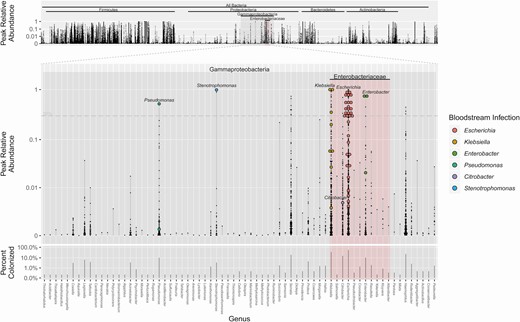
Peak relative abundances and concomitant bloodstream infection, by genus level. The maximum relative abundance (small black dot) achieved for each patient is shown for each genus. The primary middle plot shows genera within Gammaproteobacteria. In patients who developed a corresponding bloodstream infection with that strain, the peak abundance is represented by a colored circle. The top plot shows the peak abundances for all detectable genera. The bottom plot shows percentage of patients who had detectable colonization for each bacterial genus. Zero abundances are not shown. Forty-six of 54 bloodstream infections are shown here; for 8 infections, a corresponding microbiome signature was not found.
We further characterized the ability of microbiota domination to predict risk for BSIs for specific gram-negative organisms; these results are shown in Table 4. We analyzed associations between specific genus-level dominations and risk of corresponding BSIs for the 6 most common gram-negative infections within the Gammaproteobacteria class: Escherichia, Klebsiella, Enterobacter, Stenotrophomonas, Pseudomonas, and Citrobacter. We found strong associations with the corresponding gram-negative bloodstream isolate in 5 of these (all except Citrobacter). We further examined this using receiver operating characteristic curves, and found excellent concordance between relative abundance and BSI at the genus level (Supplementary Figure 1). Based on these curves, there was some variability in terms of optimal abundance cutoff for domination, depending on the taxonomic organism.
Predictiveness of Microbiota Domination for Specific Gram-negative Bloodstream Infections
| Gram-negative BSIs, OR (95% CI) | ||||||
|---|---|---|---|---|---|---|
| Intestinal Dominationa | Escherichia coli BSI (n = 32) | Klebsiella BSI (n = 10) | Enterobacter BSI (n = 3) | Stenotrophomonas BSI (n = 2) | Pseudomonas BSI (n = 3) | Citrobacter BSI (n = 1) |
| Escherichia coli (n = 50) | 21.7 (10.1–47.3) P < .001 | 6.4 (1.5–22.3) P = .088 | 1.9 (0–19.5) P = .718 | 2.6 (0–32.5) P = .634 | 1.9 (0–19.5) P = .718 | 4.3 (0–82.4) P = .490 |
| Klebsiella (n = 16) | 0.6 (0–4.7) P = .718 | 23.7 (5.3–90.2) P = .002 | 6 (0–65.3) P = .442 | 8.4 (.1–108.3) P = .405 | 6 (0–65.3) P = .442 | 14 (.1–272.2) P = .317 |
| Enterobacter (n = 6) | 5.8 (.6–30.4) P = .237 | 5.1 (0–48) P = .467 | 259.8 (29.1–3325.3) P < .001 | 21.6 (.2–303.1) P = .286 | 15.4 (.1–185) P = .317 | 36 (.2–745.6) P = .237 |
| Stenotrophomonas (n = 2) | 4.2 (0–52.4) P = .490 | 13.3 (.1–177) P = .317 | 40.2 (.3–642.5) P = .237 | 470.3 (27.4–10 281.7) P = .002 | 40.2 (.3–642.5) P = .237 | 94.1 (.6–2348.5) P = .237 |
| Pseudomonas (n = 1) | 6.9 (0–132.5) P = .442 | 22.1 (.1–441.3) P = .286 | 67.1 (.4–1529.3) P = .237 | 94.1 (.6–2348.5) P = .237 | 846.6 (36.6–137 439.9) P = .002 | 157 (.9–5033.8) P = .237 |
| Citrobacter (n = 2) | 4.2 (0–52.4) P = .490 | 13.3 (.1–177) P = .317 | 40.2 (.3–642.5) P = .237 | 56.4 (.4–1017.7) P = .237 | 40.2 (.3–642.5) P = .237 | 94.1 (.6–2348.5) P = .237 |
All P values were adjusted for multiple comparisons using Benjamini-Hochberg correction.
Abbreviations: BSI, bloodstream infection; CI, confidence interval; OR, odds ratio.
aDomination: relative abundance > 30%.
To gain a perspective on microbiota colonization and BSI over the course of the stem cell transplantation in the study cohort, we plotted the percentage of subjects with Proteobacteria domination and gram-negative BSI for each patient-day over the course of transplantation, along with percentages for neutropenia and inpatient hospitalization (Figure 2). Both BSIs and microbiota domination peaked 4–5 days posttransplantation.
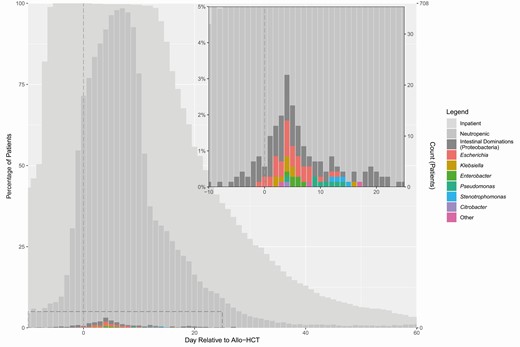
Timing of neutropenia, intestinal domination, and bloodstream infection. The plot and inset graph show the overall timing of inpatient hospitalization, neutropenia, intestinal domination by Proteobacteria, and gram-negative bloodstream infection, over the course of transplantation. Intestinal domination is depicted based on nondaily stool collection. Abbreviation: allo-HCT, allogeneic hematopoietic cell transplantation.
We examined the impact of fluoroquinolone prophylaxis on the intestinal microbiota, specifically with respect to Gammaproteobacteria (Figure 3). Overall, subjects who received fluoroquinolone prophylaxis had lower average abundances of specific gram-negative genera, including Klebsiella, Citrobacter, Enterobacter, and Desulfovibrio. On the other hand, other bacterial groups were unchanged or even increased in abundance, notably including Escherichia, but also Pseudomonas and Stenotrophomonas.
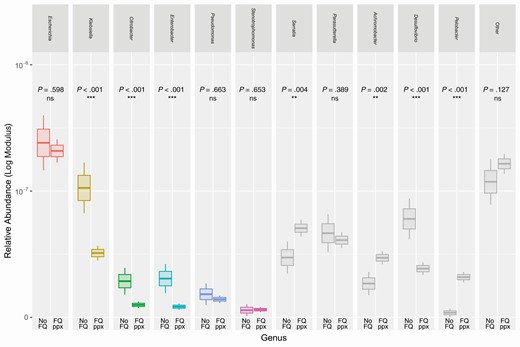
Differences in gram-negative abundance between subjects with and without fluoroquinolone prophylaxis. Boxplots show mean relative abundances of various gram-negative genera, comparing patients receiving fluoroquinolone prophylaxis to those who did not. These groups were tested for differences within each genus using Mann-Whitney U test (***P < .001, **P .001–.01, *P .01–.05). Gram-negative genera with highest abundances are shown; colored boxes represent gram-negative genera with observed potential for bloodstream infection. The upper and lower hinges denote 1 standard error from the mean, and the upper and lower whiskers denote 2 standard errors from the mean. Abbreviations: FQ, fluoroquinolone; ns, not significant; ppx, prophylaxis.
Finally, we examined microbiota composition of the initial fecal sample, collected prior to stem cell transplantation, for features associated with risk or protection against gram-negative domination, using LEfSe (Table 5). Members of Clostridia, notably Ruminococcaceae, and members of Bacteroidetes were associated with a lower risk of gram-negative intestinal domination.
Microbiota Biomarkers of Subsequent Gammaproteobacteria Domination, by Linear Discriminant Analysis Effect Size Analysis
| Prediction | Taxonomic Classification | Rank | Logarithmic LDA Score | Kruskal-Wallis P Value | Colonized |
|---|---|---|---|---|---|
| Decreased domination | Firmicutes|Clostridia|Clostridiales|Ruminococcaceae | Family | 4.0 | .013 | 67.8% |
| Decreased domination | Firmicutes|Clostridia|Clostridiales|Ruminococcaceae|Ruminococcus | Genus | 3.7 | .026 | 38.8% |
| Decreased domination | Firmicutes|Clostridia|Clostridiales|Ruminococcaceae|Flavonifractor | Genus | 3.1 | .010 | 37.7% |
| Decreased domination | Firmicutes|Clostridia|Clostridiales|Ruminococcaceae|Neglecta | Genus | 3.4 | .006 | 27.2% |
| Decreased domination | Firmicutes|Clostridia|Clostridiales|Clostridiales Family XIII Incertae Sedis | Family | 2.8 | .008 | 52.1% |
| Decreased domination | Bacteroidetes | Phylum | 3.9 | .025 | 70.8% |
| Decreased domination | Bacteroidetes|Bacteroidia | Class | 4.0 | .026 | 70.3% |
| Decreased domination | Bacteroidetes|Bacteroidia|Bacteroidales | Order | 4.0 | .026 | 70.3% |
| Increased domination | Proteobacteria | Phylum | 3.7 | .010 | 62.9% |
| Increased domination | Proteobacteria|Gammaproteobacteria | Class | 3.7 | < .001 | 50.5% |
| Increased domination | Proteobacteria|Gammaproteobacteria|Enterobacterales | Order | 3.7 | < .001 | 45.6% |
| Increased domination | Proteobacteria|Gammaproteobacteria|Enterobacterales|Enterobacteriaceae | Family | 3.7 | < .001 | 36.6% |
| Increased domination | Firmicutes|Bacilli | Class | 4.1 | .048 | 98.5% |
| Increased domination | Firmicutes|Bacilli|Lactobacillales | Order | 4.2 | .046 | 98.3% |
| Increased domination | Firmicutes|Bacilli|Lactobacillales|Streptococcaceae|Streptococcus | Genus | 4.2 | .037 | 92.7% |
Linear discriminant analysis effect size analysis accounted for fluoroquinolone prophylaxis by employing it as the subclass variable. An LDA cutoff of 2.0 and a Kruskal-Wallis P value cutoff of .05 were used.
Abbreviation: LDA, linear discriminant analysis.
DISCUSSION
Under normal circumstances, Proteobacteria exist as minority members within a healthy gut microbiota, typically representing approximately 1% of all bacterial inhabitants [13]. Yet, members of this phylum cause a major share of infections, in particular those involving or originating from the gut. The specific manner and circumstances by which these bacterial species invade the bloodstream and provoke sepsis is of great interest, and determining mechanisms of expansion in the gut and invasion of the bloodstream may lead to new approaches to better manage patients at risk for these infections, including allo-HCT recipients.
We previously studied the intestinal microbiota in patients undergoing allo-HCT and observed that intestinal domination by Proteobacteria was associated with a 5-fold increased risk of gram-negative BSI [5]. In the current study, we performed a broader but more focused and deeper examination of gram-negative BSIs and the dynamics of Proteobacteria within the intestinal microbiota. In this instance, we had access to a much larger prospective specimen cohort, with more frequent sample collection (708 subjects/4768 samples, compared with 94 subjects/439 samples previously), which allowed us to study gram-negative infections in greater detail.
We were able to further identify strong links between the microbiota and BSI for individual genera including Escherichia, Klebsiella, Enterobacter, Pseudomonas, and Stenotrophomonas. By doing this, we observed a substantial increase in the magnitude of association, thus adding support to these observed microbiota changes as important mediator states within the causal pathway of gram-negative BSI during chemotherapy-induced neutropenia.
In predicting BSIs, we used a relative abundance cutoff of 30% to define domination within the intestinal microbiota. This was perhaps arbitrarily defined, but based on our prior work [5]. Based on our examination of operating characteristics in this study, the optimal cutoff for BSI prediction appeared to vary between different gram-negative organisms.
While we observed a very close association between the presence of gram-negative bacteria in the gut and BSIs, not all gram-negative intestinal dominations led to a matching BSI. We suspect that these patients either did not have a sufficient degree of mucosal barrier injury to develop bacterial translocation into the bloodstream, developed translocation into bloodstream but were not diagnosed by clinical blood culture testing, or were colonized by less virulent or invasive strains of Proteobacteria. With respect to not detecting BSIs by blood cultures, prior studies report that microbiologic confirmation of BSI occurs in only 10%–25% of febrile episodes in the setting of neutropenia [14]. Conversely, some gram-negative BSIs were not associated with expansion of the corresponding microbe in fecal samples. In some cases, this may have resulted from infrequent sample collection around the time of BSI. We did observe instances where intestinal domination was short-lived and only lasted 1 day, suggesting that there might be cases where domination is missed.
Three subjects developed BSI reported as either Sphingomonas paucimobilis or Neisseria species, which also were not detected in corresponding samples. These organisms are members of Alphaproteobacteria and Betaproteobacteria, respectively, in contrast to all other proteobacterial blood isolates, which were members of the far more abundant Gammaproteobacteria. Nevertheless, both organisms are known to colonize the gut [13], and we did detect these organisms in fecal samples of other subjects. Though we are finding that most gram-negative bloodstream are associated with the expansion of the corresponding Proteobacteria in the intestinal tract, a subset of gram-negative BSIs might possibly originate from other sources during chemotherapy-induced neutropenia, such as the respiratory or urinary tract or contamination of a central venous or arterial catheter.
We also examined the effects of fluoroquinolone administration. At our center, prophylaxis is currently routinely administered during peritransplant neutropenia. However, this practice varied over the course of the last decade, and we saw this as an opportunity to study its impact on the profile of infections and intestinal microbiota. In this population, we found that fluoroquinolone prophylaxis was associated with a 55% decrease in incidence of gram-negative BSIs (11.4% to 6.3%; number needed to treat, 20), but with a higher degree of resistance in the breakthrough infections. This result is consistent with prior studies of fluoroquinolone prophylaxis [15].
Our observations provide evidence that fluoroquinolone prophylaxis lowers the rate of proteobacterial domination, consistent with the reduced incidence of gram-negative BSIs. Our findings suggest that fluoroquinolone prophylaxis primarily exerts its effect at the level of reducing intestinal microbiota colonization by Gammaproteobacteria, though the independent effect of fluoroquinolones in the Cox model may suggest an additional degree of direct protection at the level of the bloodstream.
Interestingly, fluoroquinolone prophylaxis was associated with a higher relative proportion of E. coli, both in terms of microbiota domination within the gut, as well as BSIs. This suggests that the selective pressures of fluoroquinolone prophylaxis alter gram-negative abundances within the intestinal tract, which in turn shapes the breakthrough infections seen.
In our exploration of potential predictive microbiota biomarkers, we found that members of Clostridia (particularly Ruminococcaceae) and Bacteroidetes were associated with decreased risk of gram-negative domination. These groups comprise a healthy gut microbiota, and have both been shown to contribute to colonization resistance [6]. Recent studies have demonstrated that acidification of the lower gastrointestinal tract and production of acetate and butyrate can suppress the growth of E. coli, Klebsiella pneumoniae, and Proteus mirabilis in the gut [16]. Bacterial taxa such as the Bacteroidetes and Ruminococcaceae can break down and ferment fiber, thereby producing short-chain fatty acids that inhibit growth of Gammaproteobacteria.
Taxa that were correlated with increased gram-negative domination included bacteria within Gammaproteobacteria, including Enterobacteriaceae, and Bacilli, including Streptococcus. The fact that initial gram-negative colonization signifies increased risk of subsequent domination is not surprising. Perhaps noteworthy is the fact that Bacilli were associated with increased risk of gram-negative domination. The Bacilli class includes gram-positive bacteria such as Staphylococcus, Streptococcus, and Enterococcus and, unlike Clostridia and Bacteroidetes, is not associated with colonization resistance. Prior studies have shown that permissive co-colonization between members of Bacilli and Gammaproteobacteria can occur [17].
In conclusion, our study highlights the gut origins of gram-negative BSIs during neutropenia in patients undergoing allo-HCT. The connection between the intestinal microbiota composition and risk for bacteremia allows us to better understand the pathogenesis of BSI. Enhanced understanding of the factors contributing to the risk of bacteremia may help to devise strategies to prevent these complications or to develop prognostic or diagnostic testing that predict the infectious risk.
Supplementary Data
Supplementary materials are available at Clinical Infectious Diseases online. Consisting of data provided by the authors to benefit the reader, the posted materials are not copyedited and are the sole responsibility of the authors, so questions or comments should be addressed to the corresponding author.
Notes
Acknowledgments. The authors thank Emily Fontana, Luigi Amoretti, and Roberta Wright for their technical assistance.
Financial support. This work was supported by the National Institute of Allergy and Infectious Diseases at the National Institutes of Health (grant numbers U01 Al124275 and R01 AI137269 to Y. T.) and the National Cancer Institute at the National Institutes of Health (grant number P30 CA008748).
Potential conflicts of interest. J. U. P. receives research support and licensing fees from Seres Therapeutics. M. R. M. B. has received speaker’s honoraria from Flagship Ventures, Novartis, Evelo, Jazz Pharmaceuticals, Therakos, Amgen, Merck & Co, and the Acute Leukemia Forum; is an advisor for and receives research support and licensing fees from Seres Therapeutics; receives licensing fees from Juno Therapeutics; and serves on the Deutsche KnochenMarkSpenderdatei Medical Council Board. E. G. P. has received speaker’s honoraria from Bristol-Myers Squibb, Celgene, Seres Therapeutics, MedImmune, Novartis, and Ferring Pharmaceuticals; is an inventor on patent application number WPO2015179437A1 (“Methods and compositions for reducing Clostridium difficile infection”) and number WO2017091753A1 (“Methods and compositions for reducing vancomycin-resistant enterococci infection or colonization)”; and holds patents that receive royalties from Seres Therapeutics. S. G. has received grants from Celgene, Takeda, Actinuum, Johnson & Johnson, Sanofi, and Amgen. All other authors report no potential conflicts of interest.
All authors have submitted the ICMJE Form for Disclosure of Potential Conflicts of Interest. Conflicts that the editors consider relevant to the content of the manuscript have been disclosed.

