


Abstract
Accelerate Pheno blood culture detection system (AXDX) provides rapid identification and antimicrobial susceptibility testing results. Limited data exist regarding its clinical impact. Other rapid platforms coupled with antimicrobial stewardship program (ASP) real-time notification (RTN) have shown improved length of stay (LOS) in bacteremia.
A single-center, quasi-experimental study of bacteremic inpatients before and after AXDX implementation was conducted comparing clinical outcomes from 1 historical and 2 intervention cohorts (AXDX and AXDX + RTN).
Of 830 bacteremic episodes, 188 of 245 (77%) historical and 308 (155 AXDX, 153 AXDX + RTN) of 585 (65%) intervention episodes were included. Median LOS was shorter with AXDX (6.3 days) and AXDX + RTN (6.7 days) compared to historical (8.1 days) (P = .001). In the AXDX and AXDX + RTN cohorts, achievement of optimal therapy (AOT) was more frequent (93.6% and 95.4%, respectively) and median time to optimal therapy (TTOT) was faster (1.3 days and 1.4 days, respectively) compared to historical (84.6%, P ≤ .001 and 2.4 days, P ≤ .001, respectively). Median antimicrobial days of therapy (DOT) was shorter in both intervention arms compared to historical (6 days each vs 7 days; P = .011). Median LOS benefit during intervention was most pronounced in coagulase-negative Staphylococcus bacteremia (P = .003).
LOS, AOT, TTOT, and total DOT significantly improved after AXDX implementation. Addition of RTN did not show further improvement over AXDX and an already active ASP. These results suggest that AXDX can be integrated into healthcare systems with an active ASP even without the resources to include RTN.
Timely and appropriate antimicrobial selection in sepsis is critical for patient survival [1]. Advances in laboratory technology including molecular rapid diagnostic testing (mRDT) systems [2] have improved patient care over conventional techniques [3].
Identification (ID) of blood culture isolates by matrix-assisted laser desorption/ ionization–time-of-flight mass spectrometry (MALDI-TOF MS) or peptide nucleic acid fluorescent in situ hybridization combined with antimicrobial stewardship program (ASP) real-time notification (RTN) can improve clinical outcomes [4–10]. Similarly, multiplex polymerase chain reaction (PCR)–based technology coupled with genotypic antimicrobial resistance markers can improve clinical outcomes for bloodstream infections (BSIs) with ASP-RTN [11–15]. However, the understanding of mRDT clinical benefit without intimate ASP involvement is lacking [16–18].
The Accelerate Pheno (AXDX) mRDT utilizes fluorescent in situ hybridization for microorganism ID (1.5 hours) from positive blood cultures with morphokinetic cellular analysis and automated microscopy for phenotypic antimicrobial susceptibility testing (AST) (7 hours). While AXDX time to ID is similar to other mRDT platforms, phenotypic AST results are provided significantly faster than conventional phenotypic methods [19–28].
While AXDX has shown improved time to optimal therapy (TTOT) [29, 30], the extent of clinical impact has not been well established. We sought to determine clinical impact of AXDX at an academic medical center with an ASP already in place but no genotypic-based mRDT. We also sought to assess the impact of real-time notification of AXDX results compared to standard ASP practice.
METHODS
Study Design
A pre–post, quasi-experimental, observational study was performed at a 509-bed hospital in Little Rock, Arkansas. The institutional review board determined this to be nonhuman research. Electronic medical records (EMRs) of adult inpatients with positive blood cultures during February 2017–September 2018 were reviewed. The first positive blood culture per patient per admission was considered a bacteremic episode. Inclusion criteria included ≥ 18 years of age, blood cultures obtained during encounter, no known positive blood culture prior to admission, no previous bacteremia during admission, and an AXDX “on-panel” organism (Supplementary Data). Patients were excluded for mixed BSI as well as discharge, death, or entering hospice care before final AST. The historical cohort comprised episodes in 2017 prior to AXDX implementation and served as controls. Intervention cohorts included 2 arms of bacteremic episodes in 2018 performed on AXDX (Accelerate Diagnostics, Tucson, Arizona). After implementation of AXDX into our laboratory and education of medical staff, there was a 6-week washout period before intervention started.
Throughout the study, an ASP member monitored a positive blood culture list at least once daily, providing feedback to providers Monday through Friday as part of normal ASP workflow. This ASP has 1.0 and 0.5 full-time equivalents for infectious diseases pharmacy and physician support, respectively. The majority of antibiotic review is audit and feedback with limited prior authorization.
Historical Period
Blood cultures were incubated in the BACT/ALERT 3D system (bioMérieux, Durham, North Carolina). Laboratory staff called Gram stain results to nursing staff (Figure 1). PBP2A latex agglutination testing was available for Staphylococcus aureus isolates. Organism ID/ASTs were performed using VITEK MS and VITEK2 (bioMérieux). While the microbiology laboratory operated 24/7, overnight AST results were verified and reported in the EMR the following morning. Routine ASP workflow did not include an RTN process.
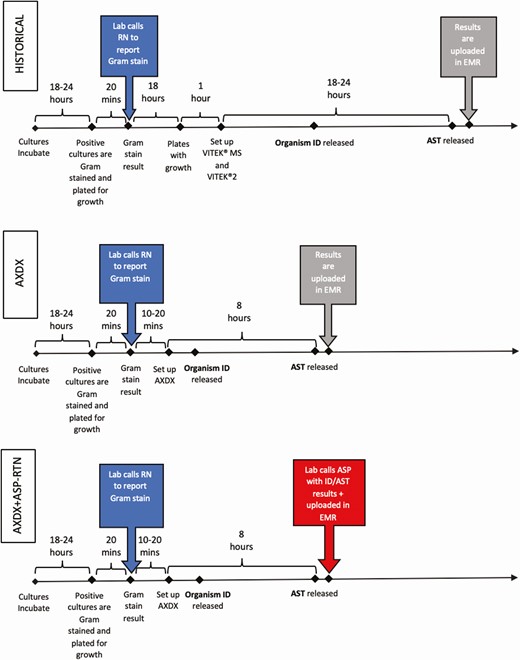
Microbiology workflow during the historical, Accelerate Pheno blood culture detection system (AXDX), and AXDX + real-time notification arms. Active Gram stain result notifications are highlighted on left in dark gray. Passive result notification by uploading data to the electronic medical record are highlighted in light gray. Active final antimicrobial susceptibility testing result notification is highlighted on bottom right in dark gray. These are theoretical times for illustration and not measured values. Abbreviations: ASP, antimicrobial stewardship program; AST, antimicrobial susceptibility testing; AXDX, Accelerate Pheno blood culture detection system; EMR, electronic medical record; ID, identification; RN, registered nurse; RTN, real-time notification.
Intervention Period
Blood culture incubation and Gram stain notification were identical to the historical period. If Gram stain revealed gram-positive cocci (GPC) or gram-negative rods (GNRs), ID/AST was performed using AXDX whereas others were evaluated by traditional methods. AXDX was available 24/7 but only performed on the first positive blood culture bottle from a specific patient in a 5-day period. Overnight results were verified the following morning and placed into the EMR. AST from AXDX was not routinely reported on coagulase-negative staphylococci (CoNS) other than Staphylococcus lugdunensis. Bacteremic episodes during the intervention period were split into 2 arms based on how AXDX ID/AST results were communicated per an alternating weekly schedule (Figure 1). Organisms not identified by AXDX were not included in the analysis.
Intervention 1 (AXDX): Laboratory personnel reported AXDX results in the EMR per laboratory workflow. The ASP reviewed results during review of a positive blood culture list Monday through Friday, without RTN, and performed interventions as appropriate.
Intervention 2 (AXDX + RTN): Laboratory personnel called the ASP with RTN of AXDX results 9 am to 5 pm, 7 days per week, with overnight batched results called each morning. The ASP performed interventions at the time of notification as appropriate.
Data Collection and Definitions
Monomicrobial “on-panel” bacteremic episodes were identified via TheraDoc software (Premier, Inc, Salt Lake City, Utah) during the historical period and via AXDX software during intervention. Patient demographics, comorbidities, specific medications, antibiotic administration data, laboratory data, microbiological data, and clinical data were extracted from the EMR using REDCap database [31].
Microbial contaminants were defined per laboratory guidelines (ie, 1 of 2 sets positive for an organism rarely pathogenic such as CoNS, Micrococcus, Corynebacterium, or Bacillus species non-anthracis) adopted from previously published recommendations [32] or by medical records review. If thought to be a true contaminant, the ASP team would intervene as clinically appropriate. The modified early warning score (MEWS) within 48 hours of blood culture collection was used as a marker of clinical severity as it is associated with increased risk of death [33]. Achievement of optimal therapy (AOT) was determined retrospectively by an infectious disease physician (R. K. D., C. P.) or infectious disease pharmacist (K. L.) based on the ASP’s treatment protocols and common consensus scenarios developed prior to study (Supplementary Data). TTOT was the time from blood culture collection to when therapy was determined to be optimal. If empiric therapy was determined to be optimal, TTOT was based on the time of empiric therapy initiation or blood culture collection, whichever was later. Antimicrobial days of therapy (DOT) were counted following blood culture collection. Antibiotic classifications are listed in the Supplementary Data.
Outcomes
Primary outcomes were hospital length of stay (LOS), hospital LOS following culture collection, intensive care unit (ICU) LOS, and ICU LOS following culture collection. Secondary clinical outcomes were AOT, TTOT from culture collection, DOT, development of Clostridioides difficile infection within 90 days of bacteremia, in-hospital hospice care, and in-hospital mortality. Secondary analyses of these outcomes were performed on pathogen subgroups: GPC (excluding CoNS), CoNS, and GNR.
Laboratory outcomes included time from culture collection to Gram stain, ID, and AST; time from Gram stain to ID and AST; and time from ID to AST.
Statistical Analysis
Utilizing SAS version 9.4 software (SAS Institute, Cary, North Carolina), baseline characteristics and comparisons among the 3 groups were performed using 1-way analysis of variance and the Kruskal-Wallis test for parametric and nonparametric continuous variables, respectively, and χ 2 and Fisher exact tests for categorical variables as appropriate. Significant tests were further assessed using Wilcoxon rank-sum test or χ 2 test as appropriate for pairwise comparison.
RESULTS
Of 830 episodes reviewed, 188 during the historical period and 308 (155 AXDX and 153 AXDX + RTN) during the intervention period met the inclusion criteria (Figure 2). Patient demographics, comorbidities, and illness severity were similar between groups with the exception of the AXDX + RTN group being slightly younger (Table 1).
Baseline Patient Demographics, Clinical Characteristics, and Comorbidities
| Characteristic | Historical Cohort (n = 188) | AXDX Cohort (n = 155) | AXDX + RTN Cohort (n = 153) | P Value |
|---|---|---|---|---|
| Demographics | ||||
| Age, y, mean (SD) | 60.7 (16.6) | 58.9 (16.9) | 56.2 (17.2)a | .048 |
| Female sex | 91 (48.4) | 82 (52.9) | 76 (49.7) | .700 |
| Race | .315 | |||
| African American | 51 (27.1) | 58 (37.4) | 48 (31.4) | |
| White | 129 (68.6) | 89 (63.4) | 97 (63.4) | |
| ICU admission | 88 (46.8) | 61 (39.4) | 70 (45.8) | .342 |
| MEWS | .483 | |||
| < 4 | 70 (37.2) | 67 (43.2) | 56 (36.6) | |
| ≥ 4 | 117 (62.3) | 88 (56.8) | 97 (63.4) | |
| Comorbidities | ||||
| Coronary heart disease | 38 (20.2) | 19 (12.3) | 20 (13.1) | .078 |
| Congestive heart failure | 24 (12.8) | 13 (8.4) | 14 (9.2) | .355 |
| Cerebrovascular disease | 20 (10.6) | 12 (7.7) | 18 (11.8) | .478 |
| Cirrhosis | 11 (5.9) | 16 (10.3) | 8 (5.2) | .156 |
| Chronic kidney disease | 34 (18.1) | 23 (14.8) | 24 (15.7) | .697 |
| Chronic kidney disease–dialysis | 14 (41.2) | 7 (30.4) | 7 (29.2) | .566 |
| COPD | 16 (8.5) | 12 (7.7) | 10 (6.5) | .792 |
| Diabetes mellitus | 58 (30.9) | 43 (27.7) | 36 (23.5) | .323 |
| Immunosuppressed | 71 (37.8) | 52 (33.6) | 55 (36.0) | .720 |
| Solid organ malignancy | 41 (21.8) | 24 (15.5) | 32 (20.9) | .298 |
| Leukemia | 24 (12.8) | 20 (12.9) | 13 (8.5) | .377 |
| Solid organ transplant | 4 (2.1) | 5 (3.2) | 6 (3.9) | .577 |
| Bone marrow transplant | 6 (3.2) | 6 (3.9) | 1 (0.7) | .159 |
| HIV/AIDS | 1 (0.5) | 3 (1.9) | 1 (0.7) | .528 |
| Neutropenic | 30 (16.0) | 27 (17.4) | 27 (17.7) | .901 |
| Immunosuppressant medications | 24 (12.8) | 13 (8.4) | 14 (9.2) | .355 |
Data are presented as no. (%) unless otherwise indicated. Statistically significant values are highlighted in bold (P ≤ .05).
Abbreviations: AXDX, Accelerate Pheno system; COPD, chronic obstructive pulmonary disease; HIV, human immunodeficiency virus; ICU, intensive care unit; MEWS, modified early warning score; RTN, real-time notification; SD, standard deviation.
aStatistically significant (P ≤ .05) compared to historical cohort.
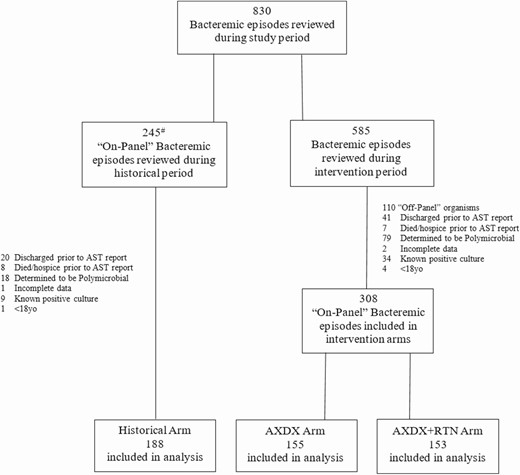
Flowchart of bacteremic episodes during study period. aCultures during historical period with either “off-panel” organisms or obvious polymicrobial growth were not reviewed for inclusion. Abbreviations: AST, antimicrobial susceptibility testing; AXDX, Accelerate Pheno blood culture detection system; RTN, real-time notification.
Except for skin and soft tissue infections being more prevalent in the intervention groups (P = .049), bacteremia sources were similar (Table 2). Gram-positive organisms (74%) were frequently isolated, followed by gram-negative organisms (23%) and Candida (3%). CoNS (46%), S. aureus (15%), and Escherichia coli (14%) were the most common organisms identified. There was no statistical difference in pathogen identification between cohorts (P = .32; Table 2).
Presumed Source of Bacteremia and Microbiological Findings
| Source and Organism | Historical Cohort (n = 188) | AXDX Cohort (n = 155) | AXDX + RTN Cohort (n = 153) | P Value |
|---|---|---|---|---|
| Presumed source of bacteremia | ||||
| Contaminant | 66 (35.1) | 66 (42.6) | 69 (45.1) | .144 |
| Line infection | 28 (14.9) | 12 (7.7) | 16 (10.5) | .106 |
| Urosepsis | 18 (9.6) | 17 (10.4) | 20 (13.1) | .571 |
| Bone/joint infection | 12 (6.4) | 9 (5.8) | 8 (5.2) | .903 |
| Pulmonary sepsis | 10 (5.3) | 4 (2.6) | 4 (2.6) | .260 |
| SSTI | 2 (1.1) | 9 (5.8)a | 7 (4.6)a | .049 |
| ICD/PPM infection | 1 (0.5) | 2 (1.3) | 0 (0.0) | .341 |
| Otherb | 51 (27.1) | 39 (25.2) | 29 (19.0) | .197 |
| Organisms identified | ||||
| Staphylococcus aureus | 35 (18.6) | 20 (12.9) | 17 (11.1) | .117 |
| MSSA | 21 (60.0) | 8 (40.0) | 8 (47.1) | .332 |
| MRSA | 14 (40.0) | 12 (60.0) | 9 (52.9) | .332 |
| CoNS spp | 79 (42.0) | 75 (48.4) | 76 (49.7) | .309 |
| Streptococcus spp | 9 (4.8) | 15 (9.7) | 15 (9.8) | .138 |
| Enterococcus faecalis | 8 (4.3) | 7 (4.5) | 2 (1.3) | .230 |
| Enterococcus faecium | 2 (1.1) | 4 (2.6) | 2 (1.3) | .667 |
| Escherichia coli | 26 (13.8) | 19 (12.3) | 22 (14.4) | .851 |
| Klebsiella spp | 15 (8.0) | 4 (2.6) | 7 (4.6) | .079 |
| Enterobacter spp | 3 (1.6) | 2 (1.3) | 2 (1.3) | .964 |
| Proteus spp | 2 (1.1) | 3 (1.9) | 1 (0.7) | .681 |
| Citrobacter spp | 1 (0.5) | 0 (0.0) | 0 (0.0) | 1.000 |
| Pseudomonas aeruginosa | 2 (1.1) | 3 (1.9) | 0 (0.0) | .282 |
| Acinetobacter spp | 1 (0.5) | 0 (0.0) | 1 (0.7) | .763 |
| Candida glabrata | 4 (2.1) | 1 (0.7) | 4 (2.6) | .408 |
| Candida albicans | 1 (0.5) | 2 (1.3) | 4 (2.6) | .273 |
Data are presented as no. (%) unless otherwise indicated. Statistically significant values are highlighted in bold (P ≤ .05).
Abbreviations: AXDX, Accelerate Pheno system; CoNS, coagulase-negative staphylococci; ICD/PPM, implantable cardioverter-defibrillator/permanent pacemaker; MRSA, methicillin-resistant Staphylococcus aureus; MSSA, methicillin-sensitive Staphylococcus aureus; RTN, real-time notification; SSTI, skin and soft tissue infection.
aStatistically significant (P ≤ .05) compared to historical cohort.
bIntra-abdominal, central nervous system, or unknown.
Mean time to culture positivity was similar between the historical and combined intervention arms (22.4 ± 12.8 hours vs 22.2 ± 12.0 hours; P = .84). Mean time from collection to ID (56.9 ± 21.7 hours vs 29.9 ± 15.9 hours; P < .001) and AST (73.6 ± 21.0 hours vs 37.1 ± 21.4 hours; P < .001) were significantly faster following AXDX implementation compared with the historical cohort, decreasing mean laboratory turnaround time (TAT) by 37 hours (Figure 3). TAT was similar for the AXDX and AXDX + RTN groups (Supplementary Data).
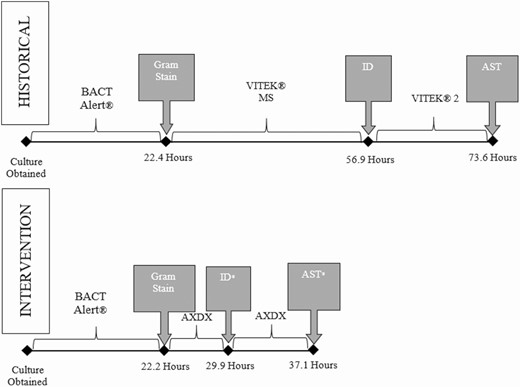
Mean microbiology laboratory turnaround time for positive blood cultures during historical and Accelerate Pheno blood culture detection system intervention periods. *Statistically (P < .05) different compared to historical arm. Abbreviations: AST, antimicrobial susceptibility testing; AXDX, Accelerate Pheno blood culture detection system; ID, identification.
Of 153 bacteremias during AXDX + RTN, ASP recommended 73 (47.7%) interventions with 85% acceptance. Mean time from RTN to intervention was 2.2 hours, and 52 (71.2%) were either antimicrobial de-escalation or discontinuation; however, recommendations varied by pathogen group (Supplementary Data).
Table 3 shows shorter median LOS in the AXDX and AXDX + RTN groups (6.3 days and 6.7 days, respectively) compared to the historical cohort (8.1 days) (P = .001), with no significant difference between the intervention cohorts. Likewise, median LOS following culture collection was shorter in the AXDX and AXDX + RTN groups (5.9 days and 6.1 days, respectively) compared to the historical cohort (6.8 days) (P = .007). There was no difference in total ICU LOS or ICU LOS following culture between the 3 groups.
Clinical Outcomes
| Outcome | Historical Cohort (n = 188) | AXDX Cohort (n = 155) | AXDX + RTN Cohort (n = 153) | P Value |
|---|---|---|---|---|
| LOS | ||||
| Hospital LOS | 8.1 (5.1–15.0) | 6.3 (3.7–10.9)a | 6.7 (3.8–11.0)a | ≤ .001 |
| Hospital LOS following culture collection | 6.8 (4.5–10.3) | 5.9 (3.5–9.0)a | 6.1 (3.6–9.2)a | .007 |
| ICU LOS | 2.7 (1.2–6.3) | 2.7 (1.4–6.0) | 2.7 (1.7–4.9) | .956 |
| ICU LOS following culture collection | 2.6 (1.0–4.5) | 2.7 (1.3–5.0) | 2.4 (1.6–4.7) | .799 |
| Optimal therapy | ||||
| Achieved optimal therapy, No. (%) | 159 (84.6) | 145 (93.6)a | 146 (95.4)a | ≤ .001 |
| TTOT following culture collection | 2.4 (0.3–3.5) | 1.3 (0.1–2.2)a | 1.4 (0.1–2.0)a | ≤ .001 |
| CDI within 90 days, No. (%) | 6 (3.2) | 8 (5.2) | 12 (7.8) | .159 |
| In-hospital transition to hospice care, No. (%) | 12 (6.4) | 15 (9.7) | 10 (6.5) | .447 |
| In-hospital mortality, No. (%) | 15 (8.0) | 11 (7.1) | 12 (7.8) | .949 |
Data are presented as median days (interquartile range) unless otherwise indicated. Statistically significant values are highlighted in bold (P ≤ .05).
Abbreviations: AXDX, Accelerate Pheno system; CDI, Clostridioides difficile infection; ICU, intensive care unit; LOS, length of stay; RTN, real-time notification; TTOT, time to optimal therapy.
aStatistically significant (P ≤ .05) compared to historical cohort.
Optimal therapy was achieved more frequently in the AXDX and AXDX + RTN groups (93.6% and 95.4%, respectively) compared to the historical cohort (84.6%) (P < .001), as well as more quickly (median TTOT, 1.3 days and 1.4 days, respectively) compared to the historical cohort (2.4 days) (P < .001; Table 3). AOT and TTOT did not differ between intervention cohorts.
Median antimicrobial DOT was shorter in the intervention groups compared to historical (6 days each vs 7 days; P = .011) as was broad gram-negative DOT (3 days each vs 4 days; P = .006). Pairwise comparison revealed that AXDX + RTN patients received less broad gram-positive antibiotics compared to the historical cohort (median, 2 days vs 3 days; P = .015) and more narrow β-lactams (median 2 days vs 0 days; P = .017) compared with patients in the AXDX-alone cohort (Table 4). Pairwise comparison revealed lower median vancomycin use in the AXDX + RTN group compared with the historical cohort (3 days vs 4 days, respectively; P = .010); however, this decrease in the AXDX group was not significantly different from the historical cohort.
Antimicrobial Utilization (Days of Therapy) Following Culture Collection
| Antimicrobial | Historical Cohort (n = 188) | AXDX Cohort (n = 155) | AXDX + RTN Cohort (n = 153) | P Value |
|---|---|---|---|---|
| Total antimicrobial | 7 (5–10) | 6 (4–9)a | 6 (4–10)a | .011 |
| Broad gram-positive | 3 (2–6) | 2 (1–6) | 2 (1–5)a | .046 |
| Vancomycin | 4 (2–6) | 3 (2–6) | 3 (2–6)a | .027 |
| Daptomycin | 1 (1–14) | 2 (1–7) | 3 (1–6) | .850 |
| Linezolid | 3 (3–6) | 5 (3–5) | 4 (2–6) | .815 |
| Broad gram-negative | 4 (2–8) | 3 (1–7)a | 3 (1–6)a | .006 |
| Ciprofloxacin | 1 (1–2) | 1 (1–3) | 4 (1–6) | .696 |
| Levofloxacin | 2 (1–3) | 2 (1–4) | 1 (1–5) | .825 |
| Piperacillin-tazobactam | 4 (3–5) | 3 (2–4) | 3 (2–6) | .137 |
| Cefepime | 4 (2–5) | 3 (1–5) | 3 (2–5) | .274 |
| Ertapenem | 1 (1–2) | 1 (1–1) | 1 (1–2) | .922 |
| Meropenem | 5 (3–9) | 5 (3–6) | 3 (2–5) | .147 |
| Amikacin | 2 (1–3) | 3 (3–3) | … | .346 |
| Tobramycin | 6 (2–11) | 2 (1–3) | … | .439 |
| Gentamicin | 3 (1–5) | 11 (7–14) | 2 (1–3) | .165 |
| Narrow β-lactam | 0 (0–3) | 1 (0–4) | 2 (1–4)a | .046 |
| Ampicillin | 3 (2–4) | 4 (3–5) | 3 (2–9) | .439 |
| Ampicillin-sulbactam | 4 (3–4) | 4 (3–5) | 6 (2–6) | .896 |
| Cefazolin | 3 (2–8) | 3 (1–6) | 4 (1–8) | .759 |
| Ceftriaxone | 3 (1–4) | 3 (1–4) | 3 (2–5) | .294 |
Data are presented as median days of therapy (interquartile range). Statistically significant values are highlighted in bold (P ≤ .05).
Abbreviations: AXDX, Accelerate Pheno system; RTN, real-time notification.
aStatistically significant (P ≤ .05) compared to historical cohort.
In secondary analysis, patients with GPC bacteremia (excluding CoNS) had similar median LOS (10.3 days, 9.5 days, and 7.9 days; P = .567), rate of AOT (94.4%, 93.5%, and 100.0%; P = .317), and median total DOT (8 days, 9 days, and 8 days; P = .913) for the historical, AXDX, and AXDX + RTN groups, respectively. Patients with CoNS bacteremia had improved median LOS (5.5 days and 4.5 days vs 7.2 days; P = .003), rate of AOT (94.7% and 93.4% vs 78.5%; P = .002), and median broad gram-positive DOT (3 days and 2 days vs 4 days; P = .003) for AXDX and AXDX + RTN groups compared with the historical cohort, respectively. Total DOT were lower during intervention for patients with CoNS bacteremia, although not statistically significant (P = .060). Pairwise comparison revealed that patients with CoNS bacteremia in the AXDX + RTN group had lower median vancomycin use (3 days vs 5 days; P < .001) and lower broad gram-negative use (3 days vs 4 days; P = .016) compared with the historical cohort, whereas use in the AXDX group without RTN was similar to the historical cohort. Patients with GNR bacteremia experienced a decreased median LOS in the AXDX group compared to both the historical and the AXDX + RTN groups (3.8 days vs 7.7 days and 8.0 days, respectively; P = .008); however, pairwise comparison of median LOS following culture collection was lower in the AXDX group compared to the historical group alone (P = .003). Median total DOT (5 days and 6 days vs 8 days; P = .007) and broad gram-negative DOT (4 days and 5 days vs 7 days; P = .028) were lower in the AXDX and AXDX + RTN groups compared to the historical cohort, respectively. TTOT was significantly faster for both intervention arms compared to the historical group in all pathogen subgroups (Table 5).
Clinical Outcomes and Antibiotic Utilization in Pathogen Subgroups
| Gram-Positive Cocci Bacteremia (Excluding CoNS) | CoNS Bacteremia | Gram-Negative Rod Bacteremia | ||||||||||
|---|---|---|---|---|---|---|---|---|---|---|---|---|
| Outcome and Antibiotic Use | Historical (n = 54) | AXDX (n = 46) | AXDX + RTN (n = 36) | P Value | Historical (n = 79) | AXDX (n = 75) | AXDX + RTN (n = 76) | P Value | Historical (n = 50) | AXDX (n = 31) | AXDX + RTN (n = 33) | P Value |
| LOS | ||||||||||||
| Hospital LOS | 10.3 (6.2–18.2) | 9.5 (5.9–20.1) | 7.9 (6.1–13.6) | .567 | 7.2 (4.8–11.3) | 5.5 (3.3–8.9)a | 4.5 (2.9–9.7)a | .003 | 7.7 (4.4–15.0) | 3.8 (3.1–7.0)a, b | 8.0 (4.2–14.1) | .008 |
| Hospital LOS following culture collection | 8.3 (5.9–11.0) | 7.5 (5.1–14.0) | 7.3 (5.7–11.2) | .813 | 6.1 (4.1–8.6) | 4.8 (3.0–7.7)a | 4.2 (2.9–7.3)a | .026 | 6.8 (4.4–10.5) | 3.8 (3.0–6.9)a | 5.5 (4.0–10.8) | .014 |
| ICU LOS | 4.7 (2.0–10.7) | 6.0 (1.6–9.4) | 4.5 (3.1–6.7) | .866 | 2.0 (0.9–3.7) | 2.6 (1.4–4.1) | 2.1 (1.4–3.2) | .313 | 2.8 (1.6–6.5) | 1.9 (1.4–5.0) | 2.8 (1.6–4.0) | .864 |
| ICU LOS following culture collection | 3.5 (1.7–6.2) | 3.0 (4.6–9.4) | 4.7 (3.1–5.5) | .728 | 1.6 (0.9–3.5) | 2.2 (1.3–4.0) | 2.0 (1.0–2.9) | .606 | 2.7 (1.6–3.8) | 1.9 (1.4–5.0) | 2.8 (1.6–4.0) | .898 |
| Optimal therapy | ||||||||||||
| Achieved optimal therapy, No. (%) | 51 (94.4) | 43 (93.5) | 36 (100.0) | .317 | 62 (78.5) | 71 (94.7)a | 71 (93.4)a | .002 | 42 (82.0) | 28 (90.3) | 31 (93.9) | .238 |
| TTOT following culture collection | 2.8 (1.9–3.4) | 1.8 (0.8–2.8)a | 1.5 (1.1–1.9)a | ≤ .001 | 2.9 (0.5–3.5) | 1.3 (0.0–2.3)a | 1.0 (0.0–2.0)a | ≤ .001 | 3.2 (2.2–3.9) | 1.4 (0.5–2.0)a | 1.5 (1.0–2.1)a | ≤ .001 |
| CDI within 90 d, No. (%) | 2 (3.7) | 1 (2.2) | 3 (8.3) | .385 | 1 (1.3) | 4 (5.3) | 5 (6.6) | .237 | 2 (4.0) | 3 (9.7) | 4 (12.1) | .373 |
| In-hospital transition to hospice care, No. (%) | 4 (7.4) | 7 (15.2) | 2 (5.6) | .267 | 6 (7.6) | 4 (5.3) | 4 (5.3) | .788 | 2 (4.0) | 4 (12.9) | 2 (6.1) | .306 |
| In-hospital mortality, No. (%) | 5 (9.3) | 7 (15.2) | 2 (5.6) | .345 | 6 (7.6) | 2 (2.7) | 4 (5.3) | .390 | 4 (8.0) | 2 (6.5) | 4 (12.1) | .704 |
| Antibiotic use | ||||||||||||
| Total antibiotic use | 8 (7–12) | 9 (6–14) | 8 (6–12) | .913 | 6 (4–9) | 5 (2–7) | 4 (3–7) | .060 | 8 (5–11) | 5 (4–8)a,b | 6 (5–12) | .007 |
| BGP | 4 (2–7) | 5 (2–9) | 4 (2–7) | .845 | 4 (2–6) | 3 (1–6)a | 2 (1–4)a | .003 | 2 (0–4) | 2 (1–3) | 1 (0–4) | .719 |
| Vancomycin | 3 (2–6) | 4 (2–9) | 4 (2–7) | .997 | 5 (3–7) | 3 (2–7) | 3 (2–4)a | .002 | 2 (1–4) | 2 (1–3) | 2 (1–6) | .438 |
| BGN | 4 (2–6) | 4 (1–6) | 3 (2–5) | .636 | 4 (1–7) | 2 (0–7) | 3 (0–5)a | .046 | 7 (4–10) | 4 (2–7)a | 5 (2–8)a | .028 |
| NBL | 3 (0–8) | 4 (0–6) | 4 (1–7) | .749 | 0 (0–1) | 0 (0–2)a | 0 (0–2)a | .010 | 1 (0–4) | 0 (0–2) b | 3 (2–5)a | .001 |
Data presented as median days (interquartile range) unless otherwise indicated. Statistically significant values are highlighted in bold (P ≤ .05). The Candida subgroup analysis was not included due to low incidence.
Abbreviations: AXDX, Accelerate Pheno system; BGN, broad gram negative; BGP, broad gram positive; CDI, Clostridioides difficile infection; CoNS, coagulase-negative staphylococci; ICU, intensive care unit; LOS, length of stay; NBL, narrow β-lactam; RTN, real-time notification; TTOT, time to optimal therapy.
aStatistically significant (P ≤ .05) compared to historical cohort.
bStatistically significant (P ≤ .05) compared to the AXDX-RTN cohort.
DISCUSSION
We attempted to assess the real-world clinical impact of a rapid ID and phenotypic AST platform with and without RTN. During our study, 81% of bacteremic episodes were identified on AXDX with TAT improved by 37 hours, similar to previous reports [19–27]. Average time from Gram stain to organism ID and AST reported in our EMR (7 hours and 15 hours, respectively) was delayed compared to this platform’s capability, representing our laboratory’s decision to verify overnight results prior to EMR entry.
We have shown LOS improvement following implementation of AXDX with an active ASP even without the need for RTN. Walker and colleagues showed decreased ICU LOS following implementation of a microarray-based early ID system with routine ASP activity, although this was not significant on multivariate analysis and mean hospital LOS was similar to the pregroup [34]. Perez and colleagues showed a decrease in LOS for bacteremic patients compared to a historical group utilizing MALDI-TOF MS, though this was combined with 24/7 ASP-RTN [7]. Another study evaluating impact of MALDI-TOF MS without ASP-RTN showed that rapid ID alone did not improve clinical outcomes [17]. Two studies assessing PCR-based mRDT platforms with genotypic susceptibility data showed no LOS decrease compared to standard care [11, 14]. Utilizing RTN, Pardo and colleagues demonstrated decreased LOS in CoNS bacteremia with the FilmArray blood culture identification panel [15]. Likewise, Box et al demonstrated decreased LOS with the Verigene gram-positive blood culture test [13], again utilizing RTN.
To our knowledge, our study is the first to demonstrate improved LOS after implementation of an mRDT without requiring ASP-RTN. While rapid phenotypic susceptibility determination provides more rapid data, one would not expect this to be advantageous in regard to LOS for most GPC bacteremias over rapid ID or ID with genotypic markers. However, rapid phenotypic data for GNR bacteremia could be more beneficial than genotypic markers. Our study shows decreased LOS in 1 of 2 intervention arms with GNR bacteremia, though additional studies may be needed to verify this finding. While other factors could have led to lower LOS, there were no other institutional initiatives during this time targeting LOS. It is plausible that more rapid ID of CoNS and more rapid identification of final antibiotic regimens for gram-negative bacteremia as a result of AXDX did indeed lead to shorter LOS.
Compared to the historical cohort, optimal therapy was achieved more frequently and TTOT was faster after implementation of AXDX, with or without RTN. Improved time to optimal or effective therapy has been shown with other mRDT platforms [11, 13–,15, 34], and a meta-analysis reported a 5-hour improvement in weighted time to effective therapy following mRDT implementation compared to conventional microbiology [3]. Following our AXDX implementation, TTOT improved by 31, 45, and 43 hours for patients with GPC (excluding CoNS), CoNS, and GNR bacteremia, respectively, suggesting that clinical utility of this platform is not isolated to a specific pathogen subgroup. As we did not have genotypic mRDTs for gram-positive organisms in our laboratory, it is not surprising that AXDX provided improvement for GPCs. However, phenotypic susceptibility data for GNR bacteremia could have added benefit compared to ID alone or ID with limited resistance markers. Thus, the 43-hour improvement in TTOT for GNR bacteremia is more unique to this platform.
Bacteremic patients in both intervention arms received fewer days of antibiotics (total and broad gram-negative agents) than the historical cohort. Patients with CoNS in the AXDX + RTN group received less vancomycin compared to the historical group whereas patients without RTN did not, suggesting that RTN has potential added benefit in this scenario.
Ehren et al published the only study to date evaluating the impact of AXDX on clinical outcomes in 3 bacteremia cohorts: conventional without ASP, conventional + ASP-RTN, and AXDX + ASP-RTN [29]. Similar to our study, TTOT was faster with AXDX compared to the historical cohort; however, LOS was not significantly different. Study size and design differences may explain these disparate results. Patients with CoNS, Streptococcus species, and Candida species BSIs were excluded from their study but represented 57% (46%, 8%, and 3%, respectively) of our isolates. Importantly, CoNS inclusion had a significant LOS impact. Last, our study had more patients for additional power and fewer exclusion criteria as we included immunocompromised patients and BSIs found on weekends. Similarly, Banerjee et al recently presented data showing that AXDX led to faster changes in antibiotic therapy compared to MALDI-TOF MS in gram-negative bacteremia, though there was no difference in LOS [30]. They only included gram-negative bacteremia. To date, our study is the most comprehensive clinical impact evaluation of AXDX in a real-world setting.
Our study did not compare AXDX to other mRDT platforms as we did not employ such technology. A portion of the clinical benefit noted in this study was in CoNS bacteremia, which would have likely occurred with other mRDTs. We did note improved clinical outcomes and more rapid optimal antibiotic therapy in gram-positive and gram-negative bacteremia. Given these technologies’ acquisition and ongoing costs, it is important for institutions to evaluate pros and cons of each methodology for their individual laboratories. Further studies to compare clinical outcomes and economic impacts with genotypic vs phenotypic methods of resistance detection are needed to help determine where each technology best fits into clinical practice.
Our study has limitations. Retrospective manual records review is prone to bias and incomplete ascertainment of data, although most of our data were electronically pulled from the EMR, thus minimizing bias. Determination of optimal therapy is subjective in nature. However, we developed predefined definitions and only utilized an infectious diseases physician or infectious diseases pharmacist for this evaluation. Though not statistically significant, CoNS was isolated more commonly in the intervention arms. This likely does not represent a less-ill patient population as MEWS scores were similar between groups. Additionally, patients with CoNS bacteremia in both intervention arms independently had decreased LOS compared to the historical group; thus, the proportion of CoNS in each study group was not responsible for the LOS difference. While many studies exclude potential contaminants, our inclusion of this population enhances generalizability, as potential contaminants can make up a large number of bacteremic episodes [35]. Additional benefit might have occurred if 24/7 RTN was available; however, this must be balanced against staffing requirements not typically available outside of academic or large institutions. Even without RTN, benefit was shown. Given that this is a pre–post study, other factors could be responsible for improved outcomes. As mentioned, we know of no major interventions during this time targeting LOS, and our ASP functioned similarly throughout all included time periods. Last, secondary analyses of pathogen subgroups were not powered to examine differences in these clinical outcomes, so further studies are likely needed to examine clinical outcome differences in each subgroup.
In conclusion, AXDX implementation at our institution impacted both clinical and laboratory outcomes. TAT improved by 37 hours for bacteremic patients with “on-panel” organisms. LOS, AOT, TTOT, total DOT, and broad gram-negative DOT were significantly improved compared to a historical cohort. Addition of ASP-RTN in the setting of an already active ASP did not further improve these metrics; however, subsets of antimicrobial use were improved. Following intervention, TTOT improved in all pathogen subgroups and clinical benefit was most pronounced in CoNS bacteremia. Patients with GNR bacteremia experienced decreased LOS following culture collection in 1 of 2 intervention arms. Further studies are needed to better evaluate the impact of AXDX on specific pathogens or pathogen groups and to better evaluate phenotypic vs genotypic methods of resistance detection. These findings support the benefit of integration of AXDX into healthcare systems with an active ASP even without the resources to include RTN.
Supplementary Data
Supplementary materials are available at Clinical Infectious Diseases online. Consisting of data provided by the authors to benefit the reader, the posted materials are not copyedited and are the sole responsibility of the authors, so questions or comments should be addressed to the corresponding author.
Notes
Acknowledgments. The authors give special thanks to Dr Brett Bailey, Ms Nicole Emory, and Ms Kim Gates for support during this study. Data for the study were provided by the Arkansas Clinical Data Repository (AR-CDR) maintained by the Department of Biomedical Informatics in the College of Medicine at the University of Arkansas for Medical Sciences (UAMS). The AR-CDR is approved to operate as an enterprise data resource to support research across UAMS. Data in the AR-CDR come from the UAMS electronic medical record, tumor registry, billing, and cancer genomic data and comprises encounters since 1 May 2014.
Disclaimer. This was an investigator-initiated, unfunded study. Accelerate Diagnostics had no involvement in any phase of the study or manuscript preparation.
Potential conflicts of interest. R. D. and E. R. have received grant support from Accelerate Diagnostics. K. L. has received consulting and speaking fees from Accelerate Diagnostics. J. R. B. has received grant support from Merck and has served as an advisory board member for Mayne Pharma and ID Connect. All other authors report no potential conflicts of interest. All authors have submitted the ICMJE Form for Disclosure of Potential Conflicts of Interest. Conflicts that the editors consider relevant to the content of the manuscript have been disclosed.

