


Abstract
The vaginal microbiome plays a key role in women’s reproductive health. Use of exogenous hormones, such as intramuscular depot medroxyprogesterone acetate (DMPA-IM), may alter the composition of vaginal bacterial community.
Vaginal swab samples were collected from postpartum Kenyan women initiating DMPA-IM or nonhormonal contraception (non-HC). Bacterial vaginosis was assessed by Nugent score (Nugent-BV) and bacterial community composition was evaluated using broad-range 16S ribosomal RNA gene polymerase chain reaction with high-throughput sequencing. Changes in Nugent score, alpha diversity (Shannon diversity index), and total bacterial load between contraceptive groups from enrollment to 3 months after initiation were estimated using multivariable linear mixed effects regression.
Among 54 human immunodeficiency virus–negative women, 33 choosing DMPA-IM and 21 choosing non-HC, Nugent-BV was more common among DMPA-IM users at enrollment. At follow-up, Nugent score had decreased significantly among DMPA-IM users (change, −1.89; 95% confidence interval [CI], −3.53 to −.25; P = .02) while alpha diversity remained stable (0.03; −.24 to .30; P = .83). Conversely, Nugent score remained relatively stable among non-HC users (change, −0.73; 95% CI, −2.18 to .73; P = .33) while alpha diversity decreased (−0.34; −.67 to −.001; P = .05). The total bacterial load decreased slightly in DMPA-IM users and increased slightly among non-HC users, resulting in a significant difference in change between the contraceptive groups (difference, −0.64 log10 gene copies per swab sample; 95% CI, −1.19 to −.08; P = .02). While significant changes in Nugent score and alpha diversity were observed within contraceptive groups, changes between groups were not significantly different.
Postpartum vaginal bacterial diversity did not change in DMPA-IM users despite a reduction in Nugent-BV, but it decreased significantly among women using non-HC. Choice of contraception may influence Lactobacillus recovery in postpartum women.
Vaginal microbiota dominated by Lactobacillus species, particularly Lactobacillus crispatus, promote favorable sexual and reproductive health outcomes [1–4]. Vaginal microbiota depleted of Lactobacillus spp. with high abundance of anaerobic bacteria, or nonoptimal microbiota, are associated with subclinical inflammation, poor reproductive outcomes, pelvic inflammatory disease, and increased incidence of sexually transmitted infections [1, 2, 5]. While culture-independent molecular methods have allowed for a more comprehensive understanding of the vaginal microbiome, factors shaping vaginal bacterial communities are still not fully understood [3]. In addition, different methods of assessing vaginal microbiota, such as Nugent score determination, quantitative polymerase chain reaction (PCR), and broad-range high-throughput sequencing, give different levels of detail and precision about microbiota composition, which may lead to different interpretations of the vaginal microbial environment.
Reproductive hormones, including estrogens and progestogens, can influence vaginal bacterial communities [6–11]; evidence suggests that high levels of estradiol promote Lactobacillus spp., especially L. crispatus, by fostering a glycogen-rich environment [3, 11]. Endogenous reproductive hormones fluctuate dramatically during the postpartum period [12], making it an interesting time to study vaginal microbiota. While few microbiome studies have been conducted among postpartum women, published findings indicate that women in the immediate postpartum period have more diverse vaginal microbiota, with lower levels of Lactobacillus spp., compared with both before and during pregnancy [13–15]. The duration of these microbial composition shifts is uncertain, but they have been documented to persist for up to 1 year [14].
Exogenous reproductive hormones, such as intramuscular depot medroxyprogesterone acetate (DMPA-IM), a progestin-only injectable contraceptive, also affect vaginal microbiota composition. DMPA-IM induces hypoestrogenism [7, 16], which has been proposed to reduce glycogen deposition in the vaginal epithelium [11]. Depletion of glycogen may lead to fewer lactobacilli, allowing vaginal microbiota to shift toward a polymicrobial composition [11]. Data generally indicate that DMPA-IM use reduces bacterial vaginosis (BV) assessed by Nugent score (Nugent-BV) [10, 17–19] and colonization by BV-associated bacteria [20], although null associations have also been reported [21–23].
Among molecular studies of the effect of DMPA-IM on vaginal microbiota, results are heterogeneous [11, 20–25]; longitudinal studies have reported that DMPA-IM use is associated with (1) higher quantities of Gardnerella vaginalis [22], (2) no changes in concentrations of G. vaginalis, Atopobium vaginae, and Megasphaera phylotype 1 [21], and (3) marked decreases in G. vaginalis [23]. In addition, DMPA-IM use has been associated with no change [21] or decreases [7, 22, 25] in Lactobacillus colonization. Studies assessing the effect of DMPA-IM on vaginal microbiota composition have been similarly heterogeneous [24–26]. Social, geographic, and cultural factors, along with microbiome quantification choices, may play a role in these different observations.
Results from the Evidence for Contraceptive Options and HIV Outcomes (ECHO) randomized trial [27] reduced concern about DMPA-IM use in women at risk for human immunodeficiency virus (HIV) [28], because this study did not find differences in HIV acquisition across the contraceptive methods evaluated; however, uncertainty remains as to whether DMPA-IM increases HIV acquisition risk relative to nonhormonal contraception (non-HC) methods or no method at all [29]. In addition, it is still important to understand how DMPA-IM affects the vaginal environment, especially lactobacilli, for other health outcomes. We designed an observational cohort to measure the effect of DMPA-IM initiation on vaginal microbiota composition in postpartum women, to observe a potential pathway between DMPA-IM use and harmful sequelae. Our main scientific question centers around medium-term effect of induced hypoestrogenism among women using DMPA-IM. We hypothesized that women who initiated DMPA-IM would have a decrease in abundance of lactobacilli compared with those who initiated non-HC, and that the resulting opening would be filled by anaerobic bacteria, increasing vaginal taxa richness and diversity.
METHODS
Setting, Subjects, and Design
We conducted a prospective study of postpartum women initiating contraception, designed to assess how DMPA-IM initiation affects the vaginal microenvironment. We recruited women from a primary care clinic in Nairobi, Kenya, who were 6–14 weeks post partum and interested in initiating DMPA-IM or a non-HC method (condoms, lactational amenorrhea, or “rhythm” [periodic abstinence]). Women were ineligible if already using hormonal contraception or unwilling to learn their HIV status, and they were excluded if they had evidence of cervicitis or sexually transmitted infection.
Women chose their preferred contraceptive method at enrollment; participants who chose DMPA-IM received their first injection after specimen collection, enabling documentation of the exact timing and duration of DMPA-IM exposure. Participants completed a follow-up visit after 3 months. Questionnaires on health and sexual activity were completed at both visits. Vaginal swab samples for microbiota evaluation were collected during pelvic examinations; swab samples were obtained bilaterally in the space that includes right and left lateral fornix and the distal two-thirds of the vaginal wall. Swab samples were not collected from women with vaginal bleeding, including spotting; women were asked to return for swab sample collection when bleeding stopped. Vaginal swab samples were cryopreserved at −80°C after collection.
Laboratory Procedures
Women underwent point-of-care HIV testing (Determine rapid enzyme-linked immunosorbent assay; Abbott). Vaginal fluid was evaluated with Gram stain by a highly trained, blinded technician for Nugent score determination; a score of ≥7 was classified as Nugent-BV [30].
DNA was extracted using the BiOstic Bacteremia DNA Isolation Kit (Mobio, now Qiagen). DNA samples were assessed for contamination and tested for PCR inhibitors [31], and no-template water controls were included with every PCR assay. Total bacterial load of each sample (16S ribosomal RNA [rRNA] gene copies) was measured using a broad-range quantitative PCR assay [32]. Extracted DNA was subjected to broad-range PCR targeting the V3–V4 region of the 16S rRNA gene with next-generation sequencing by Illumina MiSeq (Illumina) [33]. Sequence reads were filtered for length, quality, and contaminants, and they were classified using the phylogenetic placement tool, pplacer, and a reference set of vaginal bacteria [34]. Laboratory staff were blinded to participants’ contraception status.
Bacterial Community Analyses
Sequence read counts were converted to proportions to determine the relative abundance of each taxa. Alpha diversity was quantified using the Shannon diversity index (H), our prespecified end point, but it was also described using the Simpson index (D) and Chao1 [35, 36]. Beta diversity between samples was calculated using weighted UniFrac distances [35] and visualized using principal coordinates analysis. Hierarchical clustering based on bacterial composition, abundance, and weighted UniFrac distances was conducted using the unweighted pair group method with arithmetic mean and used to create vaginal community types (CTs) [37]; CTs with ≤5 observations were pooled as “other.” Linear discriminant analysis with effect size was used to identify differentially abundant taxa between DMPA-IM users and non-HC users cross-sectionally at enrollment and follow-up, using default parameters of α = 0.05 and a minimal linear discriminant analysis score of 2.0 [38].
The effect of DMPA-IM on microbial community composition was assessed by comparing changes in CT membership among women who returned for the 3-month follow-up visit, using Wilcoxon signed rank tests. The effect of DMPA-IM on Nugent score, alpha diversity, and total bacterial load was estimated using multivariable linear mixed-effects regression with an interaction term between contraceptive group and time (days from enrollment to swab sample collection). Models were adjusted for days from delivery to enrollment, age, marital status, and resumption of intercourse after delivery. Sensitivity analyses adjusting for condom use and delivery type (vaginal vs cesarean) were performed.
The study was approved by the Kenyatta National Hospital Ethics and Research Committee and the University of Washington Institutional Review Board. Written informed consent was obtained in English or Kiswahili from all participants. Analyses were conducted using R software (version 3.6.1), the Galaxy web platform [39], and Stata software (version 15; StataCorp).
RESULTS
We enrolled 54 HIV-negative women. Their mean age was 24.2 years (standard deviation, 4.6 years), and most women (65%) had less than a secondary school education (Table 1). More than half of the women enrolled chose DMPA-IM (61%). Women who chose DMPA-IM started using contraception sooner after delivery than those who chose non-HC methods (7.1 vs 9.9 weeks). At enrollment, Nugent-BV was more prevalent among DMPA-IM users than among non-HC users (58% vs 33%), but this difference was not statistically significant. Compared with those who chose non-HC, a higher proportion of women who chose DMPA-IM were married (97% vs 67% for non-HC users) and had resumed sexual intercourse after delivery (52% vs 29%); among women who resumed sexual intercourse by the end of follow-up, condom use was more prevalent among non-HC users than among with DMPA-IM users (80% vs 11%, respectively). Of enrolled women, 44 (81%) returned for 3-month follow-up (79% of DMPA-IM users and 86% of non-HC users). The median time between enrollment and follow-up was equivalent in both groups (DMPA: 84 days; interquartile range [IQR], 84–90 days; non-HC: 84 days; IQR, 84–90 days).
Characteristics of Postpartum Women at Enrollmenta
| Women, No. (%)b | |||
|---|---|---|---|
| Characteristic | Total (N = 54) | Non-HC (n = 21) | DMPA-IM (n = 33) |
| Age, mean (SD), y | 24.2 (4.6) | 26.0 (6.0) | 23.1 (3.1) |
| Married | 46 (85.2) | 14 (66.7) | 32 (97.0) |
| Education level at enrollment | |||
| Less than secondary school | 35 (64.8) | 13 (61.9) | 22 (66.7) |
| Secondary school or more | 19 (35.2) | 8 (38.1) | 11 (33.3) |
| Lifetime no. of partners, mean (SD) | 1.9 (1.1) | 1.7 (1.0) | 2.0 (1.1) |
| No. of pregnancies, mean (SD) | 1.9 (1.2) | 2.1 (1.4) | 1.8 (1.0) |
| Vaginal delivery (most recent delivery) | 46 (85.2) | 18 (85.7) | 28 (84.8) |
| Time since most recent delivery, mean (SD), wk | 8.2 (3.0) | 9.9 (3.5) | 7.1 (2.0) |
| Exclusively breastfeeding | 51 (94.4) | 20 (95.2) | 31 (93.9) |
| BV (Nugent score ≥7) | 26 (48.2) | 7 (33.3) | 19 (57.6) |
| Vaginal washing in past week | 30 (55.6) | 13 (61.9) | 17 (51.5) |
| Any vaginal bleeding | 12 (22.2) | 3 (14.3) | 9 (27.3) |
| Use of antibiotics or metronidazole in past month | 1 (1.9) | 0 | 1 (3.0) |
| Resumed sexual intercourse since delivery | 23 (42.6) | 6 (28.6) | 17 (51.5) |
| Currently using condomsc | 1 (4.4) | 1 (16.7) | 0 |
Abbreviations: BV, bacterial vaginosis; DMPA-IM, intramuscular depot medroxyprogesterone acetate; non-HC, nonhormonal contraception; SD, standard deviation.
aEnrollment visit defined as the visit when participants chose their preferred contraceptive method; women who chose DMPA-IM received their first injection at enrollment.
bData represented as no. (%) of women, unless otherwise indicated.
cAmong those who had resumed sexual intercourse.
Vaginal Bacterial Community Composition
Vaginal bacterial community composition among all women at both visits (N = 98 swab samples from 54 women), and metadata superposed on the clustering tree are shown in Figure 1. Lactobacillus iners was the only commonly detected Lactobacillus spp. Five bacterial CTs were identified using the unweighted pair group method with arithmetic mean and combining small clusters with high diversity. Two CTs were dominated (mean relative abundance, ≥75%) by a single taxon: CT1 by L. iners (n = 37 [38%]) and CT2 by G. vaginalis (n = 15 [15%]); the remaining 3 CTs contained multiple taxa without a dominant bacterium (Table 2). CT3 (n = 9 [9%]) had substantial (>10%) abundances of G. vaginalis and Lactobacillus spp., and CT4 (n = 21 [21%]) had substantial abundances of G. vaginalis, Prevotella spp., and A. vaginae. CT5 (n = 16 [16%]) was a heterogenous mix of anaerobic bacteria. Principal coordinates analysis confirmed clustering of CTs, with the poorest separation between CT4 and CT5 (Supplementary Figure 1). Clustering of CTs did not differ between time points (Supplementary Figure 2).
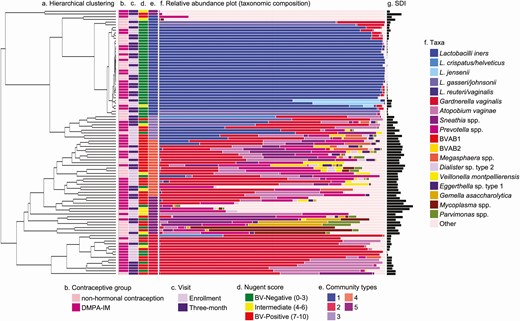
Vaginal bacterial communities among all women (N = 98 swab samples from 54 women). Unweighted pair group method with arithmetic mean hierarchical clustering was used to generate a clustering tree depicting bacterial beta diversity. A, Scale bar represents weighted UniFrac distance. Columns B–E represent contraceptive group (B), study visit (C), bacterial vaginosis (BV) status (D), and community type (E). F, Colored bars represent relative abundance of bacterial taxa; less abundant taxa are grouped as “other.” G, Black bars represent Shannon diversity index (SDI). The enrollment visit was when DMPA-IM was administered, and the follow-up visit, the visit 3 months after DMPA-IM administration. Abbreviations: BVAB, bacterial vaginosis associated bacterium; DMPA-IM, intramuscular depot medroxyprogesterone acetate.
Description of 5 Vaginal Bacterial Community Types Identified Among All Women at Enrollment and at the 3-Month Follow-Up Visit (N = 98 Swab Samples From 54 Women)
| Swab Samples, No. (%) | ||||
|---|---|---|---|---|
| CT | Total | No. in CT With BVa | Shannon Diversity Index, Mean (SD) | Taxa Compositionb |
| CT1 | 37 (38) | 1 (3) | 0.24 (0.29) | Dominant taxa: Lactobacillus iners (80%) |
| CT2 | 15 (15) | 8 (53) | 0.69 (0.35)c | Dominant taxa: Gardnerella vaginalis (75%); prevalent taxa: Atopobium vaginae (16%) |
| CT3 | 9 (9) | 5 (56) | 1.44 (0.47)c | No dominant taxa; prevalent taxa: G. vaginalis (31%), L. iners (28%), and Lactobacillus gasseri/johnsonii (11%) |
| CT4 | 21 (21) | 17 (81) | 2.00 (0.37)d | No dominant taxa; prevalent taxa: G. vaginalis (34%), Prevotella species (18%), A. vaginae (13%) |
| CT5 | 16 (16) | 8 (50) | 2.12 (0.85) | No dominant taxa: heterogenous mix of anaerobic bacteria |
| All | 98 (100) | 39 (39.8) | 1.10 (0.93) | Not applicable |
Abbreviations: BV, bacterial vaginosis; CT, community type; SD, standard deviation.
aNo. (%) of samples in cluster (CT).
bPercentages in this column represent mean relative abundance for taxa in members of corresponding CT.
cSignificantly more diverse (as measured by 2-sample t-test comparing Shannon diversity index) than the preceding CT at the P < .001 level.
dSignificantly more diverse (as measured by 2-sample t-test comparing Shannon diversity index) than the preceding CT at the P < .01 level.
CT1 was the least diverse cluster (mean H = 0.24 [standard deviation, 0.29]) and CT5 was the most diverse (mean H = 2.12 [0.85]), with interim CTs each significantly more diverse than the previous, except in CT4 and CT5 (Table 2). At enrollment, CT membership and alpha diversity did not differ significantly between contraceptive groups, although women who chose DMPA-IM had a lower proportion of women in Lactobacillus spp.–dominant CT1 (n = 10 [30%] vs n = 8 [38%]) and a higher proportion in G. vaginalis–dominant CT2 (n = 7 [21%] vs n = 2 [10%]), aligning with the observation that more women in the DMPA-IM group had Nugent-BV at enrollment (Table 3). CT membership and alpha diversity did not differ significantly between contraceptive groups at follow-up. To conserve power to detect differences between Lactobacillus spp.–dominant and Lactobacillus spp.–depleted CTs, we dichotomized CTs (CT1 vs CTs 2–5); non-HC users were more likely than DMPA-IM users to have Lactobacillus spp.–dominant microbiomes at follow-up (n = 11 [61%] vs n = 8 [31%], respectively; χ 2P = .046).
Comparison of Bacterial Alpha Diversity and the 5 Vaginal Bacterial Community Types, By Contraceptive Group at Enrollment and at 3-Month Follow-up
| Enrollment Visita | Follow-up Visita | |||||
|---|---|---|---|---|---|---|
| Characteristic | Non-HC (n = 21) | DMPA-IM (n = 33) | P Valueb | Non-HC (n = 18) | DMPA-IM (n = 26) | P Valueb |
| CT, no. (%) | ||||||
| CT1 | 8 (38.1) | 10 (30.3) | .54 | 11 (61.1) | 8 (30.8) | .27 |
| CT2 | 2 (9.5) | 7 (21.2) | 1 (5.6) | 5 (19.2) | ||
| CT3 | 1 (4.8) | 4 (12.1) | 2 (11.1) | 2 (7.7) | ||
| CT4 | 5 (23.8) | 8 (24.2) | 2 (11.1) | 6 (23.1) | ||
| CT5 | 5 (23.8) | 4 (12.1) | 2 (11.1) | 5 (19.2) | ||
| Lactobacilli dominant (CT1) | 8 (38.1) | 10 (30.3) | .55 | 11 (61.1) | 8 (30.8) | .046 |
| Lactobacilli depleted (CTs 2–5) | 13 (61.9) | 23 (69.7) | 7 (38.9) | 18 (69.2) | ||
| Nugent score, mean (SD) | 3.62 (3.75) | 5.30 (3.75) | .11 | 2.67 (3.68) | 3.35 (3.70) | .55 |
| Shannon diversity index, mean (SD) | 1.19 (0.87) | 1.19 (1.01) | .99 | 0.79 (0.81) | 1.13 (0.96) | .23 |
| Simpson index, mean (SD) | 0.50 (0.32) | 0.44 (0.33) | .54 | 0.35 (0.33) | 0.46 (0.33) | .32 |
| Chao1, mean (SD) | 17.33 (12.43) | 24.76 (23.29) | .19 | 11.44 (8.38) | 20.23 (17.81) | .06 |
| Total bacterial load, mean (SD)c | 8.31 (0.84) | 8.59 (0.58) | .16 | 8.74 (0.50) | 8.31 (0.89) | .07 |
Abbreviations: CT, community type; DMPA-IM, intramuscular depot medroxyprogesterone acetate; non-HC, nonhormonal contraception; SD, standard deviation.
aEnrollment visit defined as the visit when participants chose their preferred contraceptive method; women who chose DMPA-IM received their first injection at enrollment. Follow-up visit defined as the visit 3 months after contraceptive initiation.
bP values determined with χ 2 tests for categorical variables and unpaired t tests for continuous variables.
cBacterial load presented as log10 16S ribosomal RNA gene copies per swab sample.
Linear discriminant analyses with effect size detected differences in the relative abundance of several taxa associated with nonoptimal vaginal communities between DMPA-IM users and non-HC users at both enrollment and follow-up (Figure 2). At enrollment, G. vaginalis and 2 Porphyromonas species were more abundant among DMPA-IM users than among non-HC users, and Mycoplasma hominis and 2 other anaerobic taxa were more abundant in non-HC users than in DMPA-IM users. At follow-up, 8 anaerobic taxa, including Anaerococcus species, Dialister propionicifaciens, Finegoldia magna, Peptoniphilus species, and Porphyromonas species, were significantly more abundant among DMPA-IM users than among non-HC users, whereas only a single taxon, Prevotella disiens, was more abundant in non-HC users.

Linear discriminant analysis (LDA) with effect size results indicating significant differences (α = 0.05) in the relative abundance of specific bacterial taxa between intramuscular depot medroxyprogesterone acetate (DMPA-IM) users and nonhormonal contraception (non-HC) users; taxa that were more abundant among DMPA-IM users are shown in red; those that were more abundant among non-HC users, in blue. A, Enrollment visit (visit when participants chose their preferred contraceptive method; women who chose DMPA-IM received their first injection at enrollment) (n = 54). B, Three-month follow-up visit (visit 3 months after contraceptive initiation.) (n = 44).
Longitudinal Vaginal Microbiota Changes
We explored patterns of change in CT membership and BV category among the 44 women who returned for the follow-up visit. DMPA-IM users seemed to shift from lactobacilli-depleted CTs to CT1 less frequently than non-HC users (4% vs 17%, respectively) (Figure 3A). In addition, 2 women using DMPA-IM shifted from CT1 to Lactobacillus spp.–depleted CTs, while no non-HC users who started in CT1 shifted to a less optimal CT. Movement between Lactobacillus spp.–depleted CTs was common; however, more DMPA-IM users than non-HC users changed CTs (50% vs 33%). DMPA-IM users also appeared to shift from BV-positive to BV-negative Nugent scores more frequently than non-HC users (23% vs 6%, respectively) (Figure 3B). However, 2 women using DMPA-IM also shifted from BV-negative to BV-positive Nugent scores while no non-HC users showed this pattern. In addition, movement between intermediate and BV-negative Nugent scores was seen only among DMPA-IM users.
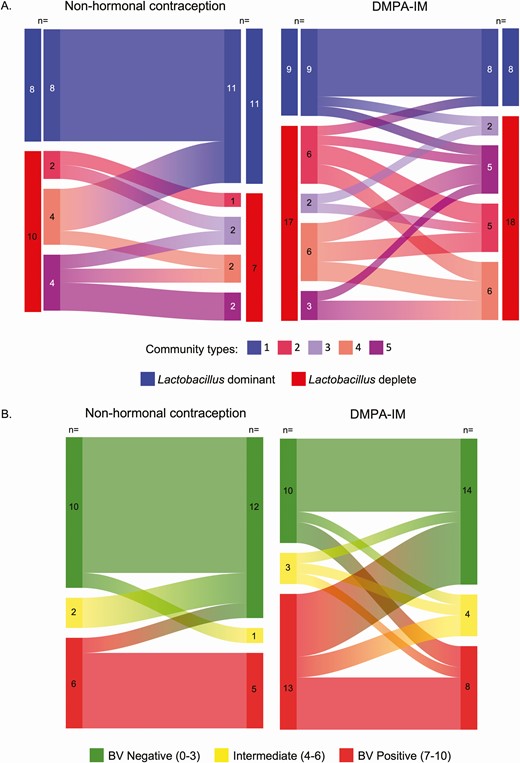
Changes in community type membership (A) and the category of bacterial vaginosis (BV) assessed by Nugent score (B) from enrollment to the 3-month follow-up visit for nonhormonal contraception (non-HC) users (n = 18) and intramuscular depot medroxyprogesterone acetate (DMPA-IM) users (n = 26), among the 44 women who returned for follow-up. Enrollment visit defined as the visit when participants chose their preferred contraceptive method; women who chose DMPA-IM received their first injection at enrollment. Follow-up visit defined as the visit 3 months after contraceptive initiation.
Three months after contraceptive initiation, mean Nugent score decreased by 1.89 points among women using DMPA-IM (95% confidence interval [CI], −3.53 to −.25; P = .02), alpha diversity remained stable (change, 0.03 [95% CI, −.24 to .30]; P = .83), and total bacterial load decreased by 0.26 log10 16S rRNA gene copies per swab sample (95% CI, −.65 to .13; P = .19) (Table 4). Among women using non-HC, Nugent score decreased by 0.73 points (95% CI, −2.18 to .73; P = .33), alpha diversity decreased by 0.34 points (−.67 to −.001; P = .05), and total bacterial load increased by 0.37 log10 16S rRNA gene copies per swab sample (−.02 to .76; P = .06). While there were significant changes in Nugent score and alpha diversity within contraceptive groups, the observed changes did not differ significantly between the groups (difference, −1.17 [95% CI, −3.35 to 1.02; P = .30] vs 0.37 [−.07 to .80; P = .10], respectively). In addition, while neither contraceptive group had a significant change in total bacterial load, the difference in change between them was significant (difference, −0.64 log10 16S rRNA gene copies per swab sample; 95% CI, −1.19 to −.08; P = .02).
Change in Nugent Score, Total Bacterial Load, and Shannon Diversity Index from Enrollment to the 3-Month Follow-up Visit by Contraceptive Group, and Difference in Change Between Contraceptive Groupsa
| Non-HC | DMPA-IM | Between-Group Comparison | ||||
|---|---|---|---|---|---|---|
| Index | Change (95% CI) | P Value | Change (95% CI) | P Value | Difference (95% CI) | P Value |
| Nugent score | −0.73 (−2.18 to.73) | .33 | −1.89 (−3.53 to −.25) | .02 | −1.17 (−3.35 to 1.02) | .30 |
| Shannon diversity index | −0.34 (−.67 to −.001) | .050 | 0.03 (−.24 to .30) | .83 | 0.37 (−.07 to .80) | .10 |
| Simpson index | −0.12 (−.27 to .03) | .11 | 0.04 (−.06 to .14) | .42 | 0.16 (−.02 to .34) | .08 |
| Chao1 | −4.90 (−8.43 to −1.38) | .006 | −3.38 (−10.23 to 3.47) | .33 | 1.52 (−6.25 to 9.30) | .70 |
| Total bacterial loadb | 0.37 (−.02 to .76) | .06 | −0.26 (−.65 to .13) | .19 | −0.64 (−1.19 to −.08) | .02 |
Abbreviations: CI, confidence interval; DMPA-IM, intramuscular depot medroxyprogesterone acetate; non-HC, nonhormonal contraception.
aEnrollment visit defined as the visit when participants chose their preferred contraceptive method; women who chose DMPA-IM received their first injection at enrollment. Follow-up visit defined as the visit 3 months after contraceptive initiation. Results from linear mixed models were adjusted for time (days from delivery to enrollment and days from enrollment/DMPA-IM injection to swab sample collection), age, marital status, and resumption of intercourse at enrollment.
bBacterial load presented as log10 16S ribosomal RNA gene copies per swab sample.
To confirm our findings, we performed several sensitivity analyses. Results showed similar patterns using other alpha diversity indices (Simpson index and Chao1) (Table 4). Sensitivity analyses adjusting for condom use and mode of delivery, which could affect vaginal microbiota showed similar results (Supplementary Tables 1 and 2).
DISCUSSION
In a cohort of African women initiating postpartum contraception, we observed several patterns that indicate DMPA-IM use may be associated with the maintenance of nonoptimal, Lactobacillus-depleted microbial communities, even when Nugent-BV is reduced. We observed a significant reduction in Nugent score but no corresponding change in alpha diversity or movement to Lactobacillus-dominant microbial communities among DMPA-IM users, while non-HC users showed no significant change in Nugent score but a decrease in alpha diversity. In addition, DMPA-IM use was associated with significantly higher relative abundances of 8 anaerobic taxa at follow-up. We also found that bacterial load decreased slightly among DMPA-IM users and increased slightly among non-HC users, resulting in a significant difference in change between the contraceptive groups. This finding further confirms the observed changes in Nugent score and alpha diversity. We conclude that DMPA-IM affects the overall vaginal environment. This finding is consistent with prior work [23], and further clarification of which bacteria are most affected should be pursued.
Overall, few women in our cohort had L. crispatus, limiting our ability to assess the of influence DMPA-IM on lactobacilli considered most optimal. Low prevalence of L. crispatus, and more common detection of L. iners, has been seen in several studies in Eastern and Southern Africa [40–43]; the underlying reason for geographic variation in Lactobacillus spp. has yet to be fully elucidated.
There are few published studies on the vaginal microbiome during the postpartum period, but current data suggest that postpartum women have more diverse vaginal microbiota, with lower levels of Lactobacillus spp., compared with both before and during pregnancy [13–15]. DMPA-IM initiation in the postpartum period may maintain these nonoptimal vaginal microbial communities by allowing a hypoestrogenic state to persist, while non-HC users return to a more optimal microbiota as their menstrual cycle returns. Behavioral differences may also be important, because the women in our study choosing DMPA-IM engaged in intercourse sooner after delivery and reported less condom use. Our findings showed that DMPA-IM initiation was not associated with large increases in diversity; however, DMPA-IM–induced hypoestrogenism may prevent recolonization with Lactobacillus spp., and therefore continued dominance by non-Lactobacillus taxa, compared with women using non-HC.
Although we observed a significant decrease in Nugent score among women using DMPA-IM, which is congruent with the existing literature [10, 17–19], we did not see a change in bacterial community alpha diversity using any of the Shannon, Simpson, and Chao1 indices; even though Nugent-BV was reduced, women still had diverse, nonoptimal vaginal microbiomes. This discrepancy underlines the inexact picture given by Nugent scoring compared with molecular methods, which provide more details of vaginal community composition. In addition, this finding is congruent with the concept that there are different types of nonoptimal vaginal bacterial communities beyond Nugent-BV [4]. The longstanding assumption that DMPA-IM use, resulting in lower Nugent scores, is benign, should be reevaluated in light of the vaginal diversity findings presented here.
Our finding of a reduction in Nugent score among women initiating DMPA-IM differs from published results from a cohort of HIV-negative, nonpregnant women in Zimbabwe [21], which found that DMPA-IM use did not reduce the prevalence of BV. Possible explanations for these differing results include a lower prevalence of Nugent-BV among DMPA-IM users in the Zimbabwean cohort (29%) compared with our study (58%), which gave women in this cohort more latitude to decrease Nugent score; different populations of women (postpartum vs nonpregnant, menstruating women); and different parameterizations of BV (continuous change in Nugent score vs diagnosis of Nugent-BV).
A major strength of this study is that participants were known to be contraceptive free before enrollment and received their first DMPA-IM injection from study staff, confirming the timing and duration of exposure; potential contamination from other contraceptives and uncertainty in type of injectable contraceptive are not of concern. Breastfeeding behaviors were uniform in both contraception groups and antibiotic use was very low. The study design also allowed for comparison of pre– and post–DMPA-IM effects, because women could serve as their own controls.
Our study also had multiple limitations. Generalizability of these results may be limited owing to the source population of participants. Postpartum, amenorrheic women were specifically enrolled to reduce expected variability of the vaginal microbiome due to the menstrual cycle [9, 44]; however, postpartum vaginal microbiota may be different from vaginal microbiota found in menstruating women [13–15]. Second, participants chose their contraceptive, and as has been reported, women who relied on non-HC methods alone differed behaviorally from women who chose DMPA-IM [45]. Condom use, in particular, differed across our contraceptive groups. Although we measured and adjusted for important confounders, residual or unmeasured confounding is always possible in observational research.
Finally, sample size was a major limitation. This limited the number of adjustment factors that could be included in models and gave limited power to test for an interaction or detect difference between groups. Our analyses of the influence of condom use and delivery mode were therefore limited to sensitivity analyses, which did not change our results. Although our study was well powered for continuous measures, including Nugent score and diversity indices, we had limited power to assess changes in bacterial CT. We also had a modest loss to follow-up (19% of women), further reducing power for longitudinal changes.
The current study evaluated how DMPA-IM effects the overall vaginal bacterial community, building on our group’s previous work assessing how DMPA-IM affects the concentration of bacteria associated with HIV acquisition [46]. The previous study found that postpartum use of DMPA-IM and non-HC may have different effects on the vaginal concentrations of some bacteria associated with HIV acquisition, while this study suggests that postpartum use of DMPA-IM and non-HC may have different effects on the vaginal microbiome as a whole. Overall, these findings suggest that nonoptimal vaginal bacterial communities are common among postpartum Kenyan women, and that DMPA-IM use among postpartum women may be associated with maintenance of highly diverse, nonoptimal vaginal bacterial communities.
Despite our small sample and specific population, these findings suggest that the effect of DMPA-IM on the postpartum vaginal microenvironment deserve further attention. DMPA-IM is suitable for use in breastfeeding women ≥4 weeks post partum because progestins do not affect breast milk production [47], making it one of few approved, highly effective postpartum contraceptives. In addition, while the ECHO trial has relieved apprehension about DMPA-IM use in settings with high HIV prevalence [27], nonoptimal vaginal microbiota remain a risk factor for other negative health outcomes. We conclude that postpartum DMPA-IM use may pose different risks than at other times, owing to the higher postpartum vaginal microbial diversity seen and the potential for DMPA-IM to stabilize nonoptimal vaginal microbiota. With such few postpartum contraceptive options, there is a need for 21st-century contraceptive technology to control fertility while also promoting optimal vaginal health, including optimal microbiota.
Supplementary Data
Supplementary materials are available at Clinical Infectious Diseases online. Consisting of data provided by the authors to benefit the reader, the posted materials are not copyedited and are the sole responsibility of the authors, so questions or comments should be addressed to the corresponding author.
Notes
Acknowledgments. The authors thank the women who participated in the study as well as the staff at the Mathare North Health Center in Nairobi, Kenya. This study was conducted with approval from the Kenyatta National Hospital–University of Nairobi Ethics and Research Committee, which requires data to be released from Kenyan studies (including deidentified data) only after the committee has provided written approval for additional analyses. As such, data for this study will be available from the authors on request, with written approval for the proposed analysis from the Ethics and Research Committee. The application forms and guidelines can be accessed at http://erc.uonbi.ac.ke/. To request these data, please contact A. C. R. at [email protected], or contact the Ethics and Research Committee directly at [email protected].
Financial support. This work was supported by the National Institute of Allergy and Infectious Diseases, National Institutes of Health (NIH; grant R21AI129712 to A. C. R.), the National Institute of Child Health and Human Development, NIH (grant K23HD071788 to A. C. R.), the University of Washington Royalty Research Fund (grant A106982 to A. C. R.), the University of Washington Center for AIDS and STD Research Training Program (NIH grant T32AI07140), and the University of Washington Center for AIDS Research (NIH grant AI027757). Study data were collected and managed using REDCap electronic data capture tools hosted at the University of Washington, funded by the NIH/National Center for Advancing Translational Sciences (grants UL1 TR002319, KL2 TR002317, and TL1 TR002318).
Potential conflicts of interest. R. S. M. reports consulting fees from Lupin Pharmaceuticals and grants paid to the University of Washington by Hologic, outside the submitted work. D. N. F. has a financial relationship with BD for licensure of molecular diagnosis of bacterial vaginosis, unrelated to the research presented in this article. All other authors report no potential conflicts.
All authors have submitted the ICMJE Form for Disclosure of Potential Conflicts of Interest. Conflicts that the editors consider relevant to the content of the manuscript have been disclosed.
References
Author notes
Presented in part: December 2018 Keystone Symposia: Role of the Genital Tract Microbiome in Sexual and Reproductive Health (S6), Cape Town, South Africa, 14 December 2018; poster 3016.

