


Abstract
Evidence to inform cryptococcal antigen (CrAg)–screening guidelines among ART-experienced populations is lacking. We performed a study evaluating the utility of reflex CrAg screening in Gaborone, Botswana.
CD4 count data were collected from the HIV reference laboratory from 2014–2016. CrAg screening was performed on samples with CD4 ≤100 cells/µL beginning January 2015. The proportion of CD4 counts ≤100 cells/µL was determined and the frequency of repeat CrAg testing described. Analyses ascertained the impact of ART status on CrAg prevalence and outcomes, and whether CrAg titers could be used for risk stratification.
Overall, 5.6% (3335/59 300) of individuals tested had CD4 ≤100 cells/μL; 2108 samples with CD4 ≤100 cells/μL from 1645 unique patients were CrAg tested. Over half of samples were from ART-experienced individuals: 40.9% (863) on ART and 12.1% (255) defaulters; 22% (463) of CrAg tests were on repeat samples. CrAg prevalence was 4.8% (72/1494; 95% CI, 3.8–6.0%) among outpatients and 21.9% (32/151; 95% CI, 15.3–28.5%) among inpatients. CrAg prevalence rates did not differ by ART status, but 6-month mortality was significantly lower in CrAg-positive individuals on ART at screening. Ten CrAg positives were identified through repeat testing. A CrAg titer cutoff ≥1:80 provided the best discrimination for 6-month survival.
CrAg-positivity rates in an ART-experienced population were comparable to those seen in ART-naive populations. Repeat screening identified individuals who seroconverted to CrAg positivity and were at risk of cryptococcal disease. CrAg titers ≥1:80 can help identify the individuals at highest risk of death for more intensive management.
Cryptococcal meningitis (CM) remains a leading cause of adult meningitis in sub-Saharan Africa despite antiretroviral therapy (ART) scale-up [1, 2], causing an estimated 135 900 deaths annually and accounting for 15% of all human immunodeficiency virus (HIV)–related mortality [3]. In Botswana, a country with a well-established ART program with population ART coverage approaching UNAIDS 90-90-90 targets [4], CM incidence has not decreased substantially with expanded ART eligibility criteria [2].
Screening for cryptococcal antigen (CrAg) in the blood of patients with HIV with advanced immunodeficiency can identify those at risk of developing CM prior to the onset of clinically evident disease [5], and pre-emptive fluconazole for ART-naive CrAg-positive patients has been shown to reduce CM incidence and mortality [6–8]. In 2011, the World Health Organization (WHO) published a conditional recommendation for CrAg screening in individuals initiating ART with CD4 T-cell counts less than 100 cells/μL [9], which was revised to a strong recommendation in the 2018 guidelines [10].
Many African countries are introducing universal “reflex” CrAg screening [11, 12], where CrAg testing is performed on all blood sent for routine CD4 testing found to fall below a CD4 threshold (usually 100 cells/µL). This reduces time to screening and improves uptake compared with provider-initiated screening [13]. However, reflexively screening all CD4 samples of less than 100 cells/µL may lead to repeatedly testing samples from the same patient, the programmatic impact of which has not been studied. It is also likely that, as population ART coverage increases, the number of individuals with very low CD4 counts will decline, and the proportion of these individuals who are ART experienced (ie, taking ART or who have previously taken ART but interrupted therapy) will increase. All major CrAg-screening trials have included only ART-naive individuals [7, 8, 14]; thus, little evidence exists to inform CrAg-screening approaches among ART-experienced individuals who re-present after disengagement from care, or individuals on ART but with persistently low CD4 counts. Accumulating data highlight the need for CM-prevention interventions in this ART-experienced population, with programmatic data from Botswana [2, 15] as well as recently reported CM treatment trials [16–18] suggesting that over half of patients presenting with CM are now ART experienced.
To address these knowledge gaps, we performed a study evaluating the utility of reflex CrAg screening in Botswana. We determined (1) the proportion of CD4 counts of 100 cells/µL or less, (2) the scale and utility of repeat CrAg testing, (3) the ART status of individuals undergoing CrAg screening and its impact on CrAg prevalence and outcomes, and (4) whether CrAg titers differed according to ART status and could be used for risk stratification.
METHODS
Participants and Procedures
Between January 2014 and January 2016, data were prospectively collected from all samples sent for CD4 testing to the Botswana Harvard HIV Reference Laboratory (BHHRL), serving 27 ART clinics and the central referral hospital in greater Gaborone. CD4 counts, age, and sex data were obtained from the BHHRL electronic laboratory information system, and a unique patient identifier was used to identify repeat samples.
From January 2015 CrAg testing was performed in real time on residual ethylenediaminetetraacetic acid (EDTA) blood from samples with a CD4 count of 100 cells/µL or less using the IMMY CrAg Lateral Flow Assay (Immuno-Mycologics, Norman, OK), with measurement of antigen titers [19] using stored samples at study completion. Positive CrAg results were communicated telephonically to responsible clinicians within 48 hours. A treatment algorithm based on WHO guidelines [9, 11] was supplied (Supplementary Figure 1), and training given to providers at the clinics and hospital. Management decisions were at the discretion of the patients’ healthcare providers, and the study team had no direct patient contact.
Laboratory data were linked to paper and electronic records from healthcare facilities using unique patient identifiers on study completion to determine date of HIV diagnosis, ART status at the time of CrAg screening, antifungal treatment received, and outcome 6 months post–CrAg screening. Incidence of CM was determined through cross-referencing with a comprehensive national meningitis surveillance database [2, 20, 21]. In patients missing outcome data after full review, the national death registry was queried using the unique national identification number. All data were collated in REDCap [22, 23] and anonymized before analysis.
The study received ethical approval from institutional review boards at Princess Marina Hospital, the Botswana Ministry of Health and Wellness, and the University of Pennsylvania. As the study was limited to implementation of a laboratory-based, WHO-endorsed screening intervention and collection of routine clinical and outcomes data, a waiver of informed patient consent was granted.
Statistical Methods
Data were analyzed using STATA version 14 (Stata Corporation, College Station, TX). The proportion of CD4 counts 100 cells/µL or less was determined and CrAg prevalence calculated. Characteristics of individuals with CD4 counts of 100 cells/µL or less undergoing CrAg screening were described, and the proportion of CD4 samples tested through reflex screening that were repeat samples and the additional diagnostic yield of repeat CrAg screening determined. Associations between CrAg status and ART status, CD4 count, age, and sex were explored using univariable logistic regression analyses and a multivariable model incorporating all variables. Cox regression was used to explore 6-month outcomes among the outpatient cohort according to CrAg status, adjusting for ART status, CD4 count, age, and sex; and outcomes are presented graphically using Kaplan-Meier curves. The utility of baseline CrAg titer for classifying patients according to 6-month outcome was examined using receiver operating characteristic (ROC) curve analysis and the Youden Index (J) to determine the optimal cutoff and a second cutoff analysis derived from a Cox regression. P values less than .05 were considered significant.
RESULTS
Between January 2014 and January 2016, 140 793 CD4 tests were performed on 59 300 patients. Median age was 38 years (interquartile range [IQR], 31–45 years) and 65% (38 421/59 300) were female, 68% (40 168) were in HIV care with previously documented CD4 monitoring, and 32% (19 132) had no CD4 counts prior to the study period. Individuals had a median of 3 (IQR, 2–4) CD4 counts during the 2-year period. The median CD4 count of all tested samples was 469 cells/µL (IQR, 329–635 cells/µL), with CD4 counts of 200 cells/µL or less in 9.5% (13 350/140 793) and 100 cells/µL or less in 3.2% (4463/140 793). Fourteen percent of patients (8511/59 300) had at least 1 CD4 count of 200 cells/μL or less during the study period, and 5.6% (3335/59 300) had at least 1 CD4 count of 100 cells/μL or less. Men were more likely than women to have a CD4 count of 100 cells/µL or less (8.1% vs 4.3%; odds ratio [OR], 2.0; 95% confidence interval [CI], 1.9–2.1).
Characteristics of Samples Tested During Reflex CrAg Screening
From January 2015, 2108 sequential blood samples with a CD4 count of 100 cells/μL or less from 1645 patients were CrAg screened (Figure 1). Overall 5.8% (123/2108) of samples were CrAg positive. A total of 463 (22.0%) samples were repeat CD4 count samples from individuals previously screened during the study period; 92.3% (1946) of samples were from outpatients and 7.7% (162) from hospitalized patients. Over half of samples tested were from ART-experienced individuals: 40.9% (863) reportedly on ART, 12.2% (255) reportedly defaulting ART, and 47.0% (990) ART naive.
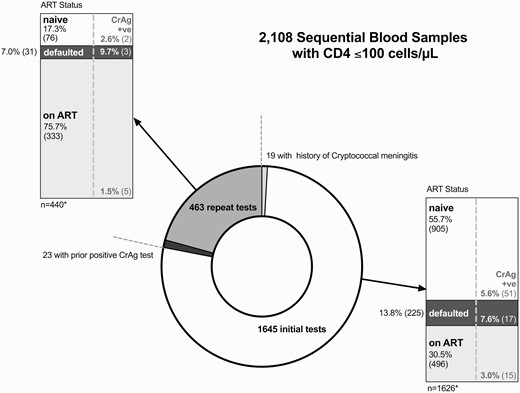
Characteristics of 2108 blood samples with CD4 cell counts ≤100 cells/µL undergoing reflex cryptococcal antigen screening in Gaborone, Botswana, 2015–2016. The samples were from 1645 unique individuals; 463 (22%) CrAg tests were performed on repeat samples from 339 previously screened individuals. Ten (2.9%) of these individuals “seroconverted” from CrAg negative to CrAg positive. ART status of individuals at the time of screening and the CrAg-positivity rates by ART category are shown in the stacked bar charts, stratified by initial and repeat testing. ART status was defined as “ART-naive” if the patient had never taken ART, “on ART” if documented current ART prescriptions or viral load monitoring (which is only performed for treatment monitoring in Botswana), or “defaulted” if documentation of prior ART use and either documentation of treatment discontinuation, or no ART prescription or follow-up for over 180 days. *The 19 initial samples from individuals with a prior history of cryptococcal meningitis and 23 repeat samples from individuals previously found to have a positive CrAg test are excluded from the stacked bar charts. Abbreviations: ART, antiretroviral therapy; CrAg, cryptococcal antigen; +ve, positive.
Characteristics of Individuals With CD4 Cell Counts ≤100 Cells/µL Undergoing Reflex CrAg Testing
The median age of 1645 individuals screened was 37 years (IQR, 32–43 years); 50.3% were male (828/1645), with a median CD4 count of 54 cells/µL (IQR, 25–78 cells/µL) (Table 1). At the time of initial CrAg testing, 55.2% (908/1645) were ART naive, 13.6% (224/1645) had defaulted ART, and 31.2% (513/1645) were on ART; 442 of the 513 individuals reportedly on ART had a current viral load test, of whom 44.8% (198) were not virologically suppressed (viral load >400 copies/mL). The majority were outpatients at the time of initial CrAg testing (90.8%, 1494/1645).
Baseline Characteristics of 1645 Participants With CD4 Cell Counts ≤100 Cells/µL Undergoing Cryptococcal Antigen Screening Stratified by Cryptococcal Antigen Status
| Variable | All Patients (N = 1645) | CrAg Negative (n = 1541) | CrAg Positive (n = 104) | P |
|---|---|---|---|---|
| Sex, % male (n) | 50.3 (828) | 49.6 (764) | 61.5 (64) | .019 |
| Age, median (IQR), years | 37 (32–43) | 37 (32–43) | 37 (32–43) | .640 |
| CD4 count, median (IQR), cells/µL | 54 (25–78) | 55 (27–79) | 32 (13–63) | <.001 |
| ART status,a % (n) | ||||
| Naive | 55.2 (908) | 55.2 (850) | 55.8 (58) | .606 |
| Defaulted | 13.6 (224) | 13.4 (207) | 16.4 (17) | |
| On ART | 31.2 (513) | 31.4 (484) | 27.9 (29) | |
| Prior history of CM, % (n) | 1.2 (19) | 0.4% (6) | 12.5 (14) | <.001 |
| Time from prior CM to CrAg test, median (IQR), days | 496 (121–1079) | 1736 (647–2945) | 228 (121–683) | |
| CrAg titer, median (IQR) | … | … | 1:160 (1:10–1:2560)b | |
| Screening location, % outpatients (n) | 90.8 (1494) | 92.3 (1422) | 69.2 (72) | <.001 |
Abbreviations: ART, antiretroviral therapy; CM, cryptococcal meningitis; CrAg, cryptococcal antigen; IQR, interquartile range.
aART status was defined as: “ART-naive” if patient had never taken ART, “on ART” if documented current ART prescriptions or viral-load monitoring (which is only performed for treatment monitoring in Botswana), or “defaulted” if documentation of prior ART use and either documentation of treatment discontinuation, or no ART prescription or follow-up for >180 days.
bCrAg titers were measured in 98 of the 104 CrAg-positive baseline samples (with insufficient samples in the remaining 6 cases).
Overall, 6.3% (104/1645; 95% CI, 5.2–7.6%) of patients had a positive CrAg test during the study period. Six of 1541 (0.4%) CrAg-negative and 13 of 104 (12.5%) CrAg-positive individuals had a prior history of CM. CrAg prevalence in inpatients was 21.9% (32/151; 95% CI, 15.3–28.5%) and 4.8% (72/1494; 95% CI, 3.8–6.0%) in outpatients (4.1%, 60/1477; 95% CI, 3.2–5.2% excluding those with prior CM). Seventy-five percent (24/32) of CrAg-positive inpatients had confirmed CM at the time of their first positive CrAg test and 19.4% (14/72) of outpatients (although the proportion investigated with lumbar puncture [LP] following their positive CrAg test was low [20/72, 27.8%]). Median CrAg titers were higher in those with confirmed CM at baseline (1:1280 [IQR, 1:60–1:2560] with baseline CM vs 1:60 [IQR, 1:10–1:640] without baseline CM; P < .001).
Identification of CrAg-Positive “Seroconverters” at Repeat CrAg Testing During Reflex Screening
Of 463 repeat CD4 samples from individuals previously screened during the study period, 5% (23) were from 13 individuals who had tested CrAg positive on their initial sample and 95% (440) were from 339 individuals who had been CrAg negative on initial testing. Ten of these 339 previously CrAg-negative individuals (2.9%; 95% CI, 1.4–5.4%) developed a positive CrAg on repeat testing, a median of 123 days (IQR, 58–221 days) after initial testing. Five of these had never initiated (n = 2) or defaulted (n = 3) ART after initial testing, of whom 3 had confirmed CM on LP at re-presentation and a fourth developed CM 5 months after testing having continued to default treatment. The other 5 had initiated ART after initial CrAg screening and had low CrAg titers (1:10–1:20); none had CM at re-presentation or developed CM during follow-up. All 10 individuals were alive at 6 months (Supplementary Table 1).
Baseline Associations With Cryptococcal Antigenemia
Cryptococcal antigenemia was significantly associated with male sex and low CD4 count (Table 2). These associations remained significant when analysis was restricted to individuals screened in outpatient settings. There were no significant variations in the prevalence of cryptococcal antigenemia according to ART status, with similar rates in ART-experienced and ART-naive individuals.
Associations Between Baseline Variables and Cryptococcal Antigenemia in 1645 Participants With CD4 Cell Counts ≤100 Cells/µL Undergoing Cryptococcal Antigen Screening Stratified by Cryptococcal Antigen Status
| Variable and Category | n | CrAg Positive, % (n) | OR (95% CI) | P | Adjusted OR (95% CI) | P |
|---|---|---|---|---|---|---|
| All patients | ||||||
| Sex | ||||||
| Female | 817 | 4.9 (40) | Base | .019 | Base | .019 |
| Male | 828 | 7.7 (64) | 1.63 (1.1–2.4) | 1.64 (1.1–2.5) | ||
| Age | ||||||
| <37 years | 851 | 6.2 (53) | Base | .871 | Base | .800 |
| ≥37 years | 794 | 6.4 (51) | 1.03 (.7–1.5) | 1.05 (.7–1.6) | ||
| CD4 count | ||||||
| >50 cells/µL | 915 | 3.9 (36) | Base | <.001 | Base | <.001 |
| 25–49 cells/µL | 325 | 8.0 (26) | 2.12 (1.3–3.6) | 2.13 (1.3–3.6) | ||
| <25 cells/µL | 405 | 10.4 (42) | 2.83 (1.8–4.5) | 2.89 (1.8–4.6) | ||
| ART statusa | ||||||
| On ART | 513 | 5.7 (29) | Base | .614 | Base | .800 |
| Defaulted | 224 | 7.6 (17) | 1.37 (.7–2.5) | 1.15 (.6–2.2) | ||
| Naive | 908 | 6.4 (58) | 1.13 (.7–1.8) | .94 (.6–1.5) | ||
| Outpatients | ||||||
| Sex | ||||||
| Female | 740 | 3.8 (28) | Base | .066 | Base | .051 |
| Male | 754 | 5.8 (44) | 1.57 (1.0–2.6) | 1.64 (1.0–2.7) | ||
| Age | ||||||
| <37 years | 776 | 5.0 (39) | Base | .699 | Base | .739 |
| ≥37 years | 718 | 4.6 (33) | .91 (.6–1.5) | .92 (.6–1.5) | ||
| CD4 count | ||||||
| >50 cells/µL | 856 | 3.0 (26) | Base | <.001 | Base | <.001 |
| 25–49 cells/µL | 292 | 6.5 (19) | 2.2 (1.2–4.1) | 2.34 (1.3–4.3) | ||
| <25 cells/µL | 346 | 7.8 (27) | 2.7 (1.6–4.7) | 2.91 (1.6–5.2) | ||
| ART statusa | ||||||
| On ART | 476 | 5.5 (26) | Base | .599 | Base | .258 |
| Defaulted | 205 | 5.4 (11) | .98 (.5–2.0) | .81 (.4–1.7) | ||
| Naive | 813 | 4.3 (35) | .78 (.5–1.3) | .63 (.4–1.1) |
All variables shown were included in the adjusted model (sex, age, CD4 count, and ART status). There was no association between age and CrAg status when age was included as a categorical or a continuous variable.
Abbreviations: ART, antiretroviral therapy; CI, confidence interval; CrAg, cryptococcal antigen; OR, odds ratio.
aART status was defined as “ART-naïve” if patient had never taken ART, “on ART” if documented current ART prescriptions or viral-load monitoring (which is only performed for treatment monitoring in Botswana), or “defaulted” if documentation of prior ART use and either documentation of treatment discontinuation, or no ART prescription or follow-up for >180 days.
Relationship Between Cryptococcal Antigenemia and Clinical Outcomes
Six-month outcomes were obtained for 96.0% (1579/1645) of CrAg-screened patients, of whom 12.2% (192/1579) died. The baseline characteristics of the 4% (66) patients lost to follow-up (LTFU) were similar to those of the individuals who died (Supplementary Table 2). Sensitivity analyses assuming all individuals who were LTFU died were therefore performed.
Six-month outcomes among the 1494 outpatients screened are shown in Figure 2. Due to the reliance on retrospective chart review to determine ART prescription information post–CrAg screening, data regarding ART initiation were incomplete—available for 78% (793/1018) patients not on ART, of whom 89% (705) initiated ART a median of 26 days (IQR, 14–45 days) after screening. The 14 CrAg-positive individuals with CM at baseline were treated as inpatients with amphotericin B–based therapy; 6 (43%) died and a further 2 (14%) were LTFU. Among the 58 CrAg-positive individuals without confirmed CM at baseline, fluconazole prescriptions were documented in 59% (24) of the 41 whose charts were retrieved (although an absence of documentation in the charts does not necessarily mean the patient did not receive fluconazole). Eight of the 58 (14%) developed CM a median of 94 days (IQR, 66–102 days) post–CrAg screening, 3 (38%) of whom died. Only 1 CrAg-negative individual developed CM at 92 days post–CrAg screening.
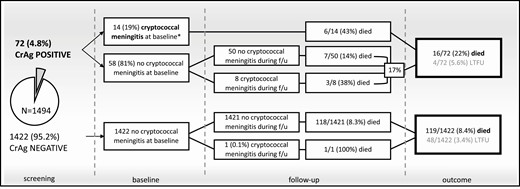
Outcomes in 1494 individuals with CD4 cell counts ≤100 cells/µL tested as outpatients through a reflex CrAg screening program in Gaborone, Botswana, 2015–2016. Seventy-two (4.8%) of the 1494 individuals screened had a positive CrAg test. Management guidelines recommended referral for lumbar puncture in CrAg-positive individuals with symptoms suggestive of meningitis and high-dose fluconazole (800 mg daily) in asymptomatic CrAg-positive individuals. ART initiation in ART-naive CrAg-positive individuals was recommended at 4–6 weeks following initiation of antifungal therapy in those with confirmed CM, and 2 weeks following initiation of pre-emptive antifungal therapy in those without. ART initiation data following CrAg screening were incomplete, available for 793 (78%) of the 1018 patients not on ART, of whom 89% (705) initiated ART a median of 26 days (IQR, 14–45 days) after screening. Among the 58 CrAg-positive individuals without confirmed CM at baseline, fluconazole prescriptions were documented in 59% (24) of the 41 whose charts were retrieved (although an absence of documentation in the charts does not necessarily mean the patient did not receive fluconazole). Only 1 CrAg-negative individual developed CM during follow-up, an ART treatment defaulter with a CD4 count of 3 cells/µL. *Patients with CM at baseline or who developed CM during follow-up were admitted to the hospital and treated with 2 weeks of amphotericin B deoxycholate (1 mg/kg) plus fluconazole (1200 mg) daily. Abbreviations: ART, antiretroviral therapy; CM, cryptococcal meningitis; CrAg, cryptococcal antigen; f/u, follow-up; IQR, interquartile range; LTFU, lost to follow-up.
Cumulative 6-month mortality in the outpatient cohort was 23.3% (16/72; 95% CI, 14.9–35.1%) in CrAg-positive individuals and 8.6% (119/1422; 95% CI, 7.2–10.2%) in CrAg-negative individuals (hazard ratio [HR], 2.93; 95% CI,1.7–4.9) (Figure 3). Assuming all those who were LTFU died, 6-month mortality estimates increased to 11.9% (167/1422; 95% CI, 10.4–13.8%) among CrAg-negative individuals and 27.8% (20/72; 95% CI, 18.8–39.7%) among CrAg-positive individuals (HR, 2.53; 95% CI, 1.6–4.0). Other risk factors for mortality included older age, lower CD4 count, and not taking ART at baseline. Adjusting for sex, age, CD4 count, and ART status, cryptococcal antigenemia remained significantly associated with 6-month mortality (adjusted HR, 2.74; 95% CI, 1.6–4.7) (Tables 3 and 4).
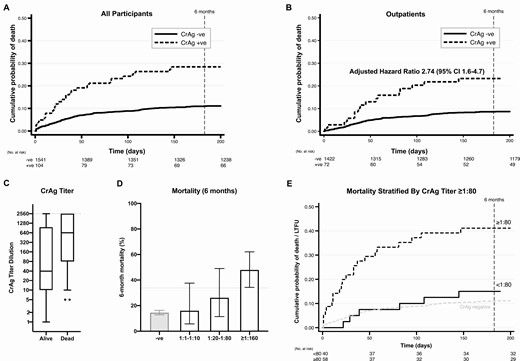
Six-month survival in individuals with human immunodeficiency virus with CD4 cell counts ≤100 cells/µL stratified by CrAg status. CrAg titers were measured in 98 of the 104 CrAg-positive baseline samples (with insufficient samples in the remaining 6 cases). The median titer was 1:160 (IQR, 1:10–1:2560). A, Kaplan-Meier survival curves for all 1645 individuals screened from time of initial CrAg test, stratified by CrAg status. B, Kaplan-Meier curves for the 1494 individuals screened as outpatients, stratified by CrAg status. Adjusted hazards for mortality by 6 months were 2.74 (95% CI, 1.6–4.7), adjusting for age, sex, CD4 count, and ART status (naive, defaulted, or on ART). C, Baseline CrAg titers in those who survived versus those who died or were LTFU. The box represents the 25th to 75th percentile with a line at the median, with error bars from the 10th to 90th percentiles and dots representing individual values outside the 10th and 90th percentiles. Note the maximum titer dilution measured was 1:2560, with dilutions above this recorded as >1:2560. D, Mortality rates increased with increasing titer; the dotted line represents the lower bound of the 95% CI for the ≥1:160 category. E, An antigen titer of <1:80 versus ≥ 1:80 provided the optimal discrimination between those who survived versus those who were LTFU or died (hazard ratio, 4.26; 95% CI, 1.8–10.3; P = .001). See Supplementary Table 3 for full cutoff analysis and Supplementary Figure 2 for receiver operating curves. Abbreviations: ART, antiretroviral therapy; CI, confidence interval; CrAg, cryptococcal antigen; IQR, interquartile range; LTFU, lost to follow-up; +ve, positive; –ve, negative.
Six-Month Mortality Outcomes in 1645 Patients With CD4 Cell Counts ≤100 Cells/µL Screened for Cryptococcal Antigenemia
| 6-Month Mortality (Lost = Censored) | 6-Month Mortality (Lost = Dead) | ||||||
|---|---|---|---|---|---|---|---|
| n | All Patients (95% CI) | CrAg Negative (95% CI) | CrAg Positive (95% CI) | All Patients (95% CI) | CrAg Negative (95% CI) | CrAg Positive (95% CI) | |
| Overalla | 1645 | 12.1% (10.6–13.8) | 11.1% (9.5–12.7) | 28.4% (20.6–38.5) | 15.9% (14.3–17.8) | 14.7% (13.0–16.6) | 33.7% (25.5–43.6) |
| Inpatientsb | 151 | 40.4% (32.8–49.0) | 40.5% (32.0–50.1) | 40.2% (25.0–60.0) | 47.7% (40.0–55.9) | 47.9% (39.4–57.2) | 46.9% (31.5–65.3) |
| Outpatients | 1494 | 9.2% (7.9–10.9) | 8.6% (7.2–10.2) | 23.3% (14.9–35.1) | 12.7% (11.1–14.5) | 11.9% (10.4–13.8) | 27.8% (18.8–39.7) |
Abbreviations: CI, confidence interval; CrAg, cryptococcal antigen; HR, hazard ratio.
aOverall HR in CrAg-positive versus CrAg-negative patients of 2.87 (95% CI, 1.9–4.3; P < .001) and assuming all those lost to follow-up had died (HR, 2.57; 95% CI, 1.8–3.7; P < .001).
bAmong those who were inpatients at the time of screening, CrAg status was not associated with 6-month mortality (HR, .98; 95% CI, .5–1.8) and assuming all those who were lost to follow-up had died (HR, .99; 95% CI, .6–1.7).
Associations Between Baseline Variables and 6-Month Outcomes Among Outpatients (n = 1494)
| Variable and Category | n | 6-Month Mortality, % (95% CI) | HR (95% CI) | P | Adjusted HR (95% CI) | P |
|---|---|---|---|---|---|---|
| Six-month mortality (LTFU censored) | ||||||
| CrAga | ||||||
| Negative | 1422 | 8.6 (7.2–10.2) | Base | <.001 | Base | <.001 |
| Positive | 72 | 23.3 (14.9–35.1) | 2.93 (1.7–4.9) | 2.74 (1.6–4.7) | ||
| Sex | ||||||
| Female | 740 | 9.2 (7.3–11.5) | Base | .900 | Base | .574 |
| Male | 754 | 9.4 (7.5–11.8) | 1.02 (.7–1.4) | .91 (.6–1.3) | ||
| Age | ||||||
| Per 10 years | … | … | 1.19 (1.0–1.4) | .033 | 1.28 (1.1–1.5) | .004 |
| CD4 count | ||||||
| >50 cells/µL | 856 | 5.7 (4.3–7.5) | Base | <.001 | Base | <.001 |
| 25–49 cells/µL | 292 | 13.5 (10.0–18.0) | 2.47 (1.6–3.8) | 2.25 (1.5–3.5) | ||
| <25 cells/µL | 346 | 14.9 (11.5–19.3) | 2.78 (1.9–4.1) | 2.56 (1.7–3.8) | ||
| ART status | ||||||
| On ART | 476 | 5.4 (3.7–7.8) | Base | <.001 | Base | .005 |
| Defaulted | 205 | 9.4 (6.0–14.3) | 1.77 (1.0–3.2) | 1.49 (.8–2.7) | ||
| Naiveb | 813 | 11.6 (9.6–14.1) | 2.23 (1.4–3.5) | 2.00 (1.3–3.1) | ||
| Six-month mortality (LTFU assumed to have died) | ||||||
| CrAga | ||||||
| Negative | 1422 | 11.9 (10.4–13.8) | Base | <.001 | Base | .001 |
| Positive | 72 | 27.8 (18.9–39.7) | 2.53 (1.6–4.0) | 2.30 (1.4–3.7) | ||
| Sex | ||||||
| Female | 740 | 12.4 (10.3–15.0) | Base | .776 | Base | .704 |
| Male | 754 | 13.0 (10.8–15.6) | 1.04 (.8–1.4) | .96 (.7–1.3) | ||
| Age | ||||||
| Per 10 years | … | … | 1.14 (1.0–1.3) | .060 | 1.21 (1.1–1.4) | .006 |
| CD4 count | ||||||
| >50 cells/µL | 856 | 7.7 (6.1–9.7) | Base | <.001 | Base | <.001 |
| 25–49 cells/µL | 292 | 17.8 (13.9–22.7) | 2.43 (1.7–3.5) | 2.27 (1.6–3.3) | ||
| <25 cells/µL | 346 | 20.8 (16.9–25.5) | 2.92 (2.1–4.1) | 2.74 (1.9–3.9) | ||
| ART status | ||||||
| On ART | 476 | 8.0 (5.9–10.8) | Base | <.001 | Base | .001 |
| Defaulted | 205 | 10.7 (7.2–15.8) | 1.35 (.8–2.3) | 1.12 (.7–1.9) | ||
| Naiveb | 813 | 16.0 (13.6–18.7) | 2.08 (1.5–3.0) | 1.83 (1.3–2.6) |
All variables shown were included in the adjusted model (CrAg status, sex, age, CD4 count, and ART status).
Abbreviations: ART, antiretroviral therapy; CI, confidence interval; CM, cryptococcal meningitis; CrAg, cryptococcal antigen; HR, hazard ratio; IQR, interquartile range; LTFU, lost to follow-up.
aThese findings remained consistent in adjusted models (1) excluding those with a prior history of CM (adjusted HR in CrAg positives versus CrAg negatives of 2.70; 95% CI, 1.5–4.7; P = .001; adjusted HR, 2.36; 95% CI,1.4–3.9; P = .001, if LTFU assumed to have died) and (2) excluding those found to have cryptococcal meningitis at baseline (adjusted HR, 2.25; 95% CI, 1.2–4.3; P = .015; adjusted HR, 1.83; 95% CI, 1.0–3.3; P = .045, if LTFU assumed to have died).
bART initiation data following CrAg screening (in those not on ART at baseline) were incomplete, available for 793 (78%) of the 1018 patients not on ART, of whom 89% (705) initiated ART a median of 26 days (IQR, 14–45 days) after screening. ART was initiated in a significantly higher proportion of ART-naive individuals than treatment defaulters: 90% (591 out of 654) versus 82% (114 out of 139) (P = .004).
Antiretroviral Therapy Status at CrAg Screening and Risk of Cryptococcal Meningitis and Death
Although ART status at the time of screening was not associated with rates of cryptococcal antigenemia, it was strongly associated with prevalence of baseline CM among outpatients, risk of subsequent CM in those without meningitis at baseline, and mortality in the CrAg-positive population. Baseline CM was identified in 34% (12/35) of ART-naive CrAg-positive outpatients, 9% (1/11) of defaulters, and 4% (1/25) of those on ART (P = .008); notably, the individual on ART had a viral load greater than 400 000 copies/mL. Of the 8 CrAg-positive patients who developed CM during follow-up, only 1 patient was prescribed ART at the time of screening, an individual with a CD4 count of 18 cells/µL despite over 1 year on ART with no documented viral load. At 6 months postscreening, 40% (14/35) of individuals who were ART naive at time of screening had died and 11% (4) were LTFU; 18% (2/11) of treatment defaulters died (with none LTFU), and no (0/26) individuals on ART at the time of screening died or were LTFU (P < .001) (Supplementary Figure 2).
Cryptococcal Antigen Titers and Risk Stratification
CrAg titers were measured in 98 of the 104 CrAg-positive baseline samples; titers were significantly higher among patients who died or were LTFU than in survivors (1:640 [IQR, 1:80–1:2560] vs 1:40 [IQR, 1:10–1:640]; P = .003) (Figure 3). Median baseline titers were 1:640 (IQR, 1:20–1:2560) in ART-naive patients, 1:80 (IQR, 1:10–1:160) in defaulters, and 1:20 (IQR, 1:10–1:160) in those on ART (P = .02).
Although increasing CrAg titers were significantly associated with risk of poor outcomes, it was not possible to effectively classify individuals using a single titer cutoff: ROC analysis (Supplementary Figure 3) showed only moderate ability to discriminate between (1) individuals who lived or died (area under ROC curve [AUC] = .647; 95% CI, .53–.76), (2) individuals who lived versus those who died or were LTFU (AUC = .682; 95% CI, .58–.79), and (3) cryptococcal free survival versus confirmed CM, death, or LTFU (AUC = .704; 95% CI, .60–.81). Analyses to determine an optimal titer cutoff to classify individuals who lived versus those who died or were LTFU using the Youden index (J) and cutoff analysis derived by Cox regression gave consistent results, indicating an optimal cutoff of 1:80 or greater (Supplementary Table 3), yielding a sensitivity of 82.4% (95% CI, 66–93%) and specificity of 53.1% (95% CI, 40–66%) and a positive predictive value of 48.3% (95% CI, 35–62%) and a negative predictive value of 85.0% (95% CI, 70–94%) in our population.
DISCUSSION
In Botswana’s mature ART program, the overall proportion of CD4 tests performed with counts 100 cells/µL or less was low; however, relatively large numbers of individuals with HIV are still developing advanced HIV disease. Many of these individuals are now ART experienced, with more than half of CD4 counts of 100 cells/µL or less in patients either currently on ART or who defaulted treatment. We found an overall CrAg prevalence of 6.3% in patients with CD4 cell counts of 100 cells/µL or less in Botswana from 2014 to 2016, and 4.8% limited to those screened in outpatient clinics, comparable to rates seen in ART-naive cohorts in southern and east Africa [6, 8, 24].
Studies assessing the value of CrAg screening in this ART-experienced population were identified as a research priority in recent WHO cryptococcal management guidelines [10]. The prevalence of cryptococcal antigenemia did not differ significantly according to ART status, with similar rates in ART-experienced and ART-naive individuals—findings consistent with a recent systematic review that found similar CrAg prevalence among cohorts including only ART-naive individuals and cohorts including both ART-naive and ART-experienced patients [25]. While CrAg prevalence did not differ significantly among ART-naive and ART-experienced individuals, our findings showed that CrAg-positive patients taking ART at the time of screening had significantly lower CrAg titers, lower risk of baseline and incident CM, and were at lower risk of dying. No CrAg-positive individuals on effective ART had CM at baseline or developed incident CM; and all 26 CrAg-positive individuals on ART at screening were alive and in care at 6 months compared with just 57% (26/46) of those not on ART. Our findings are likely to have broad generalizability to high-HIV-prevalence African settings as ART programs and treatment provision continue to be expanded in the region.
Reflex CrAg screening led to repeat testing of a large number of CD4 samples (22% overall) and identified 10 additional CrAg-positive cases (10% of the total). Half of these were individuals who had initiated or continued ART following their initial screen and had low CrAg titers and good outcomes, in whom repeat screening would be of little benefit. The other half were individuals who had not initiated effective ART following their initial CrAg test and were at high risk of cryptococcal-related morbidity and mortality. These findings demonstrate that repeat CrAg testing in reflex screening programs is potentially worthwhile, enabling identification of individuals who would benefit from antifungal therapy. They also underscore the importance of ensuring that ART programs effectively identify individuals with low CD4 counts and do not unnecessarily delay ART initiation in this population. As HIV-treatment programs, including Botswana, move to test-and-treat it is critical that CD4 testing guidelines and capacity are maintained in order to effectively implement opportunistic infection-prevention interventions and differentiated care pathways.
As previously described [5, 6, 8, 14, 26, 27], early mortality rates among individuals with CD4 counts of 100 cells/µL or less were high, and cryptococcal antigenemia strongly associated with increased risk of mortality. Studies in which CrAg-positive patients received pre-emptive fluconazole treatment have reported a residual 2.2–3.0-fold increased mortality risk, even following adjustment for CD4 count [6, 8, 26]. Our data showing an adjusted hazards of death of 2.7 in CrAg-positive individuals are consistent with these prior cohorts of individuals treated with high-dose fluconazole, indicating that more intensive management may be required to abrogate the cryptococcal-related mortality in this patient group; however, the lack of data available regarding fluconazole prescriptions in our study limits our ability to draw firm conclusions regarding the effectiveness of the recommended management.
Accumulating evidence indicates that it may be possible to risk-stratify CrAg-positive individuals using CrAg titers, identifying those at highest risk of cryptococcal-related mortality for more intensive antifungal treatment [5, 14, 28]. CrAg titers of 1:160 or higher were found to be strongly associated with CM at baseline in a cohort of South African outpatients [28], and titers of 1:160 or higher conferred a 2.6-fold higher risk of 6-month mortality in 151 CrAg-positive participants in a Ugandan trial [14]. Our data showed that CrAg titers of 1:80 or higher provided the optimal discrimination between patients who survived or died within 6 months, with similar mortality rates in those with titers less than 1:80 and CrAg-negative individuals; however, it was not possible to fully risk-stratify individuals using a single titer cutoff.
A significant strength of our analysis is the comprehensive follow-up made possible by the use of robust electronic medical records and laboratory information systems [20]. However, our study has the limitation that the study team had no direct role in patient management, and details regarding symptoms and treatment of CrAg-positive individuals were often lacking in patients’ charts. The number of outpatients undergoing LP following positive CrAg tests was low (20/72, 27.8%), we were unable to determine whether this was due to healthcare provider or patient factors, and almost certainly under-ascertained baseline CM in asymptomatic individuals, which recent evidence suggests could be as high as 34% [28]. We were also unable to confidently establish the proportion of CrAg-positive outpatients who received fluconazole, precluding detailed analysis of the impact of high-dose fluconazole pre-emptive treatment on outcomes.
In conclusion, reflex CrAg screening in an ART-experienced population revealed CrAg-positivity rates comparable to those seen in ART-naive populations. Repeat screening identified an important population of individuals not on effective ART who seroconverted to CrAg positivity and were at substantial risk of cryptococcal-related morbidity and mortality. CrAg titers of 1:80 or higher may help identify the individuals at highest risk of death for more intensive management.
Supplementary Data
Supplementary materials are available at Clinical Infectious Diseases online. Consisting of data provided by the authors to benefit the reader, the posted materials are not copyedited and are the sole responsibility of the authors, so questions or comments should be addressed to the corresponding author.
Notes
Disclaimer. The views expressed are those of the authors and not necessarily those of the UK National Health Service, National Institute for Health Research, the Department of Health and Social Care, or other funding entities.
Financial support. This work was supported by the Penn Center for AIDS Research (CFAR), a program funded by the US National Institutes of Health (NIH) (grant number P30AI045008). Additional funding for this work was from the NIH National Institute of Allergy and Infectious Diseases (grant numbers T32AI007044 and F32AI140511; to M. W. T.), and the US Centers for Disease Control and Prevention Foundation (to J. N. J.). J. N. J. reports additional support from the UK National Health Service, and the National Institute for Health Research, using Official Development Assistance funding through a Global Health Professorship (grant number RP-2017-08-ST2-012) and grants from Wellcome Trust, Medical Research Council UK, and the European and Developing Countries Clinical Trials Partnership.
Potential conflicts of interest. The authors: No reported conflicts of interest. All authors have submitted the ICMJE Form for Disclosure of Potential Conflicts of Interest.

