


Abstract
Our aim in this study was to identify a prognostic biomarker to predict the disease prognosis and reduce the mortality rate of coronavirus disease 2019 (COVID-19), which has caused a worldwide pandemic.
COVID-19 patients were randomly divided into training and test groups. Univariate and multivariate Cox regression analyses were performed to identify the disease prognosis signature, which was selected to establish a risk model in the training group. The disease prognosis signature of COVID-19 was validated in the test group.
The signature of COVID-19 was combined with the following 5 indicators: neutrophil count, lymphocyte count, procalcitonin, age, and C-reactive protein. The signature stratified patients into high- and low-risk groups with significantly relevant disease prognosis (log-rank test, P < .001) in the training group. The survival analysis indicated that the high-risk group displayed substantially lower survival probability than the low-risk group (log-rank test, P < .001). The area under the receiver operating characteristic (ROC) curve showed that the signature of COVID-19 displayed the highest predictive accuracy regarding disease prognosis, which was 0.955 in the training group and 0.945 in the test group. The ROC analysis of both groups demonstrated that the predictive ability of the signature surpassed the use of each of the 5 indicators alone.
The signature of COVID-19 presents a novel predictor and prognostic biomarker for closely monitoring patients and providing timely treatment for those who are severely or critically ill.
A type of pneumonia with an unknown etiology, termed coronavirus disease 2019 (COVID19), caused a rapidly spreading outbreak induced by severe acute respiratory syndrome coronavirus-2 (SARS-CoV-2) [1, 2]. It was declared a public health emergency of international concern on 30 January 2020 by the World Health Organization.
China has enforced the most drastic of all classic public health measures to bring the epidemic under control, but the situation in other countries is not optimistic. Since late February 2020, new cases have been reported daily in other parts of the world. By 25 March 2020, the cumulative number of confirmed cases abroad passed the 340 000 mark, with more than 15 000 deaths, which far exceeded the cases in China. In addition to taking strict preventative measures against the epidemic to curb rapid large-scale outbreaks, the timely treatment of severely or critically ill patients plays a significant role in reducing COVID-19 fatalities.
Previous studies on the emergence of this novel coronavirus and its clinical features suggested that older age, male gender, underlying comorbidities, elevated D-dimer at admission, and progressive radiographic deterioration on follow-up computed tomography might be risk factors for patients infected with SARS-CoV-2 [3, 4]. Until now, no antiviral treatment or vaccine has proven effective against the coronavirus infection. Infected patients classified as being severely or critically ill may develop multiple organ malfunctions, including acute respiratory distress syndrome and acute cardiac injury [5–7], emphasizing an urgent need to establish a predictive model for monitoring a patient’s risk of developing critical disease symptoms and reducing the mortality rate.
In this study, we identify a significant, independent COVID-19 signature in patients via multivariate Cox regression that may serve as a foundation for accurate individual diagnosis and treatment of severely or critically ill patients.
METHODS
Study Design and Patient Characteristics
This research represented a single-center, retrospective study performed from 27 January 2020 to 26 February 2020 at Wuhan Fourth Hospital. A total of 270 patients infected with laboratory-identified SARS-CoV-2 were classified into 2 groups, moderately ill and severely or critically ill, according to the Guidance for Corona Virus Disease 2019 (6th edition) [8], as announced by the National Health Commission of China. The definitions of moderately ill, severely ill, and critically ill are listed in Supplementary Table 1.
The research team consisted of experienced respiratory physicians, radiologists, and laboratory physicians. Missing data or data that required clarification via the available records were obtained through direct communication with the attending physician and other healthcare providers. The patients were randomly divided into training and test groups.
The patient characteristics were obtained from electronic medical records and included clinical features, signs and symptoms, comorbidities, imaging features of the chest, laboratory findings, treatments, and antiviral or antiinflammatory drugs. This information was documented on a standardized record form.
Real-Time Reverse-Transcription Polymerase Chain Reaction Assay for SARS-CoV-2
Throat swab samples were collected from the patients suspected of being infected with COVID-19 for the extraction of SARS-CoV-2 RNA. The respiratory samples were transferred into a collection tube that contained 2 mL cell lysates and vortexed for 30 seconds. The RNA was extracted from the samples using the appropriate kit (Liferiver, Shanghai, China). After 30 minutes of inactivation at 56°C, the respiratory samples were left to stand for 10 minutes, after which 200 µL of the inactivated samples was used for nucleic acid extraction and the detection of SARS-CoV-2. Three target genes, ORF1ab, N, and E, were simultaneously amplified and tested during the real-time reverse-transcription polymerase chain reaction (RT-PCR) assay, which was performed using a novel coronavirus (2019-nCoV) Real-Time Multiplex RT-PCR Kit (Liferiver, Shanghai, China) according to the manufacturer’s protocol.
Clinical Laboratory Measurement
The clinical laboratory investigation included a complete blood count and biochemical serum tests (including liver and kidney function), as well as determination of the coagulation mechanism and myocardial enzyme spectrum.
Construction of the Risk Signature in the Training Group
A previously reported method was adopted for construction of the signature module [9–11]. First, a univariate Cox regression analysis was used to determine which indicators were associated with disease prognosis, after which 25 significantly correlated indicators were identified (P value < .05). A multivariate Cox regression analysis was used to construct a model that consisted of 5 indicators (neutrophil count, lymphocyte count, procalcitonin, age, and C-reactive protein) to assess the risk of prognosis (P value < .05, concordance index, 0.93 and Akaike information criterion [AIClowest]) and screen for the most powerful determiners. This process allowed for the construction of a model capable of assessing the risk factors of prognosis according to the following equation:
where N is the representative number of samples in the model, is the value of each indicator in the respective samples, and is a single factor of the Cox regression coefficient. Risk Score (RS) represents the multinode weighted sum of the risk scores. The median value was considered the cutoff, with values exceeding this mark regarded as high-risk and those below the cutoff as low-risk.
Statistical Analyses
The signature of COVID-19 selected above was used to construct a risk model, using the median risk score as the cutoff value to divide the training and test patients into either high-risk or low-risk groups. The predictive value of the signature in the test dataset was validated using survival analysis, as well as receiver operating characteristic (ROC) analysis. All assessments were performed using the R project (https://cloud.r-project.org/)(version 3.5.1) with the pROC and disease prognosis packages downloaded from Bioconductor (https://bioconductor.org).
RESULTS
Patient Characteristics
A total of 270 patients with confirmed COVID-19 participated in the study, of which 203 (75.2%) were moderately ill and 67 (34.8%) were severely ill. As shown in Table 1, the median age was 62 years (interquartile range [IQR], 50–69); 139 (51.5%) of the patients were male. The median duration from hospital admission to the eventual result was 9 days (IQR, 6–13) for all patients. Most patients (248; 91.9%) exhibited a bilateral distribution of patchy shadows or ground-glass opacity, a trend that was the same for the moderately ill patients (187; 92.1%) as well as those who were severely or critically ill (61; 91%). A total of 139 (51.5%) patients exhibited fundamental diseases, such as hypertension (81; 30%) and diabetes (35; 13.0%), which were the most common comorbidities in both groups. According to the results, fever (202; 74.8%), cough (181; 67%), and fatigue (116; 43%) were the most common symptoms exhibited by the patients. The most common treatment of pneumonia involved antiviral or antiinflammatory drugs. The laboratory results listed in Table 2 indicate that the neutrophil count (≥6.3 × 10⁹/L, 37.3%), neutrophil-to-lymphocyte ratio (≥3.3, 76.1%), C-reactive protein (≥10 mg/L, 87.9%), procalcitonin (≥0.05 ng/mL, 81.7%), lactate dehydrogenase (≥250 U/L, 83.8%), and D-dimer (≥1 mg/L, 55.8%) were higher in the severely or critically ill patients than in the moderately ill patients, while the lymphocyte count (<0.6 × 10⁹/L, 34.3%) and albumin (<34 g/L, 64.2%) were lower.
Clinical Characteristics of Patients With Coronavirus Disease 2019
| Total (N = 270) | Moderate (n = 203) | Severe or Critical (n = 67) | |
|---|---|---|---|
| Characteristic | |||
| Age, years | 62 (50–69) | 61 (50–68) | 66 (54–73) |
| Sex | |||
| Male | 139 (51.5%) | 86 (42.4%) | 45 (67.2%) |
| Female | 131 (48.5%) | 117 (57.6%) | 22 (32.8%) |
| Time from onset of symptoms to hospital admission, days | 10 (7–15) | 10 (7–15) | 7 (6–10) |
| Time from hospital admission to outcome, days | 9 (6–13) | 8 (7–13) | 10 (5–18) |
| Smoking history, yes | 14 (5.2%) | 7 (3.4%) | 7 (10.4%) |
| Drinking history, yes | 14 (5.2%) | 6 (3%) | 8 (11.9%) |
| Respiratory rate, breaths per minute | 20 (20–22) | 20 (19–22) | 22 (20–25) |
| ≥24 breaths per minute | 37 (13.7%) | 16 (7.9%) | 21 (31.3%) |
| Distribution of patchy shadows or ground-glass opacity | |||
| Unilateral | 22 (8.1%) | 16 (7.9%) | 6 (9%) |
| Bilateral | 248 (91.9%) | 187 (92.1%) | 61 (91%) |
| Any comorbidity | 139 (51.5%) | 99 (48.8%) | 40 (59.7%) |
| Hypertension | 81 (30%) | 59 (29.1%) | 22 (32.8%) |
| Diabetes | 35 (13.0%) | 27 (13.3%) | 8 (11.9%) |
| Other heart disease | 11 (4.1%) | 5 (2.5%) | 6 (9.0%) |
| Chronic obstructive pulmonary disease | 10 (3.7%) | 7 (3.4%) | 3 (4.5%) |
| Malignancy | 9 (3.3%) | 3 (1.5%) | 6 (9.0%) |
| Chronic kidney disease | 8 (3.0%) | 4 (2.0%) | 4 (6.0%) |
| Cerebral infarction | 2 (0.7%) | 1 (0.5%) | 1 (1.5%) |
| Other comorbidities | 37 (13.7%) | 28 (13.8%) | 9 (13.4%) |
| Signs and symptoms | |||
| Fever | 202 (74.8%) | 150 (73.9%) | 52 (77.6%) |
| Cough | 181 (67%) | 132 (65%) | 49 (73.1%) |
| Sputum | 63 (23.3%) | 43 (21.2%) | 20 (29.9%) |
| Dyspnea | 45 (16.7%) | 19 (9.4%) | 26 (38.8%) |
| Fatigue | 116 (43%) | 84 (41.4%) | 32 (47.8%) |
| Chest tightness | 74 (27.4%) | 46 (22.7%) | 28 (41.8%) |
| Nausea | 21 (7.8%) | 13 (6.4%) | 8 (11.9%) |
| Dizziness | 13 (4.8%) | 7 (3.4%) | 6 (9%) |
| Headache | 13 (4.8%) | 8 (3.9%) | 5 (7.5%) |
| Panting | 31 (11.5%) | 20 (9.9%) | 11 (16.4%) |
| Pantalgia | 11 (4.1%) | 7 (3.4%) | 4 (6%) |
| Diarrhea | 42 (15.6%) | 33 (16.3%) | 9 (13.4%) |
| Nasal congestion | 1 (0.4%) | 1 (0.5%) | 0 (0%) |
| Vomiting | 8 (3%) | 3 (1.5%) | 5 (7.5%) |
| Myalgia | 4 (1.5%) | 3 (1.5%) | 1 (1.5%) |
| Arthralgia | 2 (0.7%) | 2 (1%) | 0 (0%) |
| Polypnea | 46 (17%) | 34 (16.7%) | 12 (17.9%) |
| Sore throat | 19 (7%) | 14 (6.9%) | 5 (7.5%) |
| Rhinorrhea | 2 (0.7%) | 2 (1%) | 0 (0%) |
| Hemoptysis | 2 (0.7%) | 2 (1%) | 0 (0%) |
| Cold intolerance | 5 (1.9%) | 4 (2%) | 1 (1.5%) |
| Syncope | 3 (1.1%) | 0 (0%) | 3 (4.5%) |
| Cardiopalmus | 7 (2.6%) | 4 (2%) | 3 (4.5%) |
| Chest pain | 12 (4.4%) | 8 (3.9%) | 4 (6%) |
| Abdominal pain | 4 (1.5%) | 4 (2%) | 0 (0%) |
| Antiviral or antiinflammatory drugs | |||
| Oseltamivir | 85 (31.5%) | 64 (31.5%) | 21 (31.3%) |
| Lopinavir | 134 (49.6%) | 94 (46.3%) | 40 (59.7%) |
| Arbidol | 89 (33.0%) | 61 (30.0%) | 28 (41.8%) |
| Lianhua Qingwen | 173 (64.1%) | 137 (67.5%) | 36 (53.7%) |
| Traditional Chinese medicine | 39 (14.4%) | 31 (15.3%) | 8 (11.9%) |
| Ribavirin | 11 (4.1%) | 7 (3.4%) | 4 (6.0%) |
| Methylprednisolone | 36 (13.3%) | 11 (5.4%) | 25 (37.3%) |
| Diammonium glycyrrhizinate enteric-coated capsules | 13 (4.8%) | 10 (4.9%) | 3 (4.5%) |
| Remdesivir | 4 (1.5%) | 2 (1.0%) | 2 (3.0%) |
Data are presented as median (interquartile range), n (n/N%), where N is the total number of confirmed patients.
Laboratory Results for Patients With Coronavirus Disease 2019
| Laboratory Finding | Total (N = 270) | Moderate (n = 203) | Severe or Critical (n = 67) |
|---|---|---|---|
| White blood cell count, ×109/L | 5.4 (4.2–6.9) | 5.2 (4.2–6.5) | 6.3 (4.3–9.8) |
| <3.5 | 33/270 (12.2%) | 25/203 (12.3%) | 8/67 (11.9%) |
| 3.5–9.5 | 210/270 (77.8%) | 171/203 (84.2%) | 39/67 (58.2%) |
| >9.5 | 27/270 (10%) | 7/203 (3.4%) | 20/67 (29.9%) |
| Neutrophil count, ×109/L | 3.3 (2.5–4.6) | 3.1 (2.4–4.2) | 4.7 (2.8–8.5) |
| <6.3 | 235/270 (87%) | 193/203 (95.1%) | 42/67 (62.7%) |
| ≥6.3 | 35/270 (13%) | 10/203 (4.9%) | 25/67 (37.3%) |
| Lymphocyte count, ×109/L | 1.2 (0.8–1.7) | 1.4 (1.0–1.8) | 0.7 (0.5–1.2) |
| <0.6 | 30/270 (11.1%) | 7/203 (3.4%) | 23/67 (34.3%) |
| 0.6–0.8 | 30/270 (11.1%) | 19/203 (9.4%) | 11/67 (16.4%) |
| ≥0.8 | 210/270 (77.8%) | 177/203 (87.2%) | 33/67 (49.3%) |
| Neutrophil-to-lymphocyte ratio | 2.6 (1.6–4.5) | 2.2 (1.5–3.4) | 5.8 (3.3–13.0) |
| <3.3 | 167/270 (61.9%) | 151/203 (74.4%) | 16/67 (23.9%)) |
| ≥3.3 | 103/270 (38.1%) | 25/203 (25.6%) | 51/67 (76.1%) |
| Monocyte count, ×109/L | 0.4 (0.3–0.6) | 0.4 (0.3–0.6) | 0.4 (0.3–0.7) |
| Platelet count, ×109 per L | 229 (169.5–297.8) | 241 (185–306) | 190 (129–248) |
| <125 | 30/270 (11.1%) | 16/203 (7.9%) | 14/67 (20.9%) |
| ≥125 | 240/270 (88.9%) | 187/203 (92.1%) | 53/67 (79.1%) |
| C-reactive protein, mg/L | 12.6 (3.4–43.5) | 7.1 (2.8–21.2) | 58.9 (29.4–111.0) |
| <10 | 113/246 (45.9%) | 106/188 (56.4%) | 7/58 (12.1%) |
| ≥10 | 133/246 (54.1%) | 82/188 (43.6%) | 51/58 (87.9%) |
| Procalcitonin, ng/mL | 0.05 (0.03–0.12) | 0.04 (0.03–0.06) | 0.14 (0.06–0.43) |
| <0.05 | 158/252 (62.7%) | 147/192 (76.6%) | 11/60 (18.3%) |
| ≥0.05 | 94/252 (37.3%) | 45/192 (23.4%) | 49/60 (81.7%) |
| Erythrocyte sedimentation rate, mm/h | 30.5 (16.8–54.0) | 30.0 (16.0–54.0) | 32 (20.0–68.8) |
| Alanine aminotransferase, U/L | 22.0 (16.0–37.3) | 21.0 (15.0–36.0) | 26.0 (17.0–45.0) |
| Aspartate aminotransferase, U/L | 27.0 (20.0–38.3) | 24.0 (18.0–32.0) | 36.0 (28.0–59.0) |
| <35 | 192/270 (71.1%) | 160/203 (78.8%) | 32/67 (47.8%) |
| ≥35 | 78/270 (28.9%) | 43/203 (21.2%) | 35/67 (52.2%) |
| γ-glutamine transpeptidase, U/L | 27.0 (19.0–48.5) | 24.0 (17.0–42.0) | 37.0 (26.0–75.0) |
| <60 | 195/270 (72.2%) | 158/203 (78.8%) | 37/67 (55.2%) |
| ≥60 | 75/270 (27.8%) | 45/203 (22.2%) | 30/67 (44.8%) |
| Total serum protein, g/L | 63.4 (59.4–68.2) | 63.8 (59.7–68.3) | 62.4 (57.9–68.0) |
| Albumin, g/L | 34.6 (31.8–37.6) | 35.5 (33.0–38.1) | 32.6 (29.3–34.9) |
| <34 | 116/270 (43%) | 73/203 (36%) | 43/67 (64.2%) |
| ≥34 | 154/270 (57%) | 130/270 (64%) | 24/67 (35.8%) |
| Serum potassium, mmol/L | 4.1 (3.7–4.5) | 4.1 (3.7–4.4) | 4.0 (3.6–4.6) |
| Serum sodium, mmol/L | 140.0 (137.0–143.0) | 140.2 (137.0–143.0) | 139.1 (134.9–144.0) |
| Serum chloride, mmol/L | 102 (99.1–105.1) | 102.5 (100–105.5) | 100.9 (96.9–104) |
| Total serum calcium, mmol/L | 2.14 (2.02–2.25) | 2.17 (2.05–2.27) | 2.07 (1.93–2.17) |
| <2.11 | 119/269 (44.2%) | 76/203 (37.4%) | 43/66 (65.2%) |
| ≥2.11 | 150/269 (55.8%) | 127/203 (62.6%) | 23/66 (34.8%) |
| Blood urea nitrogen, mmol/L | 4.7 (3.6–5.7) | 4.5 (3.5–5.3) | 5.1 (3.6–7.7) |
| <8.8 | 250/269 (92.9%) | 196/203 (96.6%) | 54/66 (81.8%) |
| ≥8.8 | 19/269 (7.1%) | 7/203 (3.4%) | 12/66 (18.2%) |
| Creatinine, μmol/L | 64.3 (53.5–79.7) | 60.8 (51.9–73.9) | 73.4 (63.1–92.1) |
| <81 | 208/269 (77.3%) | 166/203 (81.8%) | 42/66 (63.6%) |
| ≥81 | 61/269 (22.7%) | 37/203 (18.2%) | 24/66 (36.4%) |
| Uric acid, μmol/L | 270.0 (216.5–334.5) | 270.0 (218.0–335.0) | 265.0 (213.5–332.5) |
| Creatine kinase, U/L | 83.5 (52.5–153.5) | 68.0 (49.0–112.0) | 166.0 (85.5–493.5) |
| <200 | 104/128 (81.3%) | 85/91 (93.4%) | 19/37 (51.4%) |
| ≥200 | 24/128 (18.8%) | 6/91 (6.6%) | 18/37 (48.6%) |
| Creatine kinase myocardial band isoenzyme, U/L | 8.0 (5.0–14.0) | 6.0 (4.0–10.0) | 14.0 (8.5–19.0) |
| <24 | 121/128 (94.5%) | 88/91 (96.7%) | 33/37 (89.2%) |
| ≥24 | 7/128 (5.5%) | 3/91 (3.3%) | 4/37 (10.8%) |
| Lactate dehydrogenase, U/L | 228.0 (184.3–310.3) | 199.0 (166.0–257.0) | 353.0 (277.5–580.5) |
| <250 | 70/128 (54.7%) | 64/91 (70.3%) | 6/37 (16.2%) |
| ≥250 | 58/128 (45.3%) | 27/91 (29.7%) | 31/37 (83.8%) |
| Prothrombin time, s | 11.5 (11.0–12.1) | 11.4 (10.9–11.9) | 12.0 (11.4–12.8) |
| <13 | 189/205 (92.2%) | 148/153 (96.7%) | 41/52 (78.8%) |
| ≥13 | 16/205 (7.8%) | 5/153 (3.3%) | 11/52 (21.2%) |
| Activated partial thromboplastin time, s | 26.1 (23.8–29.7) | 25.8 (23.5–28.9) | 28.2 (25.2–32.6) |
| <40 | 196/205 (95.6%) | 148/153 (96.7%) | 48/52 (92.3%) |
| ≥40 | 9/205 (4.4%) | 5/153 (3.3%) | 4/52 (7.7%) |
| Thrombin time, s | 18.8 (17.9–19.9) | 19.0 (18.1–19.9) | 18.3 (17.3–19.9) |
| <21 | 184/205 (89.8%) | 139/153 (90.8%) | 45/52 (86.5%) |
| ≥21 | 21/205 (10.2%) | 14/153 (9.2%) | 7/52 (13.5%) |
| Fibrinogen, g/L | 3.3 (2.5–4.3) | 3.2 (2.5–4.1) | 3.7 (2.7–4.8) |
| <4 | 143/205 (69.8%) | 111/153 (72.5%) | 32/52 (61.5%) |
| ≥4 | 62/205 (30.2%) | 42/153 (27.5%) | 20/52 (38.5%) |
| D-dimer, mg/L | 0.5 (0.3–1.3) | 0.5 (0.3–1.0) | 1.1 (0.5–3.0) |
| <0.55 | 104/207 (50.2%) | 89/155 (57.4%) | 15/52 (28.8%) |
| 0.55–1 | 32/207 (15.5%) | 24/155 (15.5%) | 8/52 (15.4%) |
| ≥1 | 71/207 (34.3%) | 42/155 (27.1%) | 29/52 (55.8%) |
Data are shown as median (interquartile range), n (n/N%).
Construction of the Prognostic Signature in the Training Group
The selected technical route of the prognostic signature of COVID-19 is displayed in Figure 1. The training group (n = 210) was used to explore the association between disease prognosis and the occurrence of the indicators. Univariate Cox regression analysis of the indicator data was initially performed, with the survival time and overall status as the dependent variables. Twenty-five indicators that significantly correlated with the disease prognosis in the patients were identified (P value < .05; Figure 2, Supplementary Table 2). A multivariate Cox regression analysis (Figure 3) was used to construct a model that consisted of 5 indicators (neutrophil count, lymphocyte count, procalcitonin, age, and C-reactive protein) to assess the risk of the prognosis and screen for the most powerful prognostic determiners. The risk scores (Supplementary Table 3) of the combination of these 5 indicators were determined as follows:
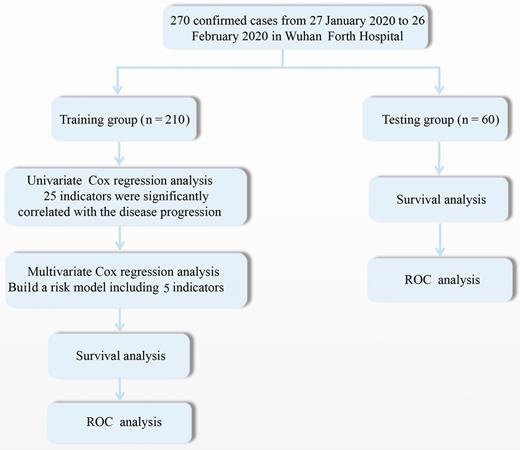
Study flow diagram. Abbreviation: ROC, receiver operating characteristic.
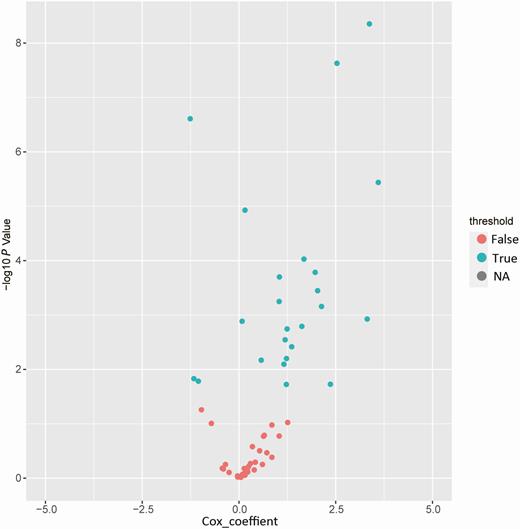
Identification of the coronavirus disease 2019 (COVID-19) signature in the training group. Univariate Cox regression analysis of the indicator expression profiling data in the training group, which are used to predict the power of the prognostic signature of COVID-19 in the training group. Abbreviation: NA, not available.
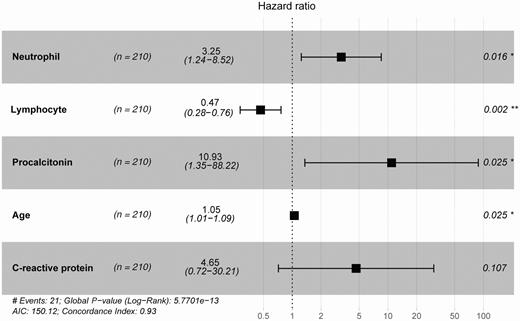
Identity of the disease prognosis signature of coronavirus disease 2019. Multivariate Cox regression analysis of the signature associated with disease prognosis. *, P < .05; **, P < .01. Abbreviation: AIC, Akaike information criterion.
where RS is the risk score and ID is the indicator value.
Determination of the Disease Prognosis Power of the Signature of COVID-19 in the Training and Test Dataset
The analysis represented the risk score of the selected signature of COVID-19 for each patient. A median risk score was used to divide the training group into a low-risk group (n = 104) and a high-risk group (n = 106). The results of the survival analysis revealed that the high-risk group demonstrated significantly lower survival rates than the low-risk group (log-rank test, P < .001; Figure 4A). As the duration after disease diagnosis increased, the survival probability of the high-risk group was 0.59, while the low-risk group was not faced with life-threatening risk. The same disease prognosis risk score model was used to calculate the signature-based risk scores of the test group patients, validating the prediction power of the signature. Similarly, the test dataset was divided into 2 groups, a high-risk group (n = 12) and a low-risk group (n = 48). The 2 risk groups in the test dataset were displayed using survival analysis (Figure 4B). The median survival rate of the high-risk group in the test was significantly lower than in the low-risk group (log-rank test, P < .001). The results indicated that when the disease progressed for 14 days, the survival probability of the high-risk group was only 0.3, which was significantly lower than in the low-risk group (survival probability = 0.85).
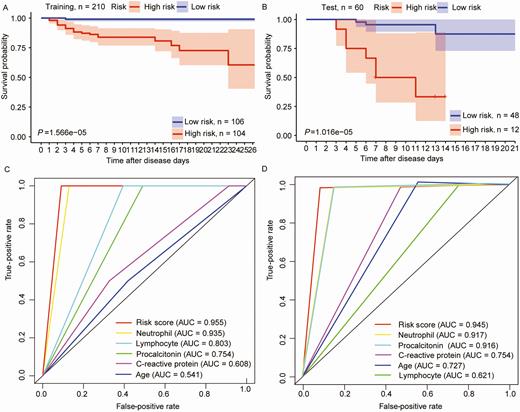
The signature of coronavirus disease 2019 predicts the disease prognosis in the training and test groups. A and B, Patients were classified into high- and low-risk groups through disease prognosis curves on the basis of the signature in the sample datasets. P values were determined through the log-rank test. C and D, Results of receiver operating characteristic analysis. Abbreviation: AUC, area under the curve.
Disease Prognosis Prediction Power of the Signature of COVID-19 in the Training and Test Groups
ROC analysis was performed to test the prediction power of the signature of COVID-19, which considered the larger area under the curve (AUC) as a better model for predicting the disease prognosis in COVID-19 patients. In the training group, the predictive ability of the 5-indicator signature was high (AUC Signature = 0.955; Figure 4C), further demonstrating that the signature in this study was a novel and highly accurate survival biomarker. A similar, highly accurate result was evident in the test group as well (AUC Signature = 0.945; Figure 4D).
DISCUSSION
COVID-19 is a highly infectious disease characterized by a long incubation period and rapid onset, with no specific treatment method currently available. It is crucial to find a signature that is associated with the survival and prognosis of COVID-19 patients. In this study, we examined the epidemiological, clinical, and laboratory features of moderately and severely or critically ill patients infected with COVID-19 and treated at the Wuhan Fourth Hospital. Based on the retrospective examination, both a univariate Cox regression analysis and a multivariate Cox regression analysis were performed to develop a novel signature of COVID-19 for the evaluation of disease prognosis. The results of the ROC curve indicated that the signature was a highly accurate disease prognosis biomarker. Therefore, the risk model based on the signature combined with the 5 indicators can be used to predict the disease prognosis and the survival rate, which is not only considerably useful in providing severely or critically ill patients with timely treatment but also in providing favorable conditions for clinicians to identify the status of patients in a timely manner.
Researchers have recently begun exploring clinical predictive models and stratifying the risk of the disease to uncover better indicators for prognosis prediction while helping physicians to identify patients in need of immediate clinical intervention. Ji et al have demonstrated that underlying comorbidity, older age, elevated layered double hydroxide (LDH), and lymphopenia were high-risk factors for the contraction of COVID-19 [12]. Furthermore, Du et al found that cardiac troponin I (≥ 0.05 ng/mL) is also an important predictor for the prognosis of COVID-19 [13]. Here, multivariable Cox regression analysis was used to assess the independence of the signature with an AUC of 0.955 in the training group and 0.945 in the test group, indicating its potential as a powerful survival biomarker. The signature combined with the 5 indicators (neutrophil count, lymphocyte count, procalcitonin, age, and C-reactive protein) was strongly associated with the physiological status of COVID-19 patients, such as inflammation and immune function. Therefore, the signature could be a more effective biomarker in a multidimensional model.
SARS-CoV and Middle East respiratory syndrome coronavirus (MERS-CoV) both caused a series of diseases that ranged from asymptomatic cases to severe acute respiratory distress syndrome and respiratory failure [14], as did SARS-CoV-2. The main pathogenesis of respiratory infection caused by SARS-CoV-2 is severe pneumonia and acute heart injury [5].
Complement-mediated systemic inflammation may be an underlying mechanism for the pathogenic response to the SARS infection. Previous researchers found that complement-deficient mice displayed reduced pulmonary neutrophils and an attenuated proinflammatory response [15]. Neutrophils infiltrate the tissues infected with coronavirus, promoting the expression of proinflammatory cytokines and chemokines, which might induce extensive lung damage in SARS, MERS-CoV, and SARS-CoV-2 infection [5, 16, 17]. Furthermore, studies have revealed that a high neutrophil count in patients with SARS when admitted to the hospital is more likely to present a poor prognosis [18, 19]. In a recent study, it was found that patients with refractory COVID-19 exhibited higher neutrophil levels on admission [20], corroborating our findings in this study. This result may be closely related to the inflammation caused by neutrophils, which leads to tissue damage.
Both C-reactive protein and procalcitonin can reflect the body’s inflammatory state. Procalcitonin shows a certain correlation with microbial invasion and is one of the most promising biomarkers for the diagnosis of sepsis [21]. C-reactive protein can be induced by inflammation, playing a crucial role in activating the complement system and neutrophils while promoting the secretion of interleukin-6, interleukin-1b, and tumor necrosis factor-α, which contribute to further inflammation [22]. Severely or critically ill patients with COVID-19 may develop sepsis, which is a significant contributor to the mortality rate. C-reactive protein and procalcitonin are reportedly helpful in the diagnosis of sepsis [23], while serum procalcitonin levels appear to correlate with the severity of the microbial attack. Elevated C-reactive protein and procalcitonin levels are more common in COVID-19 patients with heart injury, placing them at a higher risk of hospital death [24]. Moreover, high levels of C-reactive protein and procalcitonin exhibit a significant correlation with pulmonary inflammation [25] and are reportedly associated with patients who are severely ill with COVID-19 [26]. In a recent retrospective study that involved COVID-19, the C-reactive protein and procalcitonin levels were higher in deceased patients [3, 27], which corresponds with the results of our study. The indicators of the prognostic factors help to identify the severity of the COVID-19 disease while showing that secondary bacterial infections cannot be ignored.
A high lymphocyte count is considered a protective factor for COVID-19 since severe lymphopenia was predictive of poor outcomes [28]. T cells play a critical role in inhibiting the overactive innate immune response while maintaining immune homeostasis during SARS-CoV infection. T cells can reportedly recognize and clear infected cells in the lungs and prevent reinfection [29, 30]. In a previous study, it was indicated that the lymphocyte count is crucial during the early screening, diagnosis, and treatment of critically ill COVID-19 patients [31]. In our study, we found that serious lymphopenia was more common in severely ill patients, indicating that SARS-CoV-2 might affect lymphocytes, while cell-mediated immunity might be associated with disease severity. Research indicated that the depletion of T cells resulted in immune dysregulation, accompanied by increased inflammation, cytokine storms, and the aggravation of damaged tissue [31], which was consistent with the supposition of our study.
Older age has always been a risk factor for a series of diseases, and this was no exception in our research. Previous reports indicated that the median age of patients at the time of death was greater than for SARS-CoV-2 infection [28, 32]. As suggested in recent studies on a similar topic [3, 33], we showed that the median age of severely or critically ill patients was greater than that of moderately ill patients. Therefore, it seems that the elderly may have a high likelihood of developing chronic underlying comorbidities (eg, diabetes, hypertension, and heart disease) and are more susceptible to COVID-19 with a poor outcome [6], which could be attributed to the elderly often being physically fragile with weak immune systems. Therefore, people who belong to this age group would experience immune senescence [34], accompanied by decreased immune defense functionality, a weakened ability for the proliferation and differentiation of T cells and B cells in the lymph nodes, reduced effector functionality, as well as poor coordination between innate immunity and acquired immune response, contributing to increased morbidity and mortality [35]. These results indicate that disease prognosis in the elderly requires careful attention and timely treatment.
The risk score of the selected signature of COVID-19 was calculated to further verify its ability as a prognostic biomarker in patients infected with the disease. The training group was divided into low-risk and high-risk groups according to the median risk score. The results showed that the high-risk group displayed a significantly lower survival rate than the low-risk group. Therefore, the risk model based on the signature combined with the 5 indicators could be used to predict the disease prognosis and the survival rate, fully utilizing medical resources to provide critically ill patients with better treatment and reducing the mortality rate of COVID-19.
This study had several limitations. First, since this was a retrospective, single-center sample study, potential biomarkers such as underlying diseases, which could predict prognosis of COVID-19, were not included in the model. A multicenter large sample study would be preferable for assessing the prognostic markers of COVID-19. Second, although a retrospective study of moderately and severely or critically ill patients was performed to establish the signature combined with the clinical indicators, the laboratory data regarding cardiac troponin I, oxygen partial pressure, and the characteristics regarding body mass index were not available. Therefore, these elements were not included in the risk factor analysis due to the severity of the epidemic at that specific time and the shortage of medical resources. Third, notwithstanding these limitations, the consistent correlation of the signature with the overall survival rate in this study indicates that it is a dominant independent signature of COVID-19.
CONCLUSIONS
The signature of COVID-19 is an effective prognostic biomarker that can be used during the risk assessment of patients infected with the disease. It allows for close monitoring to provide timely treatment for severely or critically ill patients.
Supplementary Data
Supplementary materials are available at Clinical Infectious Diseases online. Consisting of data provided by the authors to benefit the reader, the posted materials are not copyedited and are the sole responsibility of the authors, so questions or comments should be addressed to the corresponding author.
Notes
Author contributions. The authors contributed in the following ways: H. Y., X. L., W. C.: data collection, data analysis. J. H., F. C.: study design, study supervision. S. S., B. Z.: data collection, final approval of the manuscript. S. W., Z. D.: drafting, technical support, and critical revision of the manuscript. All authors read and approved the final manuscript.
Acknowledgments. The authors thank the medical staffs and patients involved in the study.
Financial support. This work was supported by the Applied Basic Research Project of the Wuhan Science and Technology Bureau (grant number 2019020701011472), Health Commission of Hubei Province Scientific Research Project (grant number WJ2019H391), Health Commission of Wuhan Scientific Research Project (grant number WX19Q44), and the Scientific Research Subject of the Health and Family Planning Commission of Wuhan Municipality (grant number WX16B14).
References
Author notes
S. W., Z. D., F. C., and J. H. contributed equally to this work.

