


Abstract
There are no reliable signs or symptoms that differentiate Mycoplasma pneumoniae (Mp) infection in community-acquired pneumonia (CAP) from other etiologies. Additionally, current diagnostic tests do not reliably distinguish between Mp infection and carriage. We previously determined that the measurement of Mp-specific immunoglobulin M antibody-secreting cells (ASCs) by enzyme-linked immunospot assay allowed for differentiation between infection and carriage. Using this new diagnostic test, we aimed to identify clinical and laboratory features associated with Mp infection.
This is a prospective cohort study of children, 3–18 years of age, with CAP from 2016 to 2017. Clinical features and biomarkers were compared between Mp-positive and -negative groups by Mann-Whitney U test or Fisher exact test, as appropriate. Area under the receiver operating characteristic curve (AUC) differences and optimal thresholds were determined by using the DeLong test and Youden J statistic, respectively.
Of 63 CAP patients, 29 were Mp-positive (46%). Mp positivity was statistically associated with older age (median, 8.6 vs 4.7 years), no underlying disease, family with respiratory symptoms, prior antibiotic treatment, prolonged prodromal respiratory symptoms and fever, and extrapulmonary (skin) manifestations. Lower levels of C-reactive protein, white blood cell count, absolute neutrophil count, and procalcitonin (PCT), specifically PCT <0.25 μg/L, were statistically associated with Mp infection. A combination of age >5 years (AUC = 0.77), prodromal fever and respiratory symptoms >6 days (AUC = 0.79), and PCT <0.25 μg/L (AUC = 0.81) improved diagnostic performance (AUC = 0.90) (P = .05).
A combination of clinical features and biomarkers may aid physicians in identifying patients at high risk for Mp CAP.
Mycoplasma pneumoniae (Mp) is a common bacterial cause of community-acquired pneumonia (CAP) in children [1, 2]. There are substantial challenges in differentiating infection from carriage for Mp [3, 4]. Current diagnostic tests, including polymerase chain reaction (PCR) of upper respiratory tract (URT) specimens or serology, do not reliably differentiate between Mp infection and carriage [4]. Therefore it is not surprising that previous studies found no signs or symptoms to differentiate Mp infection in CAP from other etiology [5, 6], potentially because Mp detection was misclassified as infection when in fact it was carriage. Mp carriage is estimated to occur in up to 56% of healthy children [4, 5]. Mp infection is generally mild and self-limiting, and patients with Mp CAP are mostly managed in primary care [7]. The lack of a cell wall makes Mp naturally resistant to first-line empirical β-lactam antibiotics for CAP [5]. Empirical macrolide treatment is extensively used to cover potential Mp infection, which has led to the emergence of macrolide-resistant Mp and a parallel rise in macrolide resistance in other respiratory pathogens [8]. Therefore, with the challenges in diagnostic testing for Mp and its limited use in the primary care setting, it is essential to determine clinical features and biomarkers to aid in the diagnosis of Mp infection in children with CAP.
We recently demonstrated in a prospective cohort study of CAP in children that the measurement of specific peripheral blood immunoglobulin M (IgM) antibody-secreting cells (ASCs) by enzyme-linked immunospot (ELISpot) assay improves diagnosis of Mp infection in CAP [9]. This test differentiated between Mp infection and carriage. Using this dataset, we here aimed to identify clinical features and biomarkers associated with Mp CAP, in which infection may be more accurately identified with the measurement of Mp-specific IgM ASCs.
METHODS
Patients
Patients were enrolled between 1 May 2016 and 30 April 2017, at University Children’s Hospital Zurich [9]. CAP was clinically defined as the presence of fever >38.5°C and tachypnea according to the British Thoracic Society (BTS) guidelines [2]. Eligible participants were inpatients or outpatients aged 3–18 years. CAP patients <3 years of age were excluded to reduce the probability of viral infection, as it is highest in this age group [10–13]. Patients with hospital-acquired pneumonia, cystic fibrosis, or other chronic lung disorders (excluding asthma), or known primary or secondary immunodeficiencies, were excluded. The local ethics committee approved the protocol for this study (number 2016-00148). Written informed consent was obtained from all parents and children ≥14 years of age.
Specimen Collection and Diagnostic Testing
All enrolled patients were investigated for Mp in pharyngeal swab samples by specific real-time PCR [9, 14]. If additional consent was given, blood samples were collected for separation of peripheral blood mononuclear cells (PBMCs) and serum [9]. Serum was stored at −80°C. As detailed elsewhere [9], only CAP patients were included in this study if fresh (isolated ≤4 hours) PBMCs were available to avoid poor ELISpot assay performance, and tested for the presence of Mp IgM ASCs. A CAP patient with a positive Mp IgM ASC ELISpot assay result was considered to have CAP caused by Mp (Mp positive). If Mp IgM ASCs were not detected, the patient was considered to have CAP caused by another etiology (Mp negative). We additionally investigated the frequency of Mp by PCR from pharyngeal swabs among household contacts available for sampling at presentation of index patients.
After study closure, pharyngeal swab samples kept at −80°C were additionally tested for Streptococcus pneumoniae (Sp) by real-time PCR [15], knowing that detection of Sp in the URT is likely colonization and not infection [16]. In fact, coinfection with Sp and Mp is uncommon, whereas co-colonization may be more common [4, 12]. Another 23 viral and bacterial respiratory pathogens were tested using the ePlex respiratory pathogen panel (GenMark Diagnostics, Carlsbad, California), as previously described [17]. In addition, Mp serology was performed (Virion\Serion, Würzburg, Germany). The study test results were not available to treating clinicians.
Clinical Data
Demographic, epidemiological, and clinical data were systematically collected using a standardized questionnaire. Full recovery was assessed until 6 months after enrollment. Chest radiographs were ordered for clinical reasons and therefore were not available in 3 (5%) patients. Chest radiographs were assessed by a radiologist during routine clinical care. These radiological findings and the corresponding images were retrospectively reviewed by 2 of the authors, who were blinded to clinical information, using criteria for radiographic pneumonia [18, 19].
Laboratory Data
Blood cell count and C-reactive protein (CRP) analysis was performed as part of routine clinical care. Procalcitonin (PCT) testing was performed retrospectively in a batched analysis and results were not available to treating physicians. PCT levels were measured using a sensitive assay with a detection limit of 0.007 ng/mL (B·R·A·H·M·S PCT sensitive KRYPTOR, Thermo-Scientific, Berlin, Germany) [20].
Statistical Analysis
The nonparametric Mann-Whitney U test was used to compare continuous variables and the Fisher exact test to compare proportions between Mp-positive and Mp-negative groups. We calculated the area under the receiver operating characteristic (ROC) curve (AUC) of clinical features and biomarkers in differentiating between groups determined by Mp IgM ASC ELISpot assay (reference standard). We considered AUC ≥ 0.75 as adequate discrimination [21]. AUC differences were calculated using the DeLong test. Missing values were removed (ignored by roc.formula [22]). The best biomarker threshold was defined as the optimal cutoff that maximized the distance to the identity (diagonal) line in the ROC curve according to Youden J statistic. All reported P values are 2-tailed with statistical significance defined as P value <.05. Data were analyzed using the R software environment, version 3.6.0 [22].
RESULTS
Study Population
During the 12-month study period, 152 CAP patients were enrolled and Mp DNA was detected by PCR in 44 (29%) participants. Of the enrolled population, 63 (41%) CAP patients met the criteria of having fresh PBMCs available to undergo diagnostic testing with the Mp IgM ASC ELISpot assay and were included in this study. Of these, 29 (46%) were Mp-positive, determined by detection of Mp IgM ASCs. As detailed elsewhere [9], all 29 Mp IgM ASC-positive patients were also Mp PCR positive and IgM positive. However, Mp PCR was also positive in 3 (5%) patients who were Mp IgM ASC and IgM negative, and Mp IgM was found in another 3 (5%) patients who were Mp IgM ASC and PCR negative. Chest radiographs were performed in 60 of 63 (95%) included CAP patients, whereof 59 (98%) met the criteria for radiographic pneumonia.
Clinical Characteristics
The median age of Mp-positive patients (8.6 [interquartile range {IQR}, 6.3–11.0] years) was higher compared to Mp-negative patients with CAP (4.7 [IQR, 3.9–6.2] years) (P < .01; Table 1). Mp-positive CAP was more likely than Mp-negative CAP to present during summer (odds ratio [OR], 3.3 [95% confidence interval {CI}, .8–16.8]). Underlying disease was less common among Mp-positive than Mp-negative patients (3% vs 26%; P = .02). Mp-positive patients were significantly more likely than Mp-negative patients to have received prior antibiotic treatment (OR, 4.6 [95% CI, 1.3–19.6]), whereas amoxicillin with or without clavulanic acid was the most frequent agent in both groups (Mp-positive, n = 9/13 [69%] vs Mp-negative, n = 4/5 [80%]). A positive family history for respiratory tract infection (RTI) was reported in 17 (59%) Mp-positive compared to 10 (29%) Mp-negative patients (OR, 3.3 [95% CI, 1.1–11.0]; P = .02). Household contacts of Mp-positive index patients were significantly more likely to have Mp detected in the URT than those of Mp-negative index patients (OR, 9.7 [95% CI, 2.0–93.2]; P < .01). Only 2 family members (5%, both mothers) of Mp-negative index patients were PCR positive, of which 1 had RTI symptoms. Among household contacts of Mp-positive index patients, Mp was detected in the URT of 9 siblings (64%), 7 mothers (35%), and 1 father (8%). Most of them reported having RTI symptoms (59%), but 6 siblings and 1 mother were asymptomatic carriers.
Demographic, Epidemiological, and Clinical Characteristics of Mycoplasma pneumoniae–Positive Community-acquired Pneumonia (CAP) Versus M. pneumoniae–Negative CAP in Children
| Characteristics | Mp-Positive CAPa (n = 29) | Mp-Negative CAPa (n = 34) | OR (95% CI) | P Value |
|---|---|---|---|---|
| Demographic characteristics | ||||
| Age, yb, median (IQR) | 8.6 (6.3–11.0) | 4.7 (3.9–6.2) | … | < .01 |
| Sex, male | 16 (55) | 23 (68) | 0.6 (.2–1.9) | .44 |
| Season at enrollment | ||||
| Spring (March–May) | 5 (17) | 6 (18) | 1.0 (.2–4.4) | 1.00 |
| Summer (June–August) | 9 (31) | 4 (12) | 3.3 (.8–16.8) | .07 |
| Autumn (September–November) | 9 (31) | 8 (23) | 1.5 (.4–5.2) | .58 |
| Winter (December–February) | 6 (21) | 16 (47) | 0.3 (.1–1.0) | .04 |
| Daycare or preschool attendance | 29 (100) | 34 (100) | NA | 1.00 |
| Immunizationsc | 21/23 (91) | 31/32 (97) | 0.3 (.0–7.0) | .57 |
| Underlying diseased | 1 (3) | 9 (26) | 0.1 (.0–.8) | .02 |
| Asthma or history of wheezing | 1 | 1 | … | |
| Cardiovascular | 0 | 0 | … | |
| Gastrointestinal | 0 | 2 | … | |
| Neurological | 0 | 2 | … | |
| Other | 0 | 4 | … | |
| Family with RTI | 17 (59) | 10 (29) | 3.3 (1.1–11.0) | .02 |
| Mothers | 14 | 4 | … | |
| Fathers | 6 | 1 | … | |
| Siblings | 17 | 7 | … | |
| Family members with Mp detection in URT | 17/47 (36) | 2/37 (5) | 9.7 (2.0–93.2) | < .01 |
| Mothers | 7/20 (35) | 2/26 (8) | 6.2 (1.0–69.7) | .03 |
| Fathers | 1/13 (8) | 0/10 (0) | NA | 1.00 |
| Siblings | 9/14 (64) | 0/1 (0) | NA | .40 |
| Symptomatic (RTI) | 10/17 (59) | 1/2 (50) | 1.4 (.0–123.1) | 1.00 |
| Asymptomatic (carrier) | 7/17 (41)e | 1/2 (50)e | 0.7 (.0–62.7) | 1.00 |
| Prior antibiotic treatment | 13 (45) | 5 (15) | 4.6 (1.3–19.6) | .01 |
| Clinical presentation | ||||
| Prodrome | ||||
| RTI symptoms, d, median (IQR) | 9.0 (6.0–10.0) | 4.0 (3.0–7.0) | … | < .01 |
| Fever, d, median (IQR) | 8.0 (6.0–10.0) | 4.0 (3.3–6.0) | … | < .01 |
| Fever >2 df | 26 (90) | 28 (82) | 1.8 (.3–12.5) | .49 |
| Fever, °C, at presentation, median (IQR) | 39.1 (39.0–39.7) | 39.2 (39.0–39.5) | … | .89 |
| RTI symptoms and signs at presentationg | ||||
| Runny nose | 7 (24) | 14 (41) | 0.5 (.1–1.5) | .19 |
| Sore throat | 4 (14) | 4 (12) | 1.2 (.2–7.1) | 1.00 |
| Cough | 27 (93) | 30 (88) | 1.8 (.2–21.2) | .68 |
| Chest pain | 3 (10) | 7 (21) | 0.5 (.1–2.2) | .32 |
| Wheezing | 0 (0) | 1 (3) | NA | 1.00 |
| Abnormal auscultatory findings | 19 (66) | 24 (71) | 0.8 (.2–2.6) | .79 |
| Oxygen saturation < 93% | 5 (17) | 8 (24) | 0.7 (.2–2.8) | .76 |
| Radiographic findings | ||||
| Pulmonary infiltrate in chest radiographh | 28/28 (100) | 31/32 (97) | NA | 1.00 |
| Consolidation | 18 (64) | 25 (78) | 0.5 (.1–1.8) | .26 |
| Single lobar infiltrate | 13 | 16 | … | |
| Multilobar infiltrates | 5 | 9 | … | |
| Multilobar infiltrates (unilateral) | 1 | 3 | … | |
| Multilobar infiltrates (bilateral) | 4 | 6 | … | |
| Interstitial | 10 (36) | 6 (19) | 2.4 (.6–9.5) | .16 |
| Reticular | 10 | 6 | … | |
| Nodular | 0 | 0 | … | |
| Pleural effusion | 4 (14) | 7 (22) | 0.6 (.1–2.7) | .52 |
| Severity of illness | ||||
| Hospitalization | 10 (34) | 19 (56) | 0.4 (.1–1.3) | .13 |
| LOS, d, median (IQR) | 4.5 (3.3–7.0) | 2.5 (2.0–5.8) | … | .31 |
| ICU admission | 0 (0) | 1 (3) | NA | 1.00 |
| Extrapulmonary manifestation | 9 (31)i | 0 (0) | NA | < .01 |
| Dermatological | 8 | … | … | |
| Neurological | 1 | … | … | |
| Treatment | ||||
| Antibiotics after enrollment | 27 (93)j | 31 (91)j | 1.3 (.1–16.7) | 1.00 |
| Amoxicillin ± clavulanic acid | 13 (45) | 29 (85) | 0.1 (.0–.5) | < .01 |
| Clarithromycin | 10 (34) | 1 (3) | 16.7 (2.1–772.7) | < .01 |
| Doxycycline | 10 (34) | 1 (3) | 16.7 (2.1–772.7) | < .01 |
| Other | 1 (3) | 2 (6) | 0.6 (.0–11.6) | 1.00 |
| Outcome | ||||
| Full recovery | 26 (90)k | 34 (100) | NA | .09 |
| Respiratory sequelae | 2 | … | … | |
| Dermatological sequelae | 1 | … | … |
Data are presented as no. or no. (%) unless otherwise indicated. Differences between groups were determined by the Mann-Whitney U test (medians) and Fisher exact test (proportions). P values <.05 are indicated in bold.
Abbreviations: CAP, community-acquired pneumonia; CI, confidence interval; ICU, intensive care unit; IQR, interquartile range; LOS, length of hospital stay; Mp, Mycoplasma pneumoniae; NA, not available; OR, odds ratio; RTI, respiratory tract infection; URT, upper respiratory tract.
aDefined according to the Mp-specific immunoglobulin M (IgM) antibody-secreting cell (ASC) enzyme-linked immunospot assay results [9].
bOnly patients between 3 and 18 years of age were enrolled (inclusion criteria) [9].
cPer the national immunization schedule in Switzerland.
dChronic lung disorders (excluding asthma) were part of the exclusion criteria [9].
eAsymptomatic carriers: Mp-positive CAP family members: 6 siblings, 1 mother; Mp-negative CAP family members: 1 mother.
fAccording to the prediction rule for risk of Mp infection in children with CAP by Fischer et al [23].
gInclusion criteria were clinical diagnosis of CAP with fever >38.5°C and tachypnea according to the British Thoracic Society guidelines [2].
hRadiographic evidence of pneumonia was not part of inclusion criteria, but routinely performed in 60 of 63 (95%) included CAP patients; 98% (59/60) met the criteria for radiological pneumonia [18, 19].
iDermatological (n = 8) [32]: Mp-induced rash and mucositis (n = 3), urticaria (n = 2), and maculopapular skin eruptions (n = 3); neurological (n = 1): aseptic meningitis.
jAntibiotic treatment with ≥1 agent: Mp-positive CAP: amoxicillin with or without clavulanic acid + clarithromycin (n = 4), amoxicillin with or without clavulanic acid + doxycycline (n = 3); Mp-negative CAP: amoxicillin + clarithromycin (n = 1), amoxicillin with or without clavulanic acid + ceftazidime (n = 1). Mp-positive CAP not treated with an antibiotic in vitro active against Mp: 9 (31%); all of them fully recovered.
kAbnormal outcomes: bronchiolitis obliterans with decreased lung function (n = 1), exertional dyspnea without physical findings, ie, normal lung and cardiac function (n = 1), postinflammatory pigmentary alteration (n = 1).
The duration of RTI symptoms and fever prior to CAP diagnosis was longer in Mp-positive (median, 9.0 [IQR, 6.0–10.0] days) than Mp-negative patients (4.0 [IQR, 3.0–7.0] days; P < .01). No other symptoms and signs were statistically different between groups. Mp-positive patients were no different than Mp-negative patients to have consolidation, interstitial infiltrates, or pleural effusion. Extrapulmonary manifestations were only observed in Mp-positive children with CAP (31% vs 0%; P < .01) and included dermatological and neurological disorders (Table 1). After inclusion, 9 (31%) of Mp-positive patients were not treated with an antibiotic in vitro active against Mp.
Hospitalization rates and length of hospital stay were similar between the 2 groups. Detailed characteristics for hospitalized and ambulatory Mp-positive and Mp-negative patients are shown in Supplementary Tables 1 and 2. Among hospitalized patients, Mp-positive patients were more likely to have oxygen demand, extrapulmonary manifestations, and poor outcome than Mp-negative patients. Sequelae were only observed in 3 (10%) hospitalized Mp-positive patients (ie, bronchiolitis obliterans, exertional dyspnea, and postinflammatory pigmentary alteration). All Mp-negative patients fully recovered.
Laboratory Findings
Hematological assessment together with PCT and CRP analysis for Mp-positive and Mp-negative CAP patients is shown in Table 2. Mp-positive CAP patients had lower white blood cell (WBC) count, absolute neutrophil count (ANC), PCT, and CRP values than Mp-negative patients (Figure 1).
Laboratory Findings of Mycoplasma pneumoniae–Positive Community-acquired Pneumonia (CAP) Versus M. pneumoniae–Negative CAP in Children
| Laboratory Finding | Mp-Positive CAP (n = 29) | Mp-Negative CAP (n = 34) | OR (95% CI) | P Value |
|---|---|---|---|---|
| Blood cell count | ||||
| WBC count, ×109 cells/L, median (IQR) | 8.97 (6.91–11.80) | 12.30 (9.11–20.48) | … | .01 |
| Abnormala | 5/21 (24) | 13/26 (50) | 0.3 (.1–1.3) | .08 |
| Leukocytosis | 4 | 12 | … | |
| Leukopenia | 1 | 1 | … | |
| ANC, ×109 cells/L, median (IQR) | 6.63 (4.21–8.70) | 10.00 (6.17–17.29) | … | .02 |
| Abnormala | 7/21 (33) | 14/25 (56) | 0.4 (.1–1.5) | .15 |
| Neutrophilia | 7 | 14 | … | |
| Neutropenia | 0 | 0 | … | |
| Lymphocyte count, ×109 cells/L, median (IQR) | 1.45 (1.16–2.29) | 1.77 (1.19–2.58) | … | .52 |
| Abnormala | 8/21 (38) | 7/24 (29) | 1.5 (.4–6.2) | .55 |
| Lymphocytosis | 0 | 0 | … | |
| Lymphopenia | 8 | 7 | … | |
| Monocyte count, ×109 cells/L, median (IQR) | 0.71 (0.47–0.96) | 0.89 (0.63–1.11) | … | .21 |
| Abnormala | 2/21 (10) | 1/24 (4) | 2.4 (.1–148.8) | .59 |
| Monocytosis | 2 | 1 | … | |
| Absolute monocytopenia | 0 | 0 | … | |
| Eosinophil count, ×109 cells/L, median (IQR) | 0.13 (0.04–0.22) | 0.01 (0.00–0.13) | … | .05 |
| Abnormala | 3/20 (15) | 10/24 (42) | 0.3 (.0–1.3) | .09 |
| Eosinophilia | 1 | 2 | … | |
| Absolute eosinopenia | 2 | 8 | … | |
| Basophil count, ×109 cells/L, median (IQR) | 0.05 (0.02–0.07) | 0.04 (0.02–0.07) | … | .98 |
| Abnormala | 0/20 (0) | 0/24 (0) | NA | 1.00 |
| Anemiaa | 2/21 (10) | 8/26 (31) | 0.2 (.0–1.5) | .15 |
| Platelet count, ×109 cells/L, median (IQR) | 315 (289–378) | 310 (252–356) | … | .27 |
| Abnormala | 6/21 (29) | 4/25 (16) | 2.1 (.4–11.8) | .48 |
| Thrombocytopenia | 5 | 3 | … | |
| Thrombocytosis | 1 | 1 | … | |
| Chemistry | ||||
| PCT, μg/L, median (IQR) | 0.06 (0.04–0.14) | 0.28 (0.12–1.75) | … | < .01 |
| CRP, mg/L, median (IQR) | 16 (8–36) | 72 (24–170) | … | < .01 |
| CRP/PCT ratio, mg/μg, median (IQR) | 200 (84–452) | 104 (39–320) | … | .27 |
| CRP/PCT ratio >400 mg/μgb | 9 (31) | 7 (21) | 1.7 (.5–6.5) | .39 |
Data are presented as no. or no. (%) unless otherwise indicated. Differences between groups were determined by the Mann-Whitney U test (medians) and Fisher exact test (proportions). P values <.05 are indicated in bold.
Abbreviations: ANC, absolute neutrophil count; CAP, community-acquired pneumonia; CI, confidence interval; CRP, C-reactive protein; IQR, interquartile range; Mp, Mycoplasma pneumoniae; NA, not available; OR, odds ratio; PCT, procalcitonin; WBC, white blood cell.
aAge-specific reference values for hematology were defined as previously described [46].
bAccording to the admission CRP/PCT ratio for risk of Mp infection in hospitalized adults with CAP by Neeser et al [24].

Biomarker test results of Mycoplasma pneumoniae–positive community-acquired pneumonia (CAP) vs M. pneumoniae–negative CAP in children: procalcitonin (A), C-reactive protein (B), white blood cell count (C), absolute neutrophil count (D). The P value is indicated in the graphs (Mann-Whitney U test). Abbreviations: ANC, absolute neutrophil count; CAP, community-acquired pneumonia; CRP, C-reactive protein; Mp, Mycoplasma pneumoniae; PCT, procalcitonin; WBC, white blood cell.
Detection of Pathogens
Differences in clinical features and biomarkers may be attributed to another pathogen causing a subset of infections. Therefore, pharyngeal swab samples were tested in this study for other pathogens. Two or more pathogens were found in the URT of 20 (69%) Mp-positive and 13 (38%) Mp-negative patients (Table 3). Sp was equally detected in both cohorts in >60%. Exclusively found in Mp-negative patients was respiratory syncytial virus (RSV; n = 8 [24%]; P < .01), influenza virus (n = 2), parainfluenza virus (n = 2), and coronavirus (n = 1). No virus was statistically associated with Mp positivity. Rhinovirus, adenovirus, and bocavirus were equally detected in both cohorts. Thus, we also compared clinical features and biomarkers of Mp-positive patients against the following subgroups of Mp-negative patients (n = 34): first, positive for RSV (n = 8, as it is the only virus for which detection in the URT has a high predictive value for CAP etiology [16]); second, positive for other viruses than RSV (n = 7, being aware that URT detection of other pathogens than RSV may not be related to pneumonia [3]); and third, negative for viruses (n = 19, in which Sp was detected in 14 [74%] in the URT and additionally in 2 of 2 in pleural aspirate during routine clinical care). However, although numbers were again smaller for this subanalysis, Mp-positive CAP was also compared to subgroups of Mp-negative CAP statistically associated with older age, prolonged prodromal respiratory symptoms, and low levels of PCT (Supplementary Figure 1 and Supplementary Table 3).
Pathogen Detection in Upper Respiratory Tract of Mycoplasma pneumoniae–Positive Community-acquired Pneumonia (CAP) Versus M. pneumoniae–Negative CAP in Children
| Pathogen | Mp-Positive CAP (n = 29) | Mp-Negative CAP (n = 34) | OR (95% CI) | P Value |
|---|---|---|---|---|
| Pathogen | ||||
| Any pathogen | 29 (100) | 29 (85) | NA | .06 |
| ≥2 pathogens | 20 (69) | 13 (38) | 3.5 (1.1–11.7) | .02 |
| ≥3 pathogens | 7 (24) | 5 (15) | 1.8 (.4–8.4) | .52 |
| Bacteria | ||||
| Any bacteria | 29 (100) | 26 (76) | NA | < .01 |
| Mp | 29 (100) | 3 (9) | NA | < .01 |
| Sp | 18 (62) | 26 (76)a | 0.5 (.1–1.7) | .27 |
| Chlamydophila pneumoniae | 0 (0) | 1 (3) | NA | 1.00 |
| Legionella pneumophila | 0 (0) | 0 (0) | NA | 1.00 |
| Bordetella pertussis | 0 (0) | 0 (0) | NA | 1.00 |
| Viruses | ||||
| Any virus | 9 (32) | 15 (45) | 0.6 (.2–1.8) | .31 |
| RSV | 0 (0) | 8 (24)b | NA | < .01 |
| A | … | 2 | … | |
| B | … | 3 | … | |
| Influenza virus | 0 (0) | 2 (6) | NA | .50 |
| A | … | 2 | … | |
| A(H1) | … | 0 | … | |
| A(2009 H1N1) | … | 0 | … | |
| A(H3) | … | 1 | … | |
| B | … | 0 | … | |
| Parainfluenza virus | 0 (0) | 2 (6) | NA | .50 |
| 1 | … | 0 | … | |
| 2 | … | 2 | … | |
| 3 | … | 0 | … | |
| 4 | … | 0 | … | |
| Human rhinovirus/enterovirusc | 3 (11) | 4 (12) | 0.9 (.1–5.7) | 1.00 |
| Adenovirus | 5 (18) | 3 (9) | 2.1 (.4–15.3) | .45 |
| Human metapneumovirus | 0 (0) | 0 (0) | NA | 1.00 |
| Coronavirus | 0 (0) | 1 (3) | NA | 1.00 |
| 229E | … | 0 | … | |
| HKU1 | … | 0 | … | |
| NL63 | … | 0 | … | |
| OC43 | … | 1 | … | |
| MERS coronavirus | … | 0 | … | |
| Human bocavirus | 1 (4) | 1 (3) | 1.2 (.0–95.8) | 1.00 |
Data are presented as no. or no. (%). Differences between proportions were determined by the Fisher exact test. P values <.05 are indicated in bold. Pharyngeal samples were tested in all patients by real-time polymerase chain reaction (PCR) for Mp [14] and Sp [15], and for other bacterial and viral pathogens by the ePlex respiratory panel [17] in 28 of 29 Mp-positive CAP and 33 of 34 Mp-negative CAP patients with residual respiratory samples. Blood cultures were performed in 14 (48%) Mp-positive CAP and 20 (59%) Mp-negative CAP patients during routine clinical care and all were negative. Routine PCR testing for Mp [14] as part of clinical care was positive in 8 of 8 Mp-positive CAP and 0 of 11 Mp-negative CAP patients.
Abbreviations: CAP, community-acquired pneumonia; CI, confidence interval; MERS, Middle East respiratory syndrome; Mp, Mycoplasma pneumoniae; NA, not available; OR, odds ratio; RSV, respiratory syncytial virus; Sp, Streptococcus pneumoniae.
aTwo patients had Sp detected in both upper respiratory tract (URT) and pleural fluid samples (pleural puncture performed during routine clinical care). They had no other pathogens detected in the URT apart from Sp.
bRSV was additionally detected in nasopharyngeal samples of 3 patients by rapid antigen detection test (Sofia, Quidel, San Diego, California) during routine clinical care.
cNo differentiation possible between rhinovirus and enterovirus [17].
ROC Analysis and Performance Curves
ROC analysis was performed for clinical features and biomarkers that were associated with Mp-positive CAP. The ROC curves showed good discriminative ability (AUC ≥ 0.75) in differentiating groups for age (AUC = 0.77), duration of prodromal symptoms (AUC = 0.79), PCT (AUC = 0.81), and CRP (AUC = 0.76) (Figure 2A and 2B).
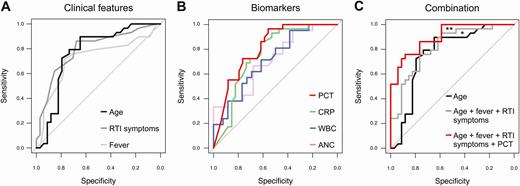
Receiver operating characteristic (ROC) curve of sensitivity vs specificity for clinical features (A), biomarkers (B), and a combination of both (C). Area under the ROC curve (AUC) differences (DeLong test): A and B, No significant AUC differences. C, *P = .37 (age vs combination of clinical features); **P = .05 (combination of clinical features vs combination of clinical features plus procalcitonin). Abbreviations: ANC, absolute neutrophil count; CRP, C-reactive protein; PCT, procalcitonin; RTI, respiratory tract infection; WBC, white blood cell.
The best clinical threshold to discriminate Mp-positive from Mp-negative patients was age 5 years and prodromal fever and RTI symptom duration of 6 days (Table 4). The optimal biomarker thresholds were 0.25 μg/L for PCT, 50 mg/L for CRP, 18 × 109/L for WBC count, and 8 × 10⁹/L for ANC. For assessment of Mp-positive CAP, the positive likelihood ratios were highest for age >5 years (2.2 [95% CI, 1.4–3.3]), duration of fever >6 days (3.1 [95% CI, 1.6–5.9]), and RTI symptoms >6 days (2.5 [95% CI, 1.4–4.3]), as well as for PCT <0.25 μg/L (2.2 [95% CI, 1.5–3.2]) and CRP <50 mg/L (2.3 [95% CI, 1.4–3.5]) (Table 4). Using a PCT cutoff of <0.25 μg/L, only 1 (3%) Mp-positive patient had a PCT concentration above this cutoff compared with 19 (56%) Mp-negative patients (P < .01). The Mp-positive CAP patient with the high PCT level (ie, 0.55 μg/L) developed bronchiolitis obliterans and dermatological manifestations.
Best Thresholds With Diagnostic Accuracy for Mycoplasma pneumoniae–Positive Community-acquired Pneumonia (CAP) Versus M. pneumoniae–Negative CAP in Children
| Parameter | Threshold | Sensitivity (95% CI) | Specificity (95% CI) | Positive LR (95% CI) | Negative LR (95% CI) | AUC (95% CI) |
|---|---|---|---|---|---|---|
| Clinical features | ||||||
| Age, y | >5 | 0.90 (.74–.96) | 0.59 (.42–.74) | 2.18 (1.43–3.31) | 0.18 (.06–.53) | 0.77 (.64–.89) |
| Fever, d | >6 | 0.72 (.54–.85) | 0.76 (.60–.88) | 3.08 (1.61–5.87) | 0.36 (.19–.67) | 0.72 (.59–.86) |
| RTI symptoms, d | >6 | 0.72 (.54–.85) | 0.71 (.54–.83) | 2.46 (1.40–4.34) | 0.39 (.21–.73) | 0.79 (.68–.91) |
| Biomarkers | ||||||
| PCT, μg/L | <0.25 | 0.97 (.83–.99) | 0.56 (.39–.71) | 2.19 (1.49–3.21) | 0.06 (.01–.43) | 0.81 (.70–.92) |
| CRP, mg/L | <50 | 0.86 (.69–.95) | 0.62 (.45–.76) | 2.25 (1.44–3.54) | 0.22 (.09–.58) | 0.76 (.63–.88) |
| WBC count, ×109 cells/L | <18.00 | 0.95 (.77–.99) | 0.38 (.22–.57) | 1.55 (1.13–2.13) | 0.12 (.02–.89) | 0.71 (.56–.86) |
| ANC, ×109 cells/L | <8.00 | 0.67 (.45–.83) | 0.60 (.41–.77) | 1.67 (.94–2.94) | 0.56 (.28–1.10) | 0.71 (.56–.86) |
| Combination | ||||||
| Age + fever + RTI symptoms | As defined above | 1.00 (.88–1.00) | 0.44 (.29–.61) | 1.79 (1.33–2.41) | NA | 0.82 (.71–.92) |
| Age + fever + RTI symptoms + PCT | As defined above | 1.00 (.88–1.00) | 0.32 (.19–.49) | 1.48 (1.17–1.87) | NA | 0.90 (.83–.97) |
The threshold is the optimal cutoff that maximizes the distance to the identity (diagonal) line in the receiver operating characteristic curve in Figure 2 according to the Youden J statistic using the “coords” function in R software environment (version 3.6.0) [22].
Abbreviations: ANC, absolute neutrophil count; AUC, area under the receiver operating characteristic curve; CI, confidence interval; CRP, C-reactive protein; LR, likelihood ratio; NA, not available; PCT, procalcitonin; RTI, respiratory tract infection; WBC, white blood cell.
The combination of clinical features and biomarkers was more effective in the diagnosis of Mp CAP compared with either clinical features or biomarkers alone (Figure 2C). Improved diagnostic performance was reached by combining clinical features (ie, age with duration of prodromal symptoms: AUC = 0.82 [95% CI, .7–.9]) together with PCT (AUC = 0.90 [95% CI, .8–1.0]) (P = .05; Table 4).
DISCUSSION
We evaluated clinical features and biomarkers to diagnose Mp infection within a well-defined cohort of ambulatory and hospitalized children with CAP, in which Mp infection was diagnosed with the Mp IgM ASC ELISpot assay that allows for the differentiation between Mp infection and carriage [9]. Diagnosing Mp as the cause of CAP at an early stage is important to avoid ineffective first-line empirical β-lactam antibiotics and to evaluate targeted treatment against Mp in severe cases [2].
Several scores, ratios, algorithms, and prediction rules have been reported to diagnose Mp infection on the basis of clinical features [5, 7, 23, 24]. However, previous studies found no reliable signs or symptoms to differentiate Mp infection in CAP from other etiology [5, 6], potentially because Mp infection was misclassified as infection when it was carriage. We recently demonstrated that the Mp IgM ASC ELISpot assay differentiates Mp infection from carriage [9]: While Mp DNA and/or IgM were also detected in 48% and 29% healthy control children (n = 21), all were tested negative by the Mp IgM ASC ELISpot assay [9]. Notably, the high Mp detection rate in CAP patients (46%) in this study may be related to the inclusion age of 3–18 years, in which Mp is most frequently detected [1, 2], and the coinciding Mp epidemic in Europe during the study period [25–28]. Prevalence estimates are important for translation of diagnostic study findings into clinical practice. When taking the Bayes theorem into account, the posttest probability of disease presence will be higher given a higher pretest probability or prevalence [29–31]. For proper implementation of a new diagnostic test into clinical practice, it is therefore necessary that the test will be assessed in the context of all the other diagnostic information that is available at the time point of testing.
We were able to corroborate previous study findings in that Mp-positive CAP manifests predominantly in school-aged children >5 years [1, 12, 23] and children present with prodromal fever and respiratory symptoms of >6 days [1], significantly longer compared with CAP caused by other etiology. Other symptoms and signs, as well as radiographic findings, did not differentiate Mp-positive from Mp-negative CAP [1, 5, 6]. Extrapulmonary manifestations, predominantly skin disorders, were statistically associated with Mp-positive CAP in this study. Its presence significantly increases the probability of underlying Mp infection [32]. This may be also true for the presence of RTI within families of Mp-positive CAP patients. Our observation of frequent RTI symptoms and Mp detection in members of those families supports previous data about Mp spread among persons in close contact and family transmission of Mp [33–36].
Mp infection is mild and self-limiting in most cases, and manifests predominantly in previously healthy children [5]. In our study, one-third of Mp-positive CAP patients were not treated with an antibiotic in vitro active against Mp, but all of these children fully recovered. The BTS guidelines advise that macrolide antibiotics may be added at any age in case of very severe disease or if there is no response to first-line empirical treatment [2]. Prior antibiotic treatment was associated with Mp CAP and included treatment with β-lactam antibiotics in most cases. This supports that in patients that do not respond to β-lactam antibiotics, Mp CAP should be considered [2, 7]. We did not find statistical differences in fever duration following CAP diagnosis, hospital length of stay, or recovery at follow-up between Mp-positive patients who did and did not receive antibiotics against Mp (data not shown). These findings support the need for future interventional studies assessing the effect of antibiotics for Mp CAP [1, 9, 37, 38].
Our study demonstrated that in Mp-positive CAP biomarker levels of PCT, CRP, WBC count, and ANC were statistically lower compared with Mp-negative CAP. Despite limited numbers, this was even true for PCT and CRP of Mp-positive CAP in comparison to viral CAP (RSV) as a subgroup of Mp-negative CAP. Similar trends have been observed in previous CAP studies for CRP, WBC count, and ANC [23, 39–43], and recently for PCT with median levels from 0.05 to 0.19 μg/L in CAP considered to be caused by Mp [39–41, 44]. A study with conflicting results suggesting higher PCT levels associated with Mp may be hampered by diagnostics [45]. A PCT cutoff of <0.25 μg/L reached the best discriminatory power in differentiating Mp-positive from Mp-negative children with CAP, which is supported by previous studies [39–41, 44]. Only 1 Mp-positive patient had a PCT level of 0.55 μg/L and was above this cutoff.
Our study has several limitations. First, though sampling was performed in a relevant population of clinical CAP [9], the study population is small and represents a convenience sample from an observational study, and we cannot rule out that unintended selection occurred. However, even though the sample size is small for prediction, the scope of this study was to describe risk factors for Mp infection. Second, mild cases may not have been referred to our tertiary center. Third, the study enrolled children from 3 to 18 years of age to reduce the probability of viral infection [9]. However, younger children with Mp infection may have, more likely, other RTIs than CAP [43].
In conclusion, improved diagnostics helped to identify clinical features and biomarkers that may predict Mp CAP in children, such as age >5 years, no underlying disease, family with RTI, prior antibiotic treatment, prodromal respiratory symptoms and fever >6 days, as well as extrapulmonary (skin) manifestations. Biomarkers showed some differences between Mp-positive and Mp-negative patients in that Mp positivity was associated with low levels of CRP, WBC count, ANC, and PCT, particularly a PCT cutoff of <0.25 μg/L. However, the study size is small and even the best combinations of clinical features and biomarkers may not be reliable enough to be used as a diagnostic itself. Our data support that a combination of clinical features and biomarkers may help physicians in identifying patients at high risk for Mp CAP, which warrants further investigations in a larger cohort of children with Mp infection.
Supplementary Data
Supplementary materials are available at Clinical Infectious Diseases online. Consisting of data provided by the authors to benefit the reader, the posted materials are not copyedited and are the sole responsibility of the authors, so questions or comments should be addressed to the corresponding author.
Notes
Author contributions. P. M. M. S. had full access to all the data in the study and takes responsibility for the integrity of the data and the accuracy of the data analysis. Study design: P. M. M. S. and approved by all authors. Acquisition of data: P. M. M. S., S. K., M. S., P. P., C. R., C. K., T. H., C. G. Analysis and interpretation of data: P. M. M. S., L. A., L. M. B., A. M. C. v. R., C. B. Drafting of the manuscript: P. M. M. S. Critical revision of the manuscript for important intellectual content: all authors. Statistical analysis: P. M. M. S., L. A., L. M. B. Obtained funding: P. M. M. S. Administrative, technical, or material support: P. M. M. S., M. S., C. K., T. H., C. G., C. B.
Acknowledgments. The authors thank the children and their parents who contributed to this study; the emergency department staff and the outpatient clinic staff for recruiting participants; and the microbiology laboratory staff for processing samples, particularly Melanie Sigg and Käthi Spörri, for conducting the Streptococcus pneumoniae real-time polymerase chain reaction. We are grateful to Martin Hersberger (Division of Clinical Chemistry and Biochemistry, University Children’s Hospital Zurich) for conducting the C-reactive protein analyses, and Monika Seiler (Institute for Clinical Chemistry, University Hospital Zurich, Switzerland) for performing the procalcitonin analyses.
Disclaimer. The funders had no role in study design, data collection and analysis, decision to publish, or preparation of the manuscript.
Financial support. P. M. M. S. was supported by grants from the Promedica Foundation and the Starr International Foundation, and a Fellowship Award of the European Society for Paediatric Infectious Diseases.
Potential conflicts of interest. The authors: No reported conflicts of interest. All authors have submitted the ICMJE Form for Disclosure of Potential Conflicts of Interest.
References

