


Abstract
Little is known about the impact of psychosocial factors and substance use on viral suppression among human immunodeficiency virus (HIV)–infected key populations in resource-limited settings. Accordingly, we examined the association and interactions between depression, alcohol use, and recreational drug use on viral suppression among men who have sex with men (MSM) and people who inject drugs (PWID) in India.
MSM and PWID were recruited across India using respondent-driven sampling (RDS). Correlates of viral suppression were determined using Poisson regression models incorporating RDS-II weights. Two-way multiplicative interactions were assessed with separate models of all combinations of the 3 variables of interest using interaction terms; 3-way interactions were evaluated by stratifying 2-way interactions by the third variable.
Among 1454 treatment-eligible HIV-infected MSM and 1939 PWID, older age (adjusted prevalence ratio [aPR], 1.14 for MSM; 1.41 for PWID) and higher HIV treatment literacy (aPR, 1.58 for MSM; 3.04 for PWID) were positively associated with viral suppression. Among MSM, there was evidence of a synergistic negative association between severe depression and recreational drug use (aPR, 0.37 [95% confidence interval {CI}, .16–.84]), alcohol dependence and recreational drug use (aPR, 0.45 [95% CI, .20–.99]), and severe depression, alcohol dependence, and recreational drug use (aPR, 0.23 [95% CI, .09–.57]). Among PWID, daily injection (aPR, 0.51 [95% CI, .31–.82]) was the primary barrier to suppression.
Incorporating psychosocial and harm-reduction services into differentiated care models targeting MSM and PWID in low-resource settings is critical to achieving the 90-90-90 HIV/AIDS targets.
Men who have sex with men (MSM) and people who inject drugs (PWID) bear a disproportionate human immunodeficiency virus (HIV) burden and lag behind other populations with respect to the HIV care continuum [1, 2]. The Joint United Nations Programme on HIV/AIDS (UNAIDS) established an ambitious target of “90-90-90” by 2020: 90% of HIV-infected persons should be aware of their status, 90% of those diagnosed should be on sustained antiretroviral therapy (ART), and 90% of those on ART should be virologically suppressed. Achieving these targets requires an increased focus on vulnerable populations such as MSM and PWID [3, 4]. Viral suppression is not only critical for individual health but, with the recognition that “undetectable = untransmissible,” it is critical to HIV epidemic control.
India, with an estimated 3 million opioid users, is among the largest opioid consumers globally [5]. India is also home to approximately 2.4 million high-risk MSM, but prevalence of same-sex behavior has been reported to be as high as 9% among adult males [6–9]. Despite an overall decline in HIV prevalence nationally, HIV burden remains high in these 2 groups, who face additional challenges beyond those faced by HIV-infected persons, including criminalization of both behaviors until recently and high levels of provider stigma, which complicate achieving viral suppression [10–12]. Furthermore, previous studies have demonstrated high levels of depression, alcohol use, and active substance use in both populations, each of which can independently impact suppression [3, 6, 13–15]. However, the interaction between these factors and viral suppression remains unclear.
Accordingly, we examined factors associated with viral suppression in a community-based sample of HIV-positive MSM and PWID recruited from 22 cities across India with a focus on depression, alcohol use, and recreational drug use and their interactions.
METHODS
Study Design
Data in these analyses were collected as part of the evaluation assessment of a cluster-randomized trial among MSM and PWID in India (ClinicalTrials.gov identifier NCT01686750) [6]. In brief, the assessment was conducted in 22 sites (10 MSM and 12 PWID) between August 2016 and July 2017. The study population was recruited using respondent-driven sampling (RDS), a chain-referral strategy for recruiting hard-to-reach participants [16, 17]. RDS was initiated in each site using 2 “seeds” (individuals considered well-connected in the community) and allowed to run until a target population of approximately 1000 participants was recruited.
Study Population
Participants satisfied the following eligibility criteria: (1) aged ≥18 years; (2) provided informed consent; and (3) possessed a valid RDS referral coupon. For MSM, additional criteria included self-identifying as male and reporting oral/anal sex with another man in the prior year. For PWID, an additional criterion was self-reported injection drug use in the prior 2 years. Of 10 024 MSM recruited, 1767 were HIV-infected, of whom 1454 were treatment eligible and had viral load measurements (Figure 1). Similarly, of 11 745 PWID recruited, 2524 were HIV positive, of whom 1939 were treatment eligible and had viral load measurements. Treatment eligibility was defined as either self-report of having ever initiated ART or CD4 count ≤350 cells/μL (the guidelines for ART initiation at the time of the survey) [18].
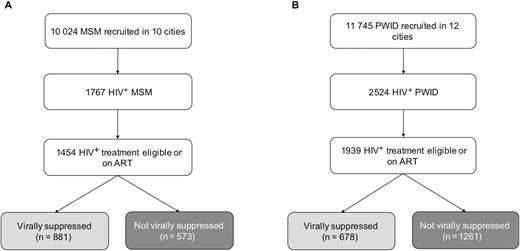
Study flowchart of men who have sex with men (A) and people who inject drugs (B). Abbreviations: ART, antiretroviral therapy; HIV, human immunodeficiency virus; MSM, men who have sex with men; PWID, people who inject drugs.
Study Procedures
Detailed study procedures have been published elsewhere [6]. Following consent, participants completed an interviewer-administered electronic survey and provided a blood sample. Rapid HIV testing was performed on-site with appropriate counseling as per Indian guidelines [18, 19]. Each participant who completed the study was given 2 coupons to distribute randomly to 2 other members of his/her peer network. Participants were reimbursed with 250 Indian rupees (INR) (approximately 4 US dollars [USD]) for completing the study visit. In addition, participants could earn an incentive of INR 50 (~0.80 USD) per referral who enrolled. All samples were shipped to the Y.R. Gaitonde Centre for AIDS Research and Education (YRGCARE) in Chennai for additional testing.
The electronic survey captured information on sociodemographics, HIV-related risk factors, depression, and substance use. Sexual identities among MSM in India are diverse and include “kothis,” who display feminine demeanor and prefer receptive anal intercourse; “panthis,” who display a masculine demeanor and prefer penetrative anal intercourse; and “double-deckers,” who engage in both receptive and penetrative intercourse. Depression was assessed using the Patient Health Questionnaire-9 (PHQ-9), which has been previously validated in India [20, 21]. Depression was parameterized as none/mild, moderate, or severe (PHQ score ≤9, 10–14, or ≥15, respectively). Functional impairment from depression was defined as anyone who said depressive symptoms made it very difficult/extremely difficult for them to work, take care of things at home, or get along with others. Alcohol use was assessed using the Alcohol Use Disorders Identification Test (AUDIT); the score was parameterized into none/mild alcohol use (score ≤7), harmful/hazardous alcohol use (score 8–14), and alcohol dependence (score ≥15) [22]. Recreational drug use (noninjection and injection) was self-reported using standard measures previously used in India. Treatment literacy was defined based on several questions about knowledge of HIV treatment. A composite stigma score was generated that summed responses to 22 questions in 4 domains—enacted, vicarious, felt/normative, and internalized stigma—all of which were scored as never, sometimes, or always (total range, 0–66). Healthcare stigma is a subset of the stigma questionnaire related to hospital mistreatment, denial of medical care, and/or being refused care, with a range of 0–18, with a score ≥12 being classified as experiencing healthcare-related stigma.
CD4+ count was measured using the FlowCARE assay (Beckman Coulter, Brea, California) and HIV RNA quantified using the RealTime HIV-1 assay (Abbott Laboratories, Abbott Park, Illinois), with a lower limit of detection of 150 copies/mL.
Statistical Analyses
Analyses were restricted to treatment-eligible HIV-infected persons; data from RDS “seeds” were excluded in analyses. The prevalence of viral suppression (defined as viral load of HIV RNA <150 copies/mL) was estimated using the RDS-II (Volz-Heckathorn estimator), which weights estimates for network size (ie, number of MSM/PWID in the city whom the participant saw in the prior 30 days). Population summary statistics were estimated with a composite weight, which accounts for the relative population size of adult men 15–59 years of age in each city (assuming a similar proportion of MSM across cities) or number of PWID in each city obtained from state-level data, in addition to the RDS-II weight [17, 23].
Associations of alcohol dependence, depression, and drug use with viral suppression were explored using Poisson regression models with robust variance estimation and scaled RDS weights; outcomes are depicted as prevalence ratios (PRs) among treatment-eligible HIV-infected individuals. Factors hypothesized to be confounders associated at P < .10 in the univariable models were considered for inclusion in multivariable models and retained in final models if associated with viral suppression at P < .05. Certain demographic factors (eg, age, sexual identity) and study arm were included in multivariable models regardless of statistical significance. Collinearity was assessed, and variance inflation factors were checked.
For both groups, 2-way multiplicative interactions between alcohol dependence, depression, and recreational drug use were assessed by analyzing all 2-way combinations of the 3 variables and their interaction term in a Poisson regression model (3 separate models: severe depression and alcohol dependence; alcohol dependence and recreational drug use; and severe depression and recreational drug use). Additionally, we evaluated potential 3-way interactions by stratifying the 2-way interactions by the third variable of interest.
Unweighted estimates are provided in Supplementary Tables 1–5. All statistical analyses were performed using Stata version 15.1 software (StataCorp, College Station, Texas).
Ethical Considerations
This study was approved by the institutional review boards of Johns Hopkins Medicine, the Johns Hopkins School of Public Health, and YRGCARE.
RESULTS
Demographics
Among 1454-treatment eligible MSM (Table 1), the median age was 37 years (interquartile range [IQR], 30–42 years). More than two-thirds (69.3%) were currently married to a woman or living with a partner; 15.8% of the spouses of these MSM have never been tested for HIV. About a quarter self-identified as panthi and more than one-third (36.3%) self-identified as kothi. The majority (66%) of participants reported an average monthly income >115 USD. Almost 10% self-reported having a sexually transmitted infection (STI) in the prior 6 months; the median composite stigma score was 15 (IQR, 5–24), and 4.6% reported having experienced healthcare stigma.
Weighted Characteristics by Viral Suppression Status Among 1454 Antiretroviral Therapy (ART)–eligible Men Who Have Sex With Men in 10 Indian Cities and 1939 ART-eligible People Who Inject Drugs in 12 Indian Citiesa
| Characteristic | MSM | PWID | ||||
|---|---|---|---|---|---|---|
| Virally Suppressed (n = 881) | Not Virally Suppressed (n = 573) | Total (n = 1454) | Virally Suppressed (n = 678) | Not Virally Suppressed (n = 1261) | Total (n = 1939) | |
| Age, y, median (IQR) | 38 (32–42) | 35 (27–40) | 37 (30–42) | 38 (31–43) | 31 (26–37) | 33 (27–40) |
| Female sex | … | … | … | 121 (24.3) | 76 (10.7) | 197 (15.2) |
| Marital status | ||||||
| Never married | 182 (22.6) | 154 (26.0) | 336 (23.8) | 210 (25.0) | 565 (42.9) | 775 (36.9) |
| Currently married/living with a partner | 628 (71.7) | 376 (64.7) | 1004 (69.3) | 347 (59.3) | 460 (40.9) | 807 (47.0) |
| Divorced/widowed/separated/other | 71 (5.7) | 42 (9.3) | 113 (6.9) | 121 (15.7) | 236 (16.3) | 357 (16.1) |
| Sexual identity | ||||||
| Panthi | 191 (25.0) | 143 (25.3) | 334 (25.1) | … | … | … |
| Kothi | 389 (35.4) | 244 (37.9) | 633 (36.3) | … | … | … |
| Double-decker | 249 (30.7) | 144 (25.0) | 393 (28.8) | … | … | … |
| Gay/MSM | 10 (2.5) | 12 (2.5) | 22 (2.5) | … | … | … |
| Bisexual | 42 (6.3) | 30 (9.3) | 72 (7.3) | … | … | … |
| Education | ||||||
| Primary school or less | 252 (24.7) | 186 (30.5) | 438 (26.7) | 123 (24.9) | 531 (50.0) | 654 (41.7) |
| Secondary school | 377 (39.0) | 235 (39.7) | 612 (39.2) | 336 (48.8) | 565 (42.0) | 901 (44.2) |
| High school or more | 252 (36.3) | 152 (29.8) | 404 (34.1) | 219 (26.4) | 165 (8.0) | 384 (14.1) |
| Monthly income, USD | ||||||
| <$50 | 60 (7.6) | 43 (7.1) | 103 (7.4) | 230 (31.2) | 280 (20.5) | 510 (24.0) |
| $50–$115 | 272 (26.7) | 163 (26.3) | 435 (26.6) | 225 (33.3) | 489 (42.2) | 714 (39.2) |
| >$115 | 549 (65.6) | 367 (66.6) | 916 (66.0) | 223 (35.5) | 492 (37.3) | 715 (36.7) |
| HIV treatment literacyb | 718 (84.2) | 371 (64.6) | 1089 (77.6) | 582 (87.8) | 566 (39.4) | 1148 (55.6) |
| Transactional sexc | 278 (25.1) | 222 (30.3) | 500 (26.8) | 41 (4.8) | 107 (5.6) | 148 (5.3) |
| Presence of other STIsd | 135 (9.7) | 76 (9.9) | 211 (9.8) | 56 (6.0) | 88 (5.9) | 144 (6.0) |
| Composite stigma scoree, median (IQR) | 16 (6–26) | 12 (4–23) | 15 (5–24) | 21 (12–30) | 23 (14–32) | 22 (13–30) |
| Healthcare stigmaf | 78 (4.2) | 55 (5.4) | 133 (4.6) | 26 (2.7) | 54 (3.4) | 80 (3.2) |
| Last needle exchange visit | ||||||
| Never or >6 mo ago | … | … | … | 491 (85.2) | 826 (73.2) | 1316 (77.2) |
| Past 1–6 mo | … | … | … | 36 (3.6) | 90 (5.0) | 126 (4.5) |
| Past 1 mo | … | … | … | 151 (11.2) | 345 (21.8) | 496 (18.3) |
| Use of OAT | ||||||
| Never or >6 mo ago | … | … | … | 467 (78.0) | 867 (73.1) | 1334 (74.8) |
| Past 1–6 mo | … | … | … | 24 (2.3) | 67 (3.8) | 91 (3.3) |
| Past 1 mo | … | … | … | 187 (19.7) | 327 (23.0) | 514 (21.9) |
| Alcohol useg | ||||||
| None/mild | 747 (91.3) | 424 (81.9) | 1171 (88.1) | 523 (82.7) | 884 (70.8) | 1407 (74.7) |
| Harmful/hazardous | 81 (6.2) | 75 (11.1) | 156 (7.8) | 83 (9.9) | 211 (18.3) | 294 (15.6) |
| Alcohol dependence | 53 (2.5) | 74 (7.1) | 127 (4.0) | 72 (7.4) | 166 (10.9) | 238 (9.8) |
| AUDIT score, median (IQR) | 0 (0–3) | 0 (0–6) | 0 (0–4) | 0 (0–4) | 0 (0–9) | 0 (0–8) |
| Depressionh | ||||||
| None/mild | 751 (87.6) | 462 (87.0) | 1213 (87.4) | 522 (78.5) | 902 (72.6) | 1424 (74.5) |
| Moderate | 81 (8.5) | 67 (8.7) | 148 (8.6) | 81 (12.6) | 201 (15.7) | 282 (14.7) |
| Severe | 49 (3.9) | 44 (4.3) | 93 (4.0) | 75 (9.0) | 158 (11.7) | 233 (10.8) |
| Recreational drug usei (excluding marijuana) | 67 (3.1) | 102 (9.5) | 169 (5.3) | … | … | … |
| Recreational drug usei (including marijuana) | 100 (6.7) | 130 (15.0) | 230 (9.5) | … | … | … |
| Injection drug usej | ||||||
| None | … | … | … | 281 (58.5) | 208 (22.5) | 489 (34.4) |
| Less than daily injector | … | … | … | 256 (28.9) | 521 (38.8) | 778 (35.5) |
| Daily injector | … | … | … | 141 (12.6) | 531 (38.8) | 672 (30.1) |
Data are presented as no. (column %) unless otherwise indicated.
Abbreviations: AUDIT, Alcohol Use Disorders Identification Test; HIV, human immunodeficiency virus; IQR, interquartile range; MSM, men who have sex with men; OAT, opioid agonist therapy; PWID, people who inject drugs; STI, sexually transmitted infection; USD, US dollars.
aPrevalence is Respondent-driven Sampling II weighted.
bIncludes anyone who reports having heard of medicines that control HIV or those who agree that medicines exist that treat HIV/AIDS.
cIncludes anyone who reports receiving sex for money, alcohol, drugs, goods, or vice versa in past 6 months.
dIncludes syphilis, gonorrhea, chlamydia, herpes simplex virus, hepatitis A/B/C virus, Trichomonas.
eThis score consists of summing participant responses to 22 questions related to enacted stigma, vicarious stigma, felt normative stigma, and internalized stigma. Range is 0–66.
fConsists of a subset of stigma questions related to hospital mistreatment, denial of medical care, and/or being refused care. Range is 0–18. Score ≥12 is a positive healthcare stigma score.
gMeasured using AUDIT. None/mild alcohol use defined as score ≤7; harmful/hazardous alcohol use defined as score 8–14; alcohol dependence defined as score ≥15.
hMeasured using Patient Health Questionnaire–9. None/mild depression defined as score ≤9; moderate depression defined as score 10–14; severe depression defined as score ≥15.
iIncludes injection and/or noninjection use of heroin/brown sugar, cocaine/crack, stimulant, buprenorphine, allergy medicine/antihistamine, painkiller, sedative/tranquilizer, hallucinogen, inhalant/solvent, intoxicating tobacco, and other substances in past 6 months.
jIncludes injection of ≥1 of the following substances in each of the past 180 days: heroin/brown sugar, cocaine/crack, stimulant, buprenorphine, allergy medicine/antihistamine, painkiller, sedative/tranquilizer/antianxiety medications, and other substances.
Of the 1939-treatment eligible HIV-infected PWID, the median age was 33 years (IQR, 27–40 years) and 197 (15.2%) were female. Nearly half (47%) were currently married or living with a partner; 45.1% of the spouses of PWID had never been tested for HIV. More than a third (36.7%) reported monthly income >115 USD. The median composite stigma score was 22 (IQR, 13–30), and 3.2% reported healthcare stigma. About 1 in 5 (21.9%) reported using opioid agonist therapy (OAT) in the prior month.
Prevalence of Depression, Alcohol Use, and Substance Use
Overall, 8.6% and 4.0% of MSM in the sample had evidence of moderate and severe depression, respectively; 13.1% reported functional impairment from depression; 4.0% reported alcohol dependence, and 9.5% reported recreational drug use in the prior 6 months. Marijuana was the most commonly used substance (6.2%), followed by stimulants (1.6%), injected allergy medicine/antihistamine (1.2%), inhalants/solvents (0.8%), and inhaled heroin (0.6%).
Among PWID, prevalence of alcohol dependence was 9.8%, prevalence of moderate and severe depression was 14.7% and 10.8%, respectively, and prevalence of functional impairment from depression was 15.8%. About a third (30.1%) reported daily injection. The most commonly injected substances were allergy medicines/antihistamines (36.2%), followed by buprenorphine (36.1%) and heroin (35.0%).
Prevalence and Correlates of Viral Suppression Among MSM
Prevalence of viral suppression among HIV-infected ART-eligible MSM was 66.2% overall (95% confidence interval [CI], 61.9%–70.2%). In univariable analyses, viral suppression was significantly more common among those who were older and had higher HIV treatment literacy (P < .05 for all). Conversely, alcohol dependence, recreational drug use, and severe depression were associated with lower likelihood of viral suppression, though only alcohol dependence was statistically significant (Table 2). In the multivariable model, age per 10 years (adjusted PR [aPR], 1.14 [95% CI, 1.08–1.20]) and higher HIV treatment literacy (aPR, 1.58 [95% CI, 1.14–2.17]) were associated with higher levels of viral suppression; alcohol dependence (aPR, 0.71 [95% CI, .53–.95]) was negatively associated with viral suppression.
Correlates of Viral Suppressiona Among 1454 Antiretroviral Therapy–eligible Men Who Have Sex With Men in 10 Indian Citiesb
| Characteristic | PR | (95% CI) | aPR | (95% CI) |
|---|---|---|---|---|
| Age per 10 y | 1.18 | (1.08–1.30) | 1.14 | (1.08–1.20) |
| Marital status | ||||
| Never married | Ref | … | … | … |
| Currently married/living with a partner | 1.14 | (.99–1.32) | … | … |
| Divorced/widowed/separated/other | 1.16 | (.82–1.62) | … | … |
| Sexual identity | ||||
| Panthi | Ref | … | Ref | … |
| Kothi | 1.04 | (.83–1.32) | 0.96 | (.83–1.12) |
| Double-decker | 1.08 | (.81–1.44) | 1.02 | (.84–1.24) |
| Gay/MSM | 0.92 | (.65–1.28) | 0.97 | (.70–1.35) |
| Bisexual | 0.87 | (.66–1.16) | 0.83 | (.64–1.08) |
| Education | ||||
| Primary school or less | Ref | … | … | … |
| Secondary school | 1.12 | (.91–1.38) | … | … |
| High school or more | 1.15 | (.94–1.40) | … | … |
| Monthly income, USD | ||||
| <$50 | Ref | … | … | … |
| $50–$115 | 1.03 | (.85–1.25) | … | … |
| >$115 | 0.94 | (.77–1.14) | … | … |
| HIV treatment literacy | 1.64 | (1.13–2.36) | 1.58 | (1.14–2.17) |
| Transactional sex | 0.98 | (.87–1.11) | … | … |
| Presence of other STIs | 1.06 | (.95–1.19) | … | … |
| Composite stigma per 10-point increase | 1.05 | (.97–1.14) | … | … |
| Healthcare stigma | 0.99 | (.97–1.02) | … | … |
| Alcohol dependencec | 0.58 | (.44–0.78) | 0.71 | (.53–.95) |
| Severe depression | 0.90 | (.65–1.26) | 0.86 | (.64–1.15) |
| Recreational drug used | 0.59 | (.33–1.06) | 0.64 | (.40–1.02) |
Abbreviations: aPR, adjusted prevalence ratio; CI, confidence interval; HIV, human immunodeficiency virus; MSM, men who have sex with men; PR, prevalence ratio; Ref, reference value; STI, sexually transmitted infection; USD, United States dollars.
aDefined as HIV RNA load <150 copies/mL.
bWith Respondent-driven Sampling II weights.
cEach category of alcohol use was analyzed, and only alcohol dependence (Alcohol Use Disorders Identification Test score ≥15) was significant at the univariable level. The other categories were dropped at this stage.
dRecreational drug use excludes marijuana in all univariable and multivariable analyses.
Interaction Between Depression, Alcohol Dependence, and Recreational Drug Use in MSM
In univariable analyses, there was evidence of a synergistic association between recreational drug use and severe depression on viral suppression (Table 3). Compared to MSM who were not severely depressed and did not use recreational drugs, those with evidence of severe depression only (PR, 0.94) or recreational drug use only (PR, 0.61) were not statistically different, but those who were both severely depressed and used recreational drugs were significantly less likely to be suppressed (PR, 0.39 [95% CI, .18–.86]). This interaction remained statistically significant in multivariable analysis (P = .02).
Unadjusted and Adjusted 2-way Interactions Between Severe Depression, Alcohol Dependence, and Recreational Drug Use Among Men Who Have Sex With Men
| Exposure | PR | (95% CI) | aPRa | (95% CI) |
|---|---|---|---|---|
| Severe depression and alcohol dependence | ||||
| Neither | Ref | Ref | ||
| Severe depression | 0.85 | (.59–1.25) | 0.79 | (.55–1.15) |
| Alcohol dependence | 0.50 | (.36–.70) | 0.54 | (.41–.70) |
| Both severe depression and alcohol dependence | 1.19 | (1.00–1.42) | 1.00 | (.83–1.19) |
| P value for interaction | .05 | .97 | ||
| Alcohol dependence and recreational drug use | ||||
| Neither | Ref | Ref | ||
| Alcohol dependence | 0.70 | (.43–1.16) | 0.70 | (.45–1.09) |
| Recreational drug use | 0.63 | (.36–1.12) | 0.63 | (.39–1.03) |
| Both alcohol dependence and recreational drug use | 0.41 | (.14–1.20) | 0.45 | (.20–.99) |
| P value for interaction | .10 | .046 | ||
| Severe depression and recreational drug use | ||||
| Neither | Ref | Ref | ||
| Severe depression | 0.94 | (.71–1.26) | 0.87 | (.66–1.14) |
| Recreational drug use | 0.61 | (.35–1.05) | 0.62 | (.40–.95) |
| Both severe depression and recreational drug use | 0.39 | (.18–.86) | 0.37 | (.16–.84) |
| P value for interaction | .02 | .02 |
With Respondent-driven Sampling II weights.
Abbreviations: aPR, adjusted prevalence ratio; CI, confidence interval; PR, prevalence ratio; Ref, reference value.
aAdjusted for age, sexual identity, and human immunodeficiency virus treatment literacy.
There was also evidence of interaction between alcohol dependence and recreational drug use in adjusted analysis. Compared to MSM who did not have alcohol dependence and did not use recreational drugs, those with alcohol dependence only (PR, 0.70) or recreational drug use only (PR, 0.63) were not statistically different but those with both alcohol dependence and recreational drug use were significantly less likely to be suppressed (PR, 0.45 [95% CI, .20–.99]; P value for interaction = .046).
When the joint effects of severe depression, alcohol dependence, and recreational drug use were analyzed (Table 4), there was further evidence of interaction. Among persons who did not use drugs, those with alcohol dependence and depression had higher prevalence of viral suppression (PR, 1.54 [95% CI, 1.03–2.30]). However, among those who reported recreational drug use, the combination of depression and alcohol dependence was associated with significantly lower prevalence of viral suppression (aPR, 0.23 [95% CI, .09–.57]; P value for interaction < .01). Similar results were noted among strata of the other pairs of exposures; individuals were significantly less likely to be virally suppressed only when they also had the third exposure of interest.
Unadjusted and Adjusted 3-way Interactions Between Severe Depression, Alcohol Dependence, and Recreational Drug Use Among Men Who Have Sex With Men
| Exposure | PR | (95% CI) | aPRa | (95% CI) |
|---|---|---|---|---|
| Severe depression and alcohol dependence | ||||
| Among those without recreational drug use | ||||
| Neither | Ref | … | Ref | … |
| Severe depression | 1.37 | (.77–2.43) | 1.27 | (.78–2.06) |
| Alcohol dependence | 0.93 | (.40–2.19) | 0.98 | (.48–1.99) |
| Both severe depression and alcohol dependence | 1.89 | (1.02–3.49) | 1.54 | (1.03–2.30) |
| P value for interaction | .04 | … | .04 | … |
| Among those with recreational drug use | ||||
| Neither | Ref | … | Ref | … |
| Severe depression | 0.40 | (.17–.96) | 0.37 | (.15–.93) |
| Alcohol dependence | 0.42 | (.14–1.22) | 0.45 | (.20–.99) |
| Both severe depression and alcohol dependence | 0.23 | (.09–.59) | 0.23 | (.09–.57) |
| P value for interaction | < .01 | … | < .01 | … |
| Alcohol dependence and recreational drug use | ||||
| Among those without severe depression | ||||
| Neither | Ref | … | Ref | … |
| Alcohol dependence | 0.76 | (.35–1.63) | 0.83 | (.41–1.69) |
| Recreational drug use | 0.68 | (.40–1.17) | 0.74 | (.46–1.18) |
| Both alcohol dependence and recreational drug use | 0.44 | (.17–1.15) | 0.52 | (.26–1.02) |
| P value for interaction | .09 | … | .06 | … |
| Among those with severe depression | ||||
| Neither | Ref | … | Ref | … |
| Alcohol dependence | 1.27 | (1.11–1.46) | 1.03 | (.88–1.21) |
| Recreational drug use | 0.40 | (.16–.96) | 0.37 | (.15–.93) |
| Both alcohol dependence and recreational drug use | 0.23 | (.09–.59) | 0.23 | (.09–.57) |
| P value for interaction | < .01 | … | < .01 | … |
| Severe depression and recreational drug use | ||||
| Among those without alcohol dependence | ||||
| Neither | Ref | … | Ref | … |
| Severe depression | 1.41 | (.85–2.36) | 1.26 | (.80–2.00) |
| Recreational drug use | 0.95 | (.47–1.93) | 0.93 | (.53–1.61) |
| Both severe depression and recreational drug use | 0.58 | (.23–1.48) | 0.53 | (.21–1.32) |
| P value for interaction | .25 | … | .17 | … |
| Among those with alcohol dependence | ||||
| Neither | Ref | … | Ref | … |
| Severe depression | 1.27 | (1.11–1.46) | 1.03 | (.88–1.21) |
| Recreational drug use | 0.42 | (.14–1.22) | 0.45 | (.20–.99) |
| Both severe depression and recreational drug use | 0.23 | (.09–.59) | 0.23 | (.09–.57) |
| P value for interaction | < .01 | … | < .01 | … |
With Respondent-driven Sampling II weights.
Abbreviations: aPR, adjusted prevalence ratio; CI, confidence interval; PR, prevalence ratio; Ref, reference value.
aAdjusted for age, sexual identity, and human immunodeficiency virus treatment literacy.
Prevalence and Correlates of Viral Suppression Among PWID
Prevalence of viral suppression among HIV+ ART-eligible PWID was 33.2% (95% CI, 29.8%–36.8%). In univariable analyses (Table 5), viral suppression was significantly higher among those who were older, currently married/living with a partner, had higher than a primary school education, and had high treatment literacy (P < .05 for all). Utilization of a needle exchange program in the prior month, harmful/hazardous alcohol use, severe depression, and injecting in the prior 6 months were associated with a lower likelihood of being suppressed.
Correlates of Viral Suppressiona Among 1939 Antiretroviral Therapy–eligible People Who Inject Drugs in 12 Indian Citiesb
| Characteristic | PR | (95% CI) | aPRc | (95% CI) |
|---|---|---|---|---|
| Age per 10 y | 1.54 | (1.15–2.05) | 1.41 | (1.12–1.78) |
| Female sex | 1.52 | (.90–2.58) | 1.17 | (.92–1.46) |
| Marital status | ||||
| Never married | Ref | … | Ref | … |
| Currently married/living with a partner | 1.48 | (1.10–2.01) | 1.05 | (.86–1.29) |
| Divorced/widowed/separated/other | 1.22 | (.77–1.93) | … | … |
| Education | ||||
| Primary school or less | Ref | … | Ref | … |
| Secondary school | 2.02 | (1.04–3.93) | 1.36 | (.97–1.92) |
| High school or more | 3.23 | (1.73–6.06) | 1.70 | (1.09–2.66) |
| Monthly income, USD | ||||
| <$50 | Ref | … | … | … |
| $50–$115 | 0.82 | (.47–1.41) | … | … |
| >$115 | 0.88 | (.56–1.38) | … | … |
| HIV treatment literacy | 4.88 | (2.42–9.84) | 3.04 | (1.66–5.55) |
| Transactional sex | 1.04 | (.54–2.00) | … | … |
| Presence of other STIs | 0.95 | (.53–1.70) | … | … |
| Composite stigma per 10-point increase | 0.95 | (.77–1.16) | … | … |
| Healthcare stigma | 0.98 | (.94–1.02) | … | … |
| Last needle exchange visit | ||||
| Never or >6 mo ago | Ref | … | Ref | … |
| Past 1–6 mo | 0.84 | (.62–1.13) | … | … |
| Past 1 mo | 0.58 | (.37–.90) | 0.95 | (.76–1.18) |
| Use of OAT | ||||
| Never or >6 mo ago | Ref | … | … | … |
| Past 1–6 mo | 0.68 | (.33–1.38) | … | … |
| Past 1 mo | 0.91 | (.53–1.55) | … | … |
| Alcohol use | ||||
| None/mild | Ref | … | Ref | … |
| Harmful/hazardous | 0.70 | (.53–.94) | 0.89 | (.71–1.10) |
| Alcohol dependence | 0.88 | (.62–1.24) | … | … |
| Depression | ||||
| None/mild | Ref | … | Ref | … |
| Moderate | 0.69 | (.45–1.06) | 1.03 | (.82–1.30) |
| Severe | 0.51 | (.27–.96) | 0.75 | (.51–1.12) |
| Injection drug use | ||||
| None | Ref | … | Ref | … |
| Less than daily injector | 0.56 | (.35–.90) | 0.66 | (.48–.90) |
| Daily injector | 0.30 | (.17–.55) | 0.51 | (.31–.82) |
Abbreviations: aPR, adjusted prevalence ratio; CI, confidence interval; HIV, human immunodeficiency virus; OAT, opioid agonist therapy; PR, prevalence ratio; Ref, reference value; STI, sexually transmitted infection; USD, US dollars.
aDefined as HIV RNA load <150 copies/mL.
bWith Respondent-driven Sampling II weights.
cAdjusted for age, sex, marital status, education, HIV treatment literacy, use of needle exchange, depression, and injection drug use frequency.
In multivariable analyses, age (aPR per 10-year increase, 1.41 [95% CI, 1.12–1.78]), high school education (aPR, 1.70 [95% CI, 1.09–2.66]), and higher HIV treatment literacy (aPR, 3.04 [95% CI, 1.66–5.55]) were associated with higher levels of suppression while, compared to those who did not report injection, those injecting less than daily (aPR, 0.48 [95% CI, .66–.90]), and those injecting daily (aPR, 0.51 [95% CI, .31–.82]) were less likely to be virologically suppressed. The data did not support any interaction between alcohol use, drug use, and depressive symptoms for PWID.
The Supplementary Tables present unweighted analyses.
DISCUSSION
In this large community-based sample of MSM and PWID, overall viral suppression was 66.2% and 33.2% among treatment-eligible MSM and PWID, respectively. Among MSM, findings suggest a synergistic effect of severe depression, alcohol dependence, and recreational drug use on viral suppression. Among PWID, daily injection was the major barrier to achieving viral suppression.
Given the suboptimal levels of viral suppression observed in these populations, which could be attributable to suboptimal adherence, the provision of dolutegravir as a standard first-line regimen (as opposed to efavirenz, the current first-line regimen in India) could be beneficial in curbing development of drug-resistant strains in these populations.
Recreational drug use being a major barrier to achieving viral suppression in this sample of MSM in India, particularly in the context of co-occurring severe depression or alcohol dependence, is in line with findings across other studies in high-income settings [24, 25]. While the overall prevalence of drug use was low in this MSM sample, the influx of “party drugs” such as MDMA (ecstasy) in the Indian market in recent years is likely to increase the prevalence of chemsex [26]. Chemsex has been associated with higher risk of HIV and STIs in high-income settings [27, 28]. While the prevalence of severe depression was only 4% in this population, about 1 in 8 individuals reported functional impairment from depression symptoms, suggesting an unmet need for counseling and therapy that exceeds the proportion screening positive for depression.
These findings collectively highlight the impact of psychosocial factors on viral suppression, so it is critical that HIV care and treatment programs targeted at MSM also address these issues. For example, incorporating counseling services and naltrexone pharmacotherapy into a differentiated care model for MSM could address both depression and alcohol use [29]. Several interventions exist that could be delivered by counselors using minimal infrastructure and have been shown to impact alcohol use [30–32]. While the prevalence of recreational drug use is low in this population, it is critical that programs take cognizance of the growing recreational drug use epidemic among MSM in low- and middle-income countries and implement interventions to address them.
Among PWID, we identified recent injection as a major barrier to viral suppression, which has been described elsewhere [33–35]. There are a wide range of drugs injected in India; heroin and buprenorphine are among the more commonly injected drugs. Combining antihistamines with these drugs is a common practice that has been well documented in India [36–38]. A recent meta-analysis demonstrated a positive association between being enrolled in an OAT program and viral suppression [39]. While we did not observe such an association in these analyses, we were limited by the lack of detailed OAT utilization data. Integrating HIV testing, care, and treatment into OAT programs could be an avenue to both improving ART uptake and achieving viral suppression in these populations, while simultaneously reducing risk of transmission [40].
Among both MSM and PWID, those with better treatment literacy were more likely to be virologically suppressed. Misconceptions regarding HIV and ART are common, which can result in suboptimal uptake. Overcoming this knowledge gap requires concerted awareness building in high-risk populations about the benefits of ART. Counseling at the time of diagnosis on the management of HIV, including how to access ART, could increase treatment literacy and ultimately ART utilization.
We have previously demonstrated a high HIV burden among spouses of MSM and PWID [41–43]; uptake of HIV testing among spouses of both MSM and PWID is not universal, and is particularly poor among spouses of PWID. Testing and treating partners, as well as using prevention strategies such as preexposure prophylaxis among HIV-negative partners, will be critical in preventing further transmission.
There are some limitations to these analyses. The cross-sectional nature of the data does not enable examining temporality between the exposures and outcome. Furthermore, viral load data are available only from 1 time point. Understanding the impact of these factors on long-term viral suppression patterns or trajectories is critical. Depression, alcohol use, and substance use were all self-reported and subject to social desirability and recall bias. We used trained interviewers who were not from the local community and used validated questionnaires to mitigate these biases [20, 44, 45]. The low levels of education may impact the results of standardized surveys such as PHQ-9, thereby underestimating depression. Despite the availability of ART and diagnostic facilities free of charge to people living with HIV in the country, the number of centers per city varies by size, stockouts are common, and travel distance can be a barrier. While these factors could impact adherence, we were unable to ascertain the impact these factors in these analyses [46].
Nevertheless, these data from a large community-based sample of MSM and PWID across India clearly highlight the importance of incorporating psychosocial and harm-reduction services into differentiated HIV care models targeting MSM and PWID in low- and middle-income countries. Integrating these services could result in higher levels of viral suppression in these vulnerable populations, which is critical to the control of the HIV epidemic globally.
Supplementary Data
Supplementary materials are available at Clinical Infectious Diseases online. Consisting of data provided by the authors to benefit the reader, the posted materials are not copyedited and are the sole responsibility of the authors, so questions or comments should be addressed to the corresponding author.
Notes
Acknowledgments . The authors thank the National AIDS Control Organization, India; all of our partner nongovernmental organizations throughout India; and our study staff and the study participants, without whom this research would not have been possible.
Financial support . This work was supported by the National Institutes of Health (grant numbers P30AI094189). Additional support was provided by the Elton John AIDS Foundation.
Potential conflicts of interest . The authors: No reported conflicts of interest. All authors have submitted the ICMJE Form for Disclosure of Potential Conflicts of Interest. Conflicts that the editors consider relevant to the content of the manuscript have been disclosed.
References
United Nations Office on Drugs and Crime, Regional Office for South Asia.

