


Abstract
Seasonal influenza infection may cause significant morbidity and mortality in transplant recipients. The purpose of this study was to assess the epidemiology of symptomatic influenza infection posttransplant and determine risk factors for severe disease.
Twenty centers in the United States, Canada, and Spain prospectively enrolled solid organ transplant (SOT) or hematopoietic stem cell transplant (HSCT) recipients with microbiologically confirmed influenza over 5 consecutive years (2010–2015). Demographics, microbiology data, and outcomes were collected. Serial nasopharyngeal swabs were collected at diagnosis and upto 28 days, and quantitative polymerase chain reaction for influenza A was performed.
We enrolled 616 patients with confirmed influenza (477 SOT; 139 HSCT). Pneumonia at presentation was in 134 of 606 (22.1%) patients. Antiviral therapy was given to 94.1% for a median of 5 days (range, 1–42 days); 66.5% patients were hospitalized and 11.0% required intensive care unit (ICU) care. The receipt of vaccine in the same influenza season was associated with a decrease in disease severity as determined by the presence of pneumonia (odds ratio [OR], 0.34 [95% confidence interval {CI}, .21–.55], P < .001) and ICU admission (OR, 0.49 [95% CI, .26–.90], P = .023). Similarly, early antiviral treatment (within 48 hours) was associated with improved outcomes. In patients with influenza A, pneumonia, ICU admission, and not being immunized were also associated with higher viral loads at presentation (P = .018, P = .008, and P = .024, respectively).
Annual influenza vaccination and early antiviral therapy are associated with a significant reduction in influenza-associated morbidity, and should be emphasized as strategies to improve outcomes of transplant recipients.
(.)
Influenza is a major public health problem causing significant morbidity and occasional mortality in the general population, and specifically in certain vulnerable groups such as the elderly or patients with impaired immune systems. The increasing use of immunosuppression as a treatment for a number of diseases has resulted in a growing population of immunosuppressed patients at risk for community-acquired infection. One specific group that is often considered the most immunosuppressed is transplant recipients, either of solid organ transplantation (SOT) or hematopoietic stem cell transplantation (HSCT).
The epidemiology of seasonal influenza in transplant recipients has only been partially defined. Attack rates likely vary due to differences in transplant populations, immunosuppression protocols, exposures, and type and virulence of circulating influenza viruses. Complications of influenza infection appear to be common in both HSCT and SOT populations. In some reports, a relatively high rate of progression to viral pneumonia has been observed, especially in lung transplant recipients and HSCT recipients [1, 2]. Complications including secondary bacterial pneumonia as well as extrapulmonary complications such as myocarditis and myositis have been reported [3]. However, these studies are limited by very small sample sizes, single-center data, and limited virologic analyses.
Neuraminidase inhibitors are used to treat influenza infection in transplant recipients and most experts will start therapy regardless of duration of symptoms. The effectiveness of antiviral therapy in transplant recipients several days after symptom onset remains unclear. The annual influenza vaccine is recommended for use in transplant recipients [4]. However, there are limited data to demonstrate effectiveness of vaccine in this group, and recommendations are primarily based on immunogenicity studies and data extrapolated from the general population. Due to concerns regarding immunogenicity, efficacy, and adverse effects, vaccine uptake by transplant programs and patients is variable and in some reports has been even lower than in the general population [5, 6].
We performed a multicenter prospective study of influenza in transplant recipients carried out over 5 influenza seasons. The goals of the study were to better define the clinical epidemiology and virologic characteristics of symptomatic influenza infection and to determine factors associated with more severe clinical outcomes such as lower respiratory tract infection (LRTI), mechanical ventilation, and admission to an intensive care unit (ICU).
METHODS
Study Design
This was a multicenter prospective observational study. A total of 20 sites from the United States, Canada, and Spain were included following institutional review board approval at each site. Participating transplant centers were identified through the American Society of Transplantation’s Infectious Diseases Community of Practice and the Spanish Network of Research in Infectious Diseases. Site investigators prospectively identified medically attended transplant patients with influenza infection. Inclusion criteria were as follows: (1) pediatric or adult transplant recipient (including both SOT and HSCT); (2) microbiologically confirmed diagnosis of influenza infection via a nasopharyngeal (NP) swab or bronchoalveolar lavage specimen during the 2010–2015 seasons; and (3) provided informed consent (either in-person or surrogate). Patients were followed clinically for a 6-month period from the time of presentation. Detailed clinical information was gathered including baseline demographics, signs and symptoms, radiology, laboratory parameters, clinical outcomes such as LRTI, mechanical ventilation, and ICU admission.
In the subset of patients with influenza A infection, consenting patients had serial NP swabs taken at time of presentation (considered day 0 for the purpose of virologic analyses) and at days 3, 6, 11, 18, and 28 for viral load testing (see Laboratory Methods). The results of testing were not used for clinical purposes.
Study Definitions
The primary outcome was LRTI (pneumonia), which was diagnosed on the basis of abnormal chest imaging plus compatible signs and symptoms of pneumonia as determined by the site investigator, who in each case was a transplant infectious disease specialist. Bacterial coinfection was defined as a positive respiratory culture with abnormal chest imaging. In lung transplant recipients, only patients with no concurrent diagnosis of acute rejection were included in the definition of pneumonia. Other definitions, including cytomegalovirus disease, were based on the American Society of Transplantation’s published recommendations that define infectious complications in transplant recipients for use in clinical trials [7]. Oseltamivir dosing was calculated based on the glomerular filtration rate (GFR) as per the product monograph and was labeled high dose or low dose if the dose was higher or lower than recommended for the GFR.
Laboratory Methods
The NP swabs were taken from microbiologically confirmed influenza A virus–infected transplant recipients at presentation (day 0) and days 3, 6, 11, 18, and 28. All NP swabs were stored at –80°C until batch testing as follows. RNA was extracted from NP swabs using the QIAamp Viral RNA Mini Kit (Qiagen). Primers and probe (Integrated DNA Technologies) selected for influenza A quantification consisted of primers FLUAM-1F (5ʹ-AAGACCAATCCTGTCACCTCTGA-3ʹ) and FLUAM-1R (5ʹ-CAA AGCGTCTACGCTGCAGTCC-3ʹ), along with probe FLUA-1P (5ʹ-(FAM)-TTTGTGTTCACGCTCACCGT-(BHQ1)-3ʹ, which target the highly conserved matrix (M) gene of influenza A. The primers and probe were previously published as part of the World Health Organization’s information for molecular diagnosis of influenza virus (available at http://www.who.int/influenza/gisrs_laboratory/molecular_diagnosis_influenza_virus_humans_update_201403rev201505.pdf?ua=1). A 1-step quantitative reverse-transcription polymerase chain reaction (qRT-PCR) reaction was performed using the SuperScript III Platinum One-Step qRT-PCR Kit (Invitrogen), as per the manufacturer’s instructions. In brief, for each reaction, 200 ng of extracted RNA was mixed with 25 µL 2X reaction mix, 1 µL of SuperScript III RT/Platinum TaqMix, forward and reverse primers at a final concentration of 0.2 µM, fluorogenic probe at a final concentration of 0.1 µM, 1 µL of ROX reference dye, and UltraPure DPEC–treated water (Thermo Fisher) to a final volume of 50 µL. Thermal cycling was done on the Applied Biosystems StepOnePlus system and comprised of a 15-minute RT step at 55°C, a 2-minute initial enzyme activation step at 95°C, and 40 cycles of 95°C for 15 seconds and 60°C for 30 seconds. All reactions were run in triplicate. Quantification of viral load was performed using gBlocks Gene Fragments (Integrated DNA Technologies), which are synthetic oligonucleotides corresponding to the target sequence, prepared at a dynamic range from from 1 to 1010 copies/mL. The Gblock sequence was as follows: ATGAGCCTTCTAACCGAGGTCG AAACGTATGTTCTCTCTATCGTTCCATCAGGCCCCCT CAAAGCCGAGATCGCGCAGAGACTTGAAGATGTCTTT GCTGGGAAAAACACAGATCTTGAGGCTCTCATGGAA TGGCTAAAGACAAGACCAATCCTGTCACCTCTGACTAA GGGGATTTTAGGGTTTGTGTTCACGCTCACCGTG CCCAGTGAGCGAGGACTGCAGCGTAGACGCTTT GTCCAAAATGCCCTCAATGGGAATGGAGACCCAAA TAACATGGACAAAGCAGTTAAACTGTATAGGAAAC TTAAGAGGGAGATAACGTTCCATGGGGCCAAAGAAA TAGCTCTCAGTTATTCTGCTGGTGCACTTGCC. Samples below the limit of detection (100 copies/mL) were approximated to 50 copies/mL for statistical analysis.
Statistical Analysis
The sample size was based on a previous study of pandemic influenza A(H1N1) in transplant recipients where the incidence of the primary outcome of LRTI was 32% [1]. Using a conservative incidence of 20%–25% LRTI for seasonal influenza, a minimum sample size of 500 patients means between 100 and 125 patients would meet the primary outcome. This number of outcomes allows for sufficient analysis (in a multivariate model) of modifiable risk factors such as vaccination and antiviral therapy with a power of >90%.
Demographics were analyzed using descriptive statistics. Factors associated with LRTI were analyzed using χ2 test for categorical variables and Mann-Whitney U test for continuous variables. Binary logistic regression analysis was done using variables with P < .1 on univariate analysis and used to determine factors independently associated with LRTI. A similar exploratory analysis was done for ICU admission. Viral loads were compared between groups using Mann-Whitney U testing. Viral kinetics, including viral load half-lives, were calculated using methods previously described [8].
RESULTS
Cohort Description
A total of 616 patients with influenza were enrolled over 5 consecutive influenza seasons (Supplementary Figure 1). This included 477 solid organ transplant and 139 HSCT recipients. There were 25 pediatric patients in the cohort (17 SOT and 8 HSCT). The majority of patients were adults (589 [95.6%]). Baseline demographic data for the cohort are shown in Table 1. The majority of patients were on calcineurin inhibitor–based immunosuppression (cyclosporine or tacrolimus [76.6%]). The median time from transplant to symptom onset was 3.19 years (0.01–40.7 years). Influenza A was identified in 77.7% of patients and the remainder were influenza B (Supplementary Figure 1).
Demographics of Transplant Recipients With Influenza Infection (N = 616)
| Characteristic | No. (%) |
|---|---|
| Age, y, median (range) | 55 (1–84) |
| Pediatric (age <18 y) | 25 (4.1) |
| Male sex | 366 (59.6) |
| Time after transplant, y, median (range) | 3.19 (0.01–40.7) |
| Type of transplant | |
| SOT | 477 (77.4) |
| Kidney | 207 (33.6) |
| Liver | 63 (10.2) |
| Heart | 57 (9.3) |
| Lung | 116 (18.8) |
| Combined | 34 (5.5) |
| HSCT | 139 (22.6) |
| Allogeneic | 91 (14.8) |
| Autologous | 48 (7.8) |
| Comorbidities | |
| Diabetes mellitus | 188 (30.5) |
| Chronic lung disease | 48 (7.8) |
| Smoker | 33 (5.4) |
| Obesity (BMI >30 kg/m2) | 76 (12.3) |
| Morbid obesity (BMI >40 kg/m2) | 10 (1.6) |
| Chronic kidney insufficiency | 113 (18.3) |
| Hospital acquired | 55 (8.9) |
| Influenza A | 476/613 (77.3) |
| Immunosuppression | |
| None | 69 (11.2) |
| Prednisone | 410 (66.8) |
| Tacrolimus | 357 (58.1) |
| Cyclosporin | 115 (18.7) |
| Mycophenolate | 314 (51.1) |
| Azathioprine | 32 (5.2) |
| Sirolimus/everolimus | 51 (8.3) |
| Influenza vaccine in the same season | 375/543 (69.1) |
| Antiviral treatment | 579/615 (94.1) |
| Within 48 h of symptoms | 210/564 (37.2) |
Data are presented as No. (%) unless otherwise indicated.
Abbreviations: BMI, body mass index; HSCT, hematopoietic stem cell transplantation; SOT, solid organ transplantation.
Presenting Symptoms and Outcomes
The presenting symptoms of patients are shown in Figure 1. The most common symptoms were cough, fever, and coryza. Of note, fever was absent as a presenting symptom in 36.2%. Evidence of LRTI (pneumonia) was observed in 134 of 606 (22.1%) patients at the time of presentation. In the majority of patients with pneumonia, no bacterial coinfection was found (n = 25 with bacterial coinfection identified) (Supplementary Table 1). Viral coinfection was found in 15 patients and included respiratory syncytial virus, rhinovirus, adenovirus, parainfluenza, and bocavirus. Hospitalization occurred in 373 of 561 (66.5%) patients (Table 2), with median duration of hospitalization of 6 days (interquartile range [IQR], 3–14 days). More severe outcomes were documented in a subset of patients. This included admission to the intensive care unit in 68 of 616 patients (11.0%) and mechanical ventilation in 49 patients (8.0%). Median duration of ICU stay was 5 days (IQR, 2–17 days). Over the 5-year study period, the annual incidence of pneumonia ranged from 11.3% to 35.0% and ICU admission rates were 8.1%–14.3%. Death within 30 days of diagnosis occurred in 18 patients (2.9%). In the pediatric group, 3 of 25 (12.0%) required ICU admission and 1 required mechanical ventilation. There were no deaths within 30 days.
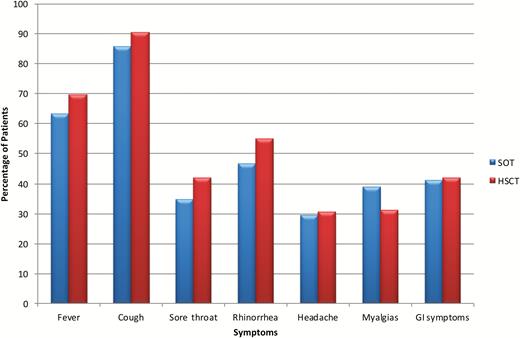
Symptoms at time of presentation in the total cohort. Abbreviations: GI, gastrointestinal; HSCT, hematopoietic stem cell transplantation; SOT, solid organ transplantation.
Outcomes of Patients With Influenza
| Outcome | All Patients (N = 616) | SOT (n = 477) | HSCT (n = 139) | P Value |
|---|---|---|---|---|
| LRTI | 134/606 (22.1) | 98/469 (20.9) | 36/137 (26.5) | .18 |
| Hospitalizationa | 373/561 (66.5) | 307/443 (69.3) | 66/118 (55.9) | .006 |
| Admission to ICU | 68/616 (11.0) | 53/477 (11.1) | 15/139 (10.8) | .92 |
| Mechanical ventilation | 49/616 (8.0) | 37/477 (7.8) | 12/139 (8.6) | .74 |
| Death (all cause at 30 d) | 18/615 (2.9) | 15/476 (3.2) | 3/139 (2.2) | .54 |
| Death (all cause at 180 d) | 42/615 (6.8) | 22/476 (4.6) | 20/139 (14.4) | <.001 |
Data are presented as no./No. (%).
Abbreviations: HSCT, hematopoietic stem cell transplantation; ICU, intensive care unit; LRTI, lower respiratory tract infection; SOT, solid organ transplantation.
aExcluding nosocomial cases.
Antivirals were used in the majority of patients (579/615 [94.1%]) and included either standard-dose oseltamivir (75.3%), high-dose oseltamivir (12.3%), or low-dose oseltamivir (12.3%). No other antivirals were used. Thirty-six (5.9%) patients did not receive any antivirals. The median duration of antiviral treatment was 5 days (IQR, 5–8 days). Twenty-three (4.1%) patients received >10 days of antiviral treatment and 107 (17.4%) had a reduction in immunosuppression.
Comparison of SOT Versus HSCT
We compared presentation and clinical outcomes between SOT and HSCT recipients. Overall symptoms at presentation were similar between the 2 cohorts (Figure 1). No significant differences were noted between SOT and HSCT patients with regard to pneumonia and ICU care. However, HSCT patients had a higher 6-month mortality (13.8% vs 4.8%, P < .001). Viral load at disease onset was also higher in HSCT vs SOT patients (median viral load, 1.04 × 10⁵ copies/mL vs 8.04 × 10³ copies/mL, P = .001) (Supplementary Figure 2). In the SOT cohort, biopsy-proven rejection in the 3 months prior to influenza infection occurred in 39 of 477 patients. Rejection was not associated with pneumonia (P = .95) or ICU admission (P = .86). There were 116 lung transplant recipients, of which 26 (22.4%) were found to have pneumonia. None of these patients had biopsy-proven rejection at the time of presentation, although 11 of 116 (9.5%) had biopsy-proven rejection in the 3 months prior to developing influenza.
Analysis of Factors Related to Severe Disease
We analyzed factors associated with development of pneumonia (Table 3). In both the univariate analysis and the multivariate model, early initiation of antiviral therapy (within 48 hours of symptom onset) was associated with a lower risk of pneumonia development (odds ratio [OR], 0.51 [95% confidence interval {CI}, .31–.86], P = .011). In addition, patients who had received influenza vaccine in the current season were also less likely to have pneumonia at presentation (OR, 0.34 [95% CI, .21–.55], P < .001). Other factors are outlined in Table 3.
Analysis of Risk Factors Associated With Pneumonia at Presentation
| Risk Factor | No. | Pneumonia (n = 134) | No Pneumonia (n = 472) | P Value (Univariate) | Multivariate OR (95% CI) | P Value (Multivariate) |
|---|---|---|---|---|---|---|
| Age, y, median (range) | 606 | 58 (3–83) | 54 (1–84) | .01 | 1.02 (1.00–1.04) | .016 |
| Time from transplant, y, median (range) | 606 | 2.48 (0.03–30.7) | 3.28 (0.01–40.7) | .87 | ||
| Influenza A (vs B) | 603 | 107/132 (81.1) | 361/471 (76.6) | .28 | ||
| SOT (vs HSCT) | 606 | 98/134 (73.1) | 371/472 (78.6) | .18 | ||
| Lung transplant (vs nonlung) | 606 | 26/116 (22.4) | 90/472 (19.1) | .93 | ||
| Hospital-acquired influenza | 606 | 10/134 (7.5) | 45/472 (9.5) | .46 | ||
| Influenza vaccination in the same season | 543 | 63/119 (52.9) | 306/416 (73.6) | <.001 | 0.34 (.21–.55) | <.001 |
| Prednisone (Y/N) | 606 | 95/134 (70.9) | 308/472 (65.3) | .22 | ||
| Calcineurin inhibitor (Y/N) | 606 | 91/134 (67.9) | 376/472 (79.7) | .004 | 0.50 (.29–.88) | .016 |
| Mycophenolate | 606 | 77/134 (57.5) | 230/472 (48.7) | .074 | 1.69 (1.03–2.74) | .035 |
| Azathioprine | 606 | 8/134 (6.0) | 24/472 (5.1) | .69 | ||
| Sirolimus/everolimus | 606 | 17/134 (12.7) | 42/472 (8.9) | .19 | ||
| ≥2 comorbiditiesa | 602 | 28/131 (21.4) | 65/471 (13.8) | .034 | 1.86 (1.04–3.31) | .035 |
| Hypogammaglobulinemiab (IgG <700 mg/dL) | 251 | 22/47 (46.8) | 64/204 (31.4) | .044 | ||
| Lymphopenia (ALC <1000 cells/µL)c | 509 | 71/116 (61.2) | 212/393 (53.9) | .17 | ||
| Early antiviral therapy | 553 | 30/123 (24.4) | 175/430 (40.7) | .001 | 0.51 (.31–.86) | .011 |
Data are presented as no./No. (%) unless otherwise indicated. Bold font represents P-values <.05.
Abbreviations: ALC, absolute lymphocyte count; CI, confidence interval; HSCT, hematopoietic stem cell transplantation; IgG, immunoglobulin G; OR, odds ratio; SOT, solid organ transplantation.
aDiabetes, chronic lung disease (asthma/chronic obstructive pulmonary disease) in non–lung transplant patients, chronic kidney insufficiency (glomerular filtration rate <30 mL/minute), obesity (body mass index >30 kg/m2).
bWithin 1 year prior to influenza diagnosis. Excluded from multivariate analysis as only 40.6% of patients had this information available.
cAt presentation.
We then looked at variables associated with admission to the ICU (Table 4). Again, both immunization in the current influenza season and initiation of early antiviral therapy were independently associated with a lower incidence of requirement for admission to the ICU (OR, 0.49 [95% CI, .26–.90], P = .023 and 0.42 [95% CI, .20–.87], P = .019).
Analysis of Risk Factors Associated With Intensive Care Unit Admission
| Risk Factor | Admitted to ICU (n = 68) | Not Admitted to ICU (n = 548) | P Value (Univariate) | Multivariate OR (95% CI) | P Value (Multivariate) |
|---|---|---|---|---|---|
| Age, y, median (range) | 60 (1–75) | 55 (1–84) | .055 | 1.009 (.99–1.03) | .45 |
| Time from transplant, y, median (range) | 3.82 (0.01–30.7) | 3.21 (0.01–40.7) | .98 | ||
| Influenza A (vs B) | 62/68 (91.2) | 414/545 (76.0) | .005 | 2.25 (.92–5.52) | .077 |
| SOT (vs HSCT) | 53/68 (77.9) | 424/548 (77.4) | .92 | ||
| Lung transplant (vs nonlung) | 14/68 (20.6) | 107/548 (19.5) | .84 | ||
| Hospital-acquired influenza | 13/55 (23.6) | 42/55 (76.4) | .002 | 2.50 (.98–6.37) | .054 |
| Influenza vaccination in the same season | 31/56 (55.4) | 346/487 (71.0) | .016 | 0.49 (.26–.90) | .023 |
| Prednisone (Y/N) | 44/68 (64.7) | 367/548 (67.0) | .71 | ||
| Calcineurin inhibitor (Y/N) | 49/68 (72.1) | 425/548 (77.6) | .31 | ||
| Mycophenolate (Y/N) | 33/68 (48.5) | 281/548 (51.3) | .67 | ||
| Azathioprine | 5/68 (7.4) | 27/548 (4.9) | .40 | ||
| Sirolimus/everolimus | 4/68 (5.9) | 57/548 (10.4) | .24 | ||
| ≥2 comorbidities | 14/68 (20.6) | 80/543 (14.7) | .21 | ||
| Hypogammaglobulinemia (IgG <700 mg/dL) | 7/20 (35.0) | 79/231 (34.2) | .94 | ||
| Lymphopenia | 36/56 (64.3) | 251/462 (54.3) | .16 | ||
| Early antiviral therapy | 15/57 (26.3) | 194/503 (38.6) | .070 | 0.42 (.20–.87) | .019 |
Data are presented as no./No. (%) unless otherwise indicated. Bold font represents P-values <.05.
Abbreviations: CI, confidence interval; HSCT, hematopoietic stem cell transplantation; ICU, intensive care unit; IgG, immunoglobulin G; OR, odds ratio; SOT, solid organ transplantation.
Virologic Data
Viral loads were measured for patients with influenza A virus infection who had serial samples collected (n = 258). All of these patients had received antiviral therapy. Median viral load at onset was 1.3 × 10⁴ copies/mL (range, below the limit of detection to 6.2 × 10⁹). With treatment, viral load declined in the majority of patients (Figure 2A). By day 3, 24% were undetectable and by day 6, 55% were undetectable. Persistent viral detection occurred in 25% at day 11 and 7.1% at day 18. No patient had viral detection by day 28. Viral kinetics analysis demonstrated a median viral load half-life of 0.63 days (range, 0.16–5.63 days), reflecting a rapid logarithmic decline with therapy (Figure 2B) in most patients.
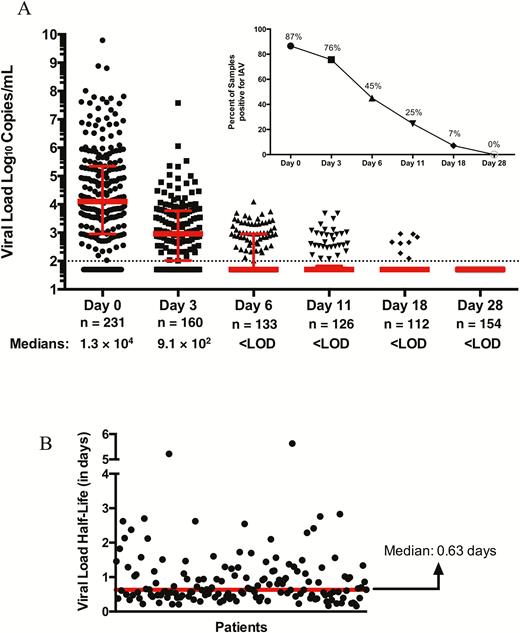
A, Influenza A viral loads in patients on consecutive time points postenrollment (n = 258). B, Viral load half-life (n = 152). All patients received antiviral therapy. Abbreviations: IAV, influenza A virus; LOD, limit of detection.
Virologic data were correlated with clinical outcomes and demonstrated a relationship between viral load and disease severity. Higher viral loads and delayed clearance of detectable virus were associated both with the development of pneumonia and admission to the ICU (Figure 3A and 3B).
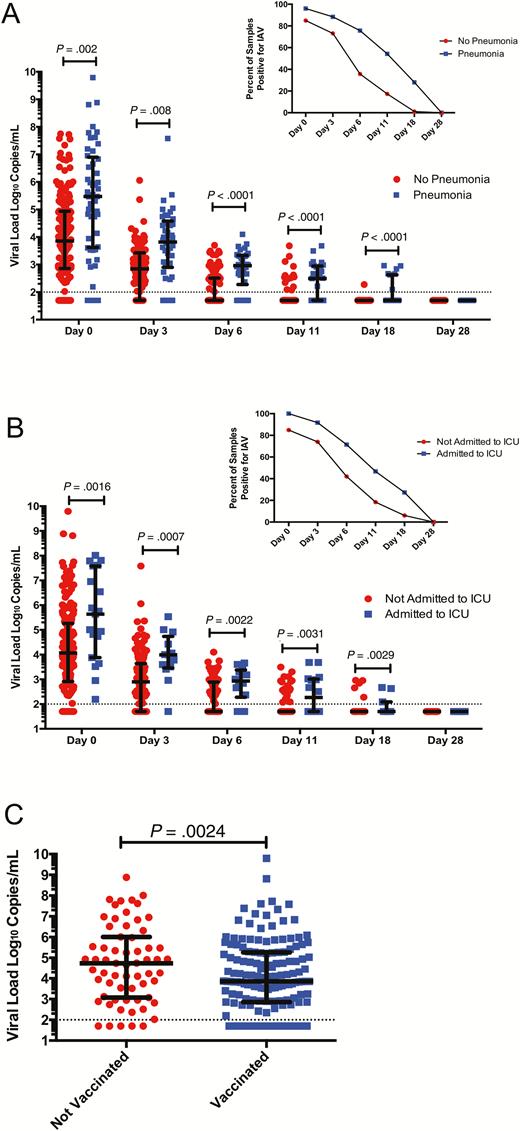
Influenza A viral loads and disease outcomes. A, Viral loads were significantly higher in patients with lower respiratory tract infection (LRTI) vs no LRTI at presentation and over time. B, Viral loads were significantly higher in patients admitted to intensive care unit (ICU) vs no ICU admission over time. C, Viral loads were significantly higher at presentation in patients who did not receive influenza vaccine in the same season as infection. Abbreviations: IAV, influenza A virus; ICU, intensive care unit.
We next analyzed if previously identified clinical correlations were consistent with the virologic data. We found that patients who had been vaccinated in the same year had lower viral loads at onset of disease (7.4 × 10³ vs 5.6 × 10⁴ copies/mL, P = .024; Figure 3C). No differences in baseline viral load were observed with regard to age, type of immunosuppression, time from transplant, or duration of symptoms (Supplementary Figure 3; P > .05 for all comparisons). We did not find a relation between baseline viral load and mortality in the overall cohort (P = .68).
DISCUSSION
We performed a large multicenter, 5-season prospective study in SOT and HSCT recipients of all ages with influenza infection. A broad spectrum of disease was observed, ranging from minimally symptomatic to severe disease requiring ICU admission and mechanical ventilation. Pneumonia was commonly observed (22.1%) and in most cases was not associated with a microbiologically defined bacterial coinfection. Two important clinically actionable findings were observed: (1) The receipt of vaccine in the same influenza season was associated with a decrease in disease severity as determined by several related clinical outcome measures including pneumonia and ICU admission; and (2) early antiviral treatment (within 48 hours) was associated with improved outcomes. The first finding has important prevention and public health implications. Vaccine immunogenicity is known to be suboptimal in transplant recipients and vaccination has not been universally adopted or strongly recommended despite recommendations to the contrary [9, 10]. Although this study was not designed to examine vaccine efficacy, and a subset of vaccinated patients obviously developed influenza, the decrease in severe sequelae is a strong argument for universal vaccination. The findings were consistent across both clinical and virologic parameters and support the concept that even partial immunity offered through vaccination likely results in modification of disease progression in these patients. The second finding related to antiviral therapy suggests that during periods of influenza activity, patients should be counseled to seek early medical attention for symptoms of influenza and should receive empiric therapy while awaiting diagnostic confirmation. Age, vaccination, and early antiviral therapy were significantly associated with the outcomes of pneumonia and ICU admission. Other factors were somewhat different and this may be related to the lower sample of patients who went on to ICU admission.
There are limited prospective data on the epidemiology of influenza in transplant patients. The majority of studies are retrospective and/or single season. The 2 previous largest studies were both retrospective analysis of the H1N1 pandemic 2009–2010 influenza season. In the first study, 237 SOT patients with medically attended pandemic H1N1 were reviewed [1]. Pneumonia, ICU admission, ventilation, and death occurred in 32%, 16%, 9%, and 4%, respectively. The early initiation of antiviral therapy (within 48 hours) was found to be associated with a lower risk of severe outcomes. The second study was in HSCT recipients and reviewed 286 patients. Lower respiratory tract disease occurred in 32.5% of patients and risk factors were age and lymphopenia. A total of 11.5% required mechanical ventilation and death occurred in 6.3% of patients [11]. Kmied et al performed a single-center review of influenza cases in HSCT recipients and found that lower respiratory infection occurred in 23% of patients and that early antivirals were beneficial [12].
There are very limited data on virologic parameters in transplant patients with influenza. Previous studies have generally included very small cohorts of patients [13–16]. The evaluation of serial viral loads in a large cohort of patients is a unique aspect of this study. We demonstrate that viral clearance occurs by day 6 in approximately 55% of patients and by day 28, no persistent virus was detected. This was consistent with a very short viral load half-life of 0.63 days, reflecting an efficient block in viral replication with neuraminidase inhibition. However, we also observed that high viral loads correlated with severity of disease including development of pneumonia and admission to the ICU. In addition, previous vaccination was associated with an approximately 7.5-fold lower viral load at presentation, consistent with the clinical associations observed.
Influenza vaccination has been evaluated in a number of immunogenicity trials in SOT recipients. These trials have demonstrated vaccine seroprotection and seroconversion rates ranging from 15% to 93% with numerous factors influencing vaccine response, including type of transplant and degree of immunosuppression [17]. Due in part to low rates of seroconversion and perceived lack of potential benefit, vaccine uptake in transplant patients is variable and often reported as quite poor [9, 10, 18]. In addition, there have been no true efficacy studies in transplant recipients that have a primary endpoint of influenza infection, primarily due to sample size limitations. A few small studies previously suggested that vaccination may result in allo-upregulation in SOT recipients with potential deleterious effects on the allograft, but larger prospective studies have shown vaccination to be safe and not associated with de novo development or upregulation of existing anti-HLA antibodies directed against graft antigens [19]. In addition, a recent study found that kidney transplant patients given seasonal influenza vaccine are also able to mount heterologous immune responses (ie, antibodies directed against strains other than the vaccine strain) [20]. Immunogenicity and safety data, in conjunction with the findings of the current study, suggest that an increased emphasis on vaccine compliance in immunocompromised patients would likely have significant patient benefit.
Strengths of our study include the large sample size, recruitment over 5 years, and multiple centers. We also performed sequential NP swabs with quantitative viral loads to get accurate information about viral shedding. Our study had some limitations. First, the design of the study meant that only medically attended cases of influenza were enrolled. This means that mildly symptomatic or asymptomatic cases of influenza were less likely to be included in the study. In addition, vaccination history relied on either documentation in the patient chart or recall by the patient, neither of which may be completely accurate. For this reason, we chose to capture only vaccination history in the same influenza season, as this is likely to be reasonably reliable and accurate. Reduction in immunosuppression during treatment of influenza was up to the treating physician and details of which immunosuppressive drug was reduced were not collected. For viral load assessment, the majority of NP swabs were frozen and thawed. This, as well as differences in sensitivities of the assays used, could account for why only 87% of patients had quantifiable viral loads at day 0 on the assay performed at the central laboratory. Serial viral loads were not available for the subset of patients who did not receive antivirals. We also did not have a large group of pediatric transplant recipients, limiting the conclusions that can be made for this population. Strengths of our study include the large sample size, prospective data collection, and virologic assessment. In addition, the conduct of the study over multiple seasons, across multiple centers in both North America and Europe, and in multiple transplant types means the results are very generalizable among transplant centers and patients.
In summary, we provide the descriptive and molecular epidemiology of seasonal influenza infection in a large cohort of transplant recipients. This study provides important clinical and virologic data related to symptomatology, complications, and response to therapy. In addition, this study provides important evidence that annual influenza vaccination and early initiation of antiviral therapy are associated with improved clinical outcomes in transplant patients.
Supplementary Data
Supplementary materials are available at Clinical Infectious Diseases online. Consisting of data provided by the authors to benefit the reader, the posted materials are not copyedited and are the sole responsibility of the authors, so questions or comments should be addressed to the corresponding author.
Notes
Author contributions. Study design: D. K. and A. H. Data collection: all authors. Statistical analysis: D. K., Y. N., V. F. Manuscript writing: all authors.
Acknowledgments. We are grateful to the following research coordinators who participated in the study: Ilona Bahinskaya, Leticia Ely, Pavel Medvedev, Maryann Najdzinowicz, Jessica Strano, Mariela Campo, Samantha Soriano, Michaela Kusumi, Janice Yu, Kirsten Lacombe, Samantha Blum, Kris Richardson, Catherine Kalnicky, Donna Lach, Pam Mason, and Diana Pakstis.
Disclaimer. The funding agency did not have any part in study design, conduct, analysis, or writing of the manuscript.
Financial support. This work was supported through an investigator-initiated grant from Roche.
Potential conflicts of interest. D. K. has received research grants from Roche and GSK, and speaker honoraria from Sanofi and Merck. A. H. has received a research grant from Roche. V. F. has received a travel grant from Roche. E. B. and L. D.-I. have received clinical trials grants from Roche. A. P. L. has received grant support from Genentech. J. E. is a consultant for Gilead and Pfizer and has received research support from GSK, Roche, Gilead, and Chimerix. All other authors report no potential conflicts of interest. All authors have submitted the ICMJE Form for Disclosure of Potential Conflicts of Interest. Conflicts that the editors consider relevant to the content of the manuscript have been disclosed.
Participating centers and investigators. University Health Network, Ontario, Canada (Deepali Kumar, MD, Atul Humar, MD, Shahid Husain, MD); University of Alberta, Alberta, Canada (Atul Humar, MD, Deepali Kumar, MD); Boston Children’s Hospital, Massachusetts (Tanvi Sharma, MD); Cincinnati Children’s Hospital, Ohio (Lara Danziger-Isakov, MD); Cleveland Clinic Foundation, Ohio (Christine Koval, MD); University of Pennsylvania, Philadelphia (Emily Blumberg, MD); University of Pittsburgh, Pennsylvania (Fernanda Silveira, MD); University of Washington, Seattle (Ajit Limaye, MD); Loyola University Medical Center, Chicago, Illinois (Gail Reid, MD); University of Colorado–Denver (Marilyn Levi, MD); Seattle Children’s Hospital, Washington (Janet Englund, MD); University of California, San Francisco (Catherine Liu, MD, Peter Chin-Hong, MD); Hospital Universitario Virgen del Rocío and Biomedicine Research Institute, Seville, Spain (Elisa Cordero, MD, Pilar Perez-Romero, MD, Teresa Aydillo, MD); Hospital Universitario de Bellvitge, Barcelona, Spain (Jordi Carratala, MD); Hospital General Universitario Gregorio Marañón, Madrid, Spain (Patricia Muñoz, MD); Hospital Universitario de Cruces, Vizcaya, Spain (Miguel Montejo, MD); Hospital Universitario 12 de Octubre, Madrid, Spain (Francisco López Medrano, MD); Hospital Universitario Marqués de Valdecilla, Cantabria, Spain (Maria Carmen Fariñas, MD); Hospital Vall d’Hebron, Barcelona, Spain (Joan Gavalda, MD); Hospital Clinic, Barcelona, Spain (Asuncion Moreno, MD); Hospital Universitario Ramón y Cajal, Madrid, Spain (Jesus Fortun, MD); Hospital Universitario Reina Sofía, Cordoba, Spain (Julian Torre-Cisneros, MD).

