


Abstract
Multidrug-resistant organisms (MDROs) are an important cause of morbidity and mortality after solid organ transplantation. We aimed to characterize MDRO colonization dynamics and infection in liver transplant (LT) recipients through innovative use of active surveillance and whole-genome sequencing (WGS).
We prospectively enrolled consecutive adult patients undergoing LT from March 2014 to March 2016. Fecal samples were collected at multiple timepoints from time of enrollment to 12 months posttransplant. Samples were screened for carbapenem-resistant Enterobacteriaceae (CRE), Enterobacteriaceae resistant to third-generation cephalosporins (Ceph-RE), and vancomycin-resistant enterococci. We performed WGS of CRE and selected Ceph-RE isolates. We also collected clinical data including demographics, transplant characteristics, and infection data.
We collected 998 stool samples and 119 rectal swabs from 128 patients. MDRO colonization was detected in 86 (67%) patients at least once and was significantly associated with subsequent MDRO infection (0 vs 19.8%, P = .002). Child-Turcotte-Pugh score at LT and duration of post-LT hospitalization were independent predictors of both MDRO colonization and infection. Temporal dynamics differed between MDROs with respect to onset of colonization, clearance, and infections. We detected an unexpected diversity of CRE colonizing isolates and previously unrecognized transmission that spanned Ceph-RE and CRE phenotypes, as well as a cluster of mcr-1–producing isolates.
Active surveillance and WGS showed that MDRO colonization is a highly dynamic and complex process after LT. Understanding that complexity is crucial for informing decisions regarding MDRO infection control, use of therapeutic decolonization, and empiric treatment regimens.
Multidrug-resistant organisms (MDROs) represent an important cause of morbidity and mortality after solid organ transplantation (SOT) [1–3]. SOT recipients colonized with MDROs may serve as important reservoirs of MDRO transmission across the healthcare setting [4]. Elucidating mechanisms of MDRO colonization, infection, and transmission in SOT recipients is thus an urgent priority. In liver transplantation (LT), there has been a notable shift toward gram-negative infections [5], particularly carbapenem-resistant Enterobacteriaceae (CRE) [2, 3, 6]. Endogenous intestinal colonization with CRE appears to be an important risk factor for subsequent infection in LT patients [7, 8] and diverse SOT populations [9].
Our understanding of temporal evolution of MDRO colonization, clearance, and infection including interaction between different MDROs is limited. Previous studies often focused on a single MDRO class and were largely conducted during outbreaks or over limited time periods [7, 10–16]. Moreover, these studies lacked whole-genome sequencing (WGS) data and did not assess evolving resistance in MDROs or identify important interactions between organisms. For example, a subset of CRE isolates may result from stepwise mutations in extended- spectrum β-lactamase–producing organisms or uptake of resistance conferring plasmids [17], whereas others may result from new transmission events.
We used active surveillance to characterize MDRO colonization and infection including carbapenem-resistant Enterobacteriaceae (CRE), Enterobacteriaceae resistant to third-generation cephalosporins (Ceph-RE), and vancomycin-resistant enterococci (VRE), in a prospective, longitudinal cohort of LT recipients. We then applied bacterial WGS to track the evolution and diversity of gram- negative colonization in LT patients. Our central hypothesis was that patients experience a previously unrecognized diversity of MDRO colonization, both in terms of organism diversity and temporal dynamics, with important infection prevention implications.
METHODS
Study Population and Clinical Data
We prospectively enrolled consecutive adult patients (aged >18 years) undergoing LT at a tertiary care hospital from March 2014 to March 2016. Patients listed for LT or within 1 week posttransplant were eligible for participation. Fecal samples and/or rectal swabs were collected at the time of pretransplant enrollment, weekly during transplant hospitalization, and at months 2, 3, 6, 9, and 12 posttransplant. Subjects were excluded if they had not provided at least 1 sample at 12 months posttransplant. Approval was granted by the Columbia University Medical Center Institutional Review Board (IRB-AAAM7704).
Clinical data were collected including demographics, comorbidities, transplant indication, liver disease severity at time of LT (laboratory Model for End-Stage Liver Disease [MELD]; Child-Turcotte-Pugh [CTP] score), and prior MDRO infection or colonization. Donor characteristics were collected from the United Network for Organ Sharing. We also collected data on LT complications from enrollment until 1 year posttransplant (full details are provided in the Supplementary Methods).
Sample Collection and Specimen Analysis
Fecal samples were screened for CRE, Ceph-RE, and VRE with selective chromogenic agar (DRG International). Cultured isolates underwent identification and susceptibility testing with VITEK-2 (bioMérieux). Minimum inhibitory concentrations (MICs) were interpreted using Clinical and Laboratory Standards Institute criteria [18]. Isolates were classified as CRE according to 2015 Centers for Disease Control and Prevention (CDC) definitions (imipenem, meropenem, or doripenem MIC ≥4 µg/mL, ertapenem MIC ≥2 µg/mL) or detection of a carbapenemase as described below [19]. Enterobacteriaceae phenotypically resistant to any third-generation cephalosporin, with the exception of species with inducible cephalosporin resistance (eg, Enterobacter species) were designated Ceph-RE, according to institutional infection control guidelines. Enterococcus species isolates nonsusceptible to vancomycin (MIC ≥8 µg/mL) were defined as VRE. Any colonization detected in clinical microbiology records from 3 months pretransplant to end of follow-up was included in the analysis. We also collected all available clinical isolates during enrollment.
Definitions
Intestinal MDRO colonization was defined as isolation of VRE, CRE, or Ceph-RE from a rectal swab or stool sample. Colonization clearance was defined as collection of 2 successive negative fecal samples >1 week apart after the initial sample demonstrating colonization [16]. Colonization persistence was defined as failure to clear colonization. All positive bacterial cultures identified from clinical microbiology records were reviewed to determine whether they reflected colonization or infection. Infectious episodes were independently assessed by 2 infectious diseases physicians (N. M., A. G. S.) using National Healthcare and Safety Network criteria [20] and refereed by a third infectious diseases physician (A.-C. U.) in cases of disagreement.
Genomic Analysis
We performed WGS for at least 1 CRE isolate per timepoint from each CRE-positive LT patient. This included multiple CRE colonies (up to 5) per patient isolated simultaneously to estimate the clonal diversity of CRE colonization. We sequenced Ceph-RE isolates if a patient was persistently colonized with a Ceph-RE isolate, had a transition from Ceph-RE to CRE isolates of the same species, or had a colonization event after day 60.
Genomic DNA was extracted from overnight cultures, and index-tagged libraries were generated and sequenced using the HiSeq 2500 and MiSeq instruments (lllumina). We used SRST2 to identify multilocus sequence types (MLSTs) and determine antimicrobial resistance gene profiles including carbapenemase genes [21]. Detection of mcr-1 by SRST2 was confirmed by polymerase chain reaction [22]. Further comparative genomic analysis was conducted on isolates from the same sequence type (ST) that were cultured from >2 patients. Isolates from nonstudy hospitalized patients during the study period were included for genomic context in comparative analyses and were available for Klebsiella pneumoniae clonal complex (CC) 258 (n = 88), K. pneumoniae ST17 (n = 5), and Escherichia coli ST117 (n = 2). Full details of genomic analyses are given in the Supplementary Methods.
Statistical Analysis
The primary outcome was MDRO colonization during the first year post-LT, and the secondary outcome was MDRO infection during the first year post-LT. In univariable analyses, categorical variables were compared using χ2 or Fisher exact tests and continuous variables were compared using Student t test or Mann-Whitney-Wilcoxon test, as appropriate. Covariates with a P value <.05 in univariable analyses were considered for inclusion in multivariable models, which were constructed using stepwise model selection and manually curated. Statistical tests were 2-tailed with a threshold for statistical significance of P < .05. Statistical analyses were performed using SAS (version 9.4) and R (version 3.4.0) software.
RESULTS
We enrolled 142 of 180 patients who underwent LT over the 2-year study period, with 130 completing 1-year follow-up. Of these, 128 provided sufficient fecal samples and were included in the analysis (Supplementary Figure 1). The majority of patients were male (60%) and the median age was 60.4 years (Table 1). Hepatitis C infection was the most common reason for transplant (43%), followed by nonalcoholic fatty liver disease (17%). At time of transplant the median MELD score was 25 (interquartile range [IQR], 17–31), and 48 (38%) patients had hepatocellular carcinoma. During the 12-month follow-up period, 8 (6%) patients died. There were no significant differences between enrolled and nonenrolled patients with respect to demographics, baseline clinical characteristics, MDRO infections, and transplant outcomes (data not shown).
Clinical Characteristics of Cohort (N = 128)
| Characteristic | No. (%) |
|---|---|
| Demographic data | |
| Age, y, median (IQR) | 60.4 (54.8–64.5) |
| Sex, male | 77 (60) |
| UNOS race/ethnicity | |
| White | 74 (58) |
| Hispanic/Latino | 32 (25) |
| Asian | 13 (10.1) |
| Black/African American | 8 (6.2) |
| Multiracial | 1 (0.7) |
| Underlying liver disease | |
| Hepatitis C infection | 49 (38) |
| NAFLD | 18 (14) |
| Autoimmune hepatitis/PSC/PBC | 16 (13) |
| Alcoholic liver disease | 14 (11) |
| Hepatitis B infection | 9 (7) |
| Fulminant hepatic failure | 2 (2) |
| Other | 20 (15) |
| Other comorbidities | |
| Coexisting hepatocellular carcinoma | 48 (38) |
| Diabetes mellitus | 45 (35) |
| BMI at transplant, kg/m2, median (IQR) | 27.7 (23.5–31.0) |
| Transplant characteristics | |
| MELD score at transplant, median (IQR) | 25 (17–31) |
| Child-Turcotte-Pugh score, median (IQR) | 9.5 (7–11) |
| Living donor | 18 (14) |
| Cold ischemic time, min, median (IQR) | 341.5 (259–488) |
| Warm ischemic time, min, median (IQR) | 35 (31–42) |
| PRBC transfusion required | 30 (23) |
| PRBC units transfused, median (IQR) | 5 (1–10) |
| Roux-en-Y | 17 (13) |
| Postoperative complications | |
| Biliary stricture | 17 (13) |
| Bleeding (<14 d) | 31 (24) |
| Renal replacement therapy | 16 (13) |
| Biliary leak | 11 (9) |
| Hepatic artery thrombosis | 2 (2) |
| Graft complication | |
| Any rejection episode | 34 (26) |
| Primary graft failure | 4 (3) |
| Outcome | |
| Days of initial ICU stay, median (IQR) | 4 (2–6) |
| Days of initial hospital stay, median (IQR) | 12 (8–17) |
| 365 day post-LT mortality | 8 (6) |
Data are presented as No. (%) unless otherwise indicated.
Abbreviations: BMI, body mass index; ICU, intensive care unit; IQR, interquartile range; LT, liver transplant; MELD, Model for End-Stage Liver Disease; NAFLD, nonalcoholic fatty liver disease; PBC, primary biliary cirrhosis; PRBC, packed red blood cell; PSC, primary sclerosing cholangitis; UNOS, United Network for Organ Sharing.
MDRO Colonization and Infection
We screened 998 stool samples and 119 rectal swabs (median, 8 [IQR, 4–12] samples per patient). Rectal swabs were taken predominantly in the early posttransplant period and were associated with less MDRO recovery than stool specimens (32/119 [27%] vs 366/998 [37%], respectively, P = .035). MDRO colonization was detected in 86 (67%) patients. This included 25 (20%) patients with CRE, 53 (41%) patients with Ceph-RE, and 66 (52%) with VRE. Approximately half of MDRO-colonized patients (42/86 [48%]) harbored >1 class of MDRO.
In the cohort, 23 of 97 (23%) bacterial infection episodes were due to MDRO (Supplementary Table 1). Five CRE infections occurred in 3 patients, 13 Ceph-RE infections in 10 patients, and 8 VRE infections in 8 patients. MDRO infections were most frequently intra-abdominal (53%) and urinary tract infections (30%). Three intra-abdominal infections (caused by VRE, Ceph-RE, and VRE/CRE, respectively) were complicated by bacteremia, and 1 patient died.
MDRO-colonized patients vs noncolonized patients were significantly more likely to develop subsequent infection for all 3 categories of MDRO (CRE: 3/25 vs 0/103, P = .007; Ceph-RE: 9/52 vs 1/76, P = .001; and VRE: 8/66 vs 0/62, P = .006). Infection occurred a median of 31 days after colonization for CRE, 71 days for Ceph-RE, and 17.5 days for VRE. One patient had infection with Ceph-RE without prior detection of colonization.
Clinical Factors Associated With MDRO Colonization and Infection
Univariable and multivariable analyses of clinical factors associated with MDRO colonization and infection are shown in Supplementary Tables 2 and 3. MDRO-colonized patients, compared with noncolonized patients, had significantly higher CTP scores (P = .0004) and were more likely than noncolonized patients to have postoperative complications including prolonged mechanical ventilation (P = .003), bleeding (P = .002), need for reoperation (P = .04), prolonged postoperative hospital stays (P = .0002), and rehospitalization (P = .002) (Supplementary Table 2). In a multivariable model, CTP score (odds ratio [OR], 1.3 [95% confidence interval {CI}, 1.1–1.6], P = .002) and duration of posttransplant hospitalization (OR, 1.1 [95% CI, 1.0–1.2], P = .009) were independently associated with MDRO colonization (Supplementary Table 3). Patients with MDRO infection similarly had higher CTP scores (P = .003), and MDRO infection was associated with postoperative complications (Supplementary Table 2). Overall, MDRO colonization was significantly associated with subsequent MDRO infection (100% vs 62%, P = .002). Multivariable analysis identified CTP score (OR, 1.5 [95% CI, 1.1–2.0], P = .01), bleeding complications (OR, 7.5 [95% CI, 2.2–25.1], P = .001), and need for rehospitalization (OR, 11.1 [95% CI, 1.3–98.2], P = .03) as independent predictors of MDRO infection (Supplementary Table 3). MDRO colonization could not be included in this model due to failure to converge.
Dynamics of MDRO Colonization Posttransplant and Relationship to Infection
At time of transplant, fewer patients were colonized with CRE compared with Ceph-RE and VRE (2% vs 14% and 29%, respectively, P < .001). CRE colonization was detected a median of 24 (IQR, 11–42) days post-LT vs 7 (IQR, 0–86) days for Ceph-RE and 0.5 (IQR, –3 to 19) days for VRE (overall P = .05; Figure 1). However, a greater proportion of Ceph-RE initial or recurrent colonization occurred after day 60 (22/53 [42%] vs 7/25 [28%] for CRE and 8/66 [12%] for VRE, P = .0012). While all patients with late CRE colonization (7/7) had recently been hospitalized, had invasive procedures, or had new antibiotic use, patients with late Ceph-RE colonization were less frequently hospitalized in the previous 30 days (12/22 [55%], P = .045).
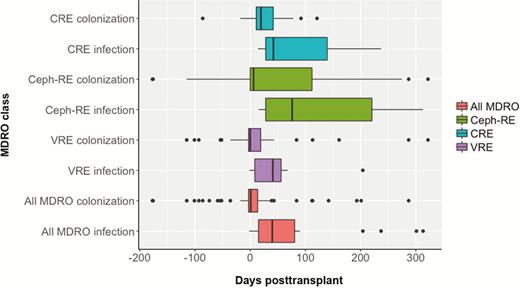
Timing of multidrug-resistant organism (MDRO) colonization and infection by organism class. Timing of first colonization and infection between different MDRO classes, as well as for all MDROs as a combined category, were plotted. Differences were noted between MDRO classes as well as between colonization and infection for individual MDRO classes. Abbreviations: Ceph-RE, Enterobacteriaceae resistant to third-generation cephalosporins; CRE, carbapenem-resistant Enterobacteriaceae; VRE, vancomycin-resistant enterococci.
Most patients cleared MDRO colonization (CRE: 15/18 [83%]; Ceph-RE: 24/34 [71%]; and VRE: 38/46 [83%]). Median times to clearance are shown in Table 2 and ranged from 22 to 58 days. However, 9 of 15 patients with CRE colonization achieved clearance through reversion from CRE to a Ceph-RE phenotype of the same species. Colonization persistence was not associated with infection (CRE: 2/3 [67%] patients, P = .07; Ceph-RE: 3/10 [30%] patients, P = .34; VRE: 2/8 patients [25%], P = .59). Colonization recurrence occurred in 7%–25% of patients (Table 2).
Colonization Trajectory by Multidrug-Resistant Organism Class
| Colonization Trajectory | CRE | Ceph-RE | VRE | P Value |
|---|---|---|---|---|
| Time to first colonization, d, median (IQR) | 24 (11–42) | 7 (0–86) | 0.5 (–3 to 19) | .05 |
| Persistence | 3/18 (17) | 10/34 (29) | 8/46 (17) | |
| Clearance | 15/18 (83) | 24/34 (71) | 38/46 (83) | .42 |
| Time for clearance, d, median (IQR) | 22 (8–65) | 53 (12.5–143.2) | 36.5 (14–79.8) | .069 |
| Colonization recurrence | 1/15 (7) | 8/24 (25) | 5/38 (13) | .098 |
| Colonization episode after day 60 (patients) | 7/25 (28) | 22/53 (42) | 8/66 (12) | .0012 |
| Hospitalization in previous 30 d | 7/7 (100) | 12/22 (55) | 7/8 (88) | .045 |
| Invasive procedure in previous 30 d | 7/7 (100) | 15/22 (68) | 5/8 (63) | .22 |
| New antibiotic use in previous 30 d | 7/7 (100) | 11/22 (50) | 5/8 (63) | .062 |
Data are presented as no./No. (%) unless otherwise indicated.
Abbreviations: Ceph-RE, Enterobacteriaceae resistant to third-generation cephalosporins; CRE, carbapenem-resistant Enterobacteriaceae; IQR, interquartile range; VRE, vancomycin-resistant enterococci.
Genomic Epidemiology of Gram-Negative Isolates
We sequenced 95 CRE, including 80 colonizing and 15 infectious isolates. Fifty-seven were K. pneumoniae, 20 E. coli, 15 Enterobacter cloacae complex, 2 Citrobacter freundii, and 1 Klebsiella oxytoca. Through comparative genomic analyses within each species and ST, we identified 26 CRE clades. Klebsiella pneumoniae ST258 was the most common (39%), followed by E. cloacae complex ST252 (8%), K. pneumoniae ST17 (7%), and K. pneumoniae ST307 (5%) (Figure 2). We detected BlaKPC-encoded carbapenemases in 63 of the 96 (66%) isolates, which was presumed to be the most frequent mechanism of carbapenem resistance. We found BlaKPC in all CRE infection isolates, and 3 of 9 patients colonized with carbapenemase-producing CRE (CP-CRE) developed infection, compared with 0 of 16 patients with non–CP-CRE colonization (P = .037). Preceding or concurrent colonizing CRE isolates were the same ST as CRE infection isolates. However, 7 patients had colonization with multiple CREs (7/25 [28%]) as indicated by species and ST, including 1 patient colonized with at least 7 different CREs (K. pneumoniae ST17, ST34, and ST258; E. cloacae complex ST252 and ST454; E. coli ST167 and ST2585). Isolates from this patient had 3 different possible mechanisms of carbapenem resistance (blaKPC-2, blaKPC-3, and carbapenemase-negative).
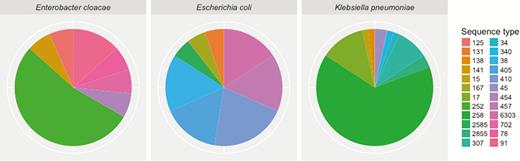
Multilocus sequence types of common carbapenem-resistant Enterobacteriaceae species. Carbapenem-resistant Enterobacteriaceae isolates were categorized by species, then sequence type, showing a diversity of carbapenem-resistant Enterobacteriaceae clades.
Genomic comparisons of Ceph-RE (n = 40) and CRE isolates showed complex relationships. Nine patients demonstrated intraspecies transition from Ceph-RE to CRE. For 6 of 8 patients with serial isolates available, CRE was of the same ST as the preceding Ceph-RE isolate and in 5 of 6 patients was non-CP CRE. However, CRE to Ceph-RE transition was associated with a change in ST of the Ceph-RE isolate in 5 of 9 patients. Analysis of isolates causing colonization persistence showed persistence of the same ST in 2 of 3 patients with CRE and 9 of 10 Ceph-RE.
We then used comparative genomics to assess relatedness between isolates of the same clonal background (Table 3). The analysis for K. pneumoniae CC258 indicated that median pairwise single-nucleotide polymorphism (SNP) distance was 1 (range, 0–7) between isolates occurring within single patients, compared with 381 (range, 0–2066) between isolates from different patients. We applied the maximum pairwise SNP distance within individual patients as a cutoff for putative transmission clusters between patients. We identified 11 clusters of closely related isolates shared by at least 2 patients. Five clusters involved LT patients, including 4 clusters containing colonizing isolates and 1 cluster containing isolates resulting from infections in LT patients (Supplementary Figure 2). No cluster was limited to LT patients. Likewise, K. pneumoniae ST17 isolates were similar between LT and non-LT patients. With the exception of K. pneumoniae ST307, all analyses also showed evidence of interpatient transmission.
Comparative Genomic Analysis of Carbapenem-Resistant Enterobacteriaceae and Enterobacteriaceae Resistant to Third-Generation Cephalosporin Isolates of the Same Clonal Background
| Species and MLST | Reference | Accession | No. of Study Patient Isolates | No. of Nonstudy Isolates | Median Within-Patient Pairwise SNP Distance (Range) | Median Between-Patient Pairwise SNP Distance (Range) | Susceptibility Phenotype |
|---|---|---|---|---|---|---|---|
| Klebsiella pneumoniae ST258 | NJST258_1 | CP006923.1 | 22 | 88 | 1 (0–7) | 381 (0–2066) | CRE only |
| K. pneumoniae ST17 | MGH_60 | NZ_JMYY00000000.1 | 8 | 5 | 44 (10–92) | 2078.5 (90–2244) | CRE and Ceph-RE |
| K. pneumoniae ST307 | KPN11 | NZ_CTN01000001.1 | 5 | 0 | 4–35 | 64–201 | CRE only |
| Escherichia coli ST117 | MDR_56 | CP019903.1 | 4 | 2 | 3–17 | 14 (7–24) | Ceph-RE only |
| E. coli ST131 | JJ1886 | CP006784.1 | 9 | 0 | 49 (2–96) | 80 (21–234) | CRE and Ceph-RE |
| E. coli ST405 | BIDMC106 | GCA_001030595.1 | 7 | 0 | 2 (2–4) | 117.5 (5–972) | CRE and Ceph-RE |
Abbreviations: Ceph-RE, Enterobacteriaceae resistant to third-generation cephalosporins; CRE, carbapenem-resistant Enterobacteriaceae; MLST, multilocus sequence type; SNP, single-nucleotide polymorphism; ST, sequence type.
An unexpected finding was the detection of mcr-1 in Ceph-RE E. coli isolates from 3 patients, all of whom were noted to have a new Ceph-RE colonization event >60 days posttransplant. The isolates were E. coli ST117, as was a previously reported mcr-1–producing case [23]. Comparative analyses found a high level of relatedness between the isolates (3–24 SNPs).
DISCUSSION
In this prospective longitudinal cohort of LT patients, we identified high rates of MDRO colonization (67%) and significant association between MDRO colonization and subsequent infection. Using a combination of active surveillance and WGS, we demonstrated unexpected heterogeneity of CRE colonizing isolates, previously unrecognized transmission spanning Ceph-RE and CRE phenotypes, and a cluster of mcr-1–producing isolates. This approach allowed us to characterize temporal dynamics of MDRO colonization, revealing differences in onset of colonization, clearance, and infections between the different MDROs and complex relationships between Ceph-RE and CRE colonization.
We detected MDRO colonization in 67% of patients during the 1-year study period. Consistent with previous literature, MDRO colonization was associated with subsequent infection [8, 24–26]. Posttransplant complications (including need for reoperation and prolonged hospital stays) were associated both with MDRO colonization and infection, suggesting that in-hospital acquisition of MDRO in the early posttransplant period played an important role. This was particularly true for VRE, with a median time to first colonization of 0.5 days. However, Ceph-RE colonization often occurred after day 60 and was not associated with healthcare exposure, raising the possibility of community- rather than healthcare-associated acquisition [27].
The high MDRO colonization burden noted in our study may be partially explained by active surveillance. Without surveillance, many colonization events would have been undetected despite serving as drivers for MDRO transmission. For example, our data suggest that for every CRE-infected patient, approximately 7 others are colonized with CRE, with similar ratios for Ceph-RE (1:4) and VRE (1:7). This previously occult MDRO colonization has important infection control implications, as illustrated by the cluster of mcr-1–producing E. coli isolates: All were colonizing isolates with possible silent transmission.
Active surveillance and WGS provided a high-resolution viewpoint on MDRO colonization dynamics. Despite previous attempts to define its duration [10–15], MDRO colonization does not appear to be a simple “on–off” phenomenon. Patients follow complex trajectories (Figure 3). In select cases, phenotypic findings suggested persistent colonization, but WGS revealed a change in colonizing organism ST. Conversely, WGS demonstrated that isolates phenotypically classified as CRE and Ceph-RE were in fact related. These findings can inform infection control interventions by detecting new transmission events and excluding others due to within-host evolution (eg, change from Ceph-RE to CRE).
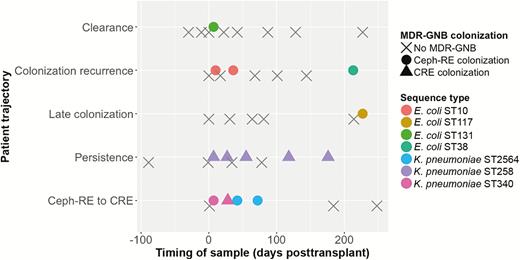
Schematic figure of dynamics of multidrug-resistant organism (MDRO) colonization. MDRO colonization has complex dynamics, with patients following different trajectories. In this schematic figure, 5 patients with typical colonization trajectories are shown. In the first example, the patient had rapid clearance after early posttransplant colonization with Enterobacteriaceae resistant to third-generation cephalosporins (Ceph-RE). In the second example, the patient clearance of initial colonization with Escherichia coli sequence type (ST) 10 but subsequent recolonization with E. coli ST38. The third example is of late colonization, in this case with mcr-1–producing E. coli ST117, likely due to healthcare-associated transmission. The fourth example shows a patient persistently colonized with Klebsiella pneumoniae ST258. The final example shows a patient colonized with Ceph-RE K. pneumoniae ST340, with transition to colonization with carbapenem-resistant Enterobacteriaceae K. pneumoniae ST340. Reversion to Ceph-RE colonization is associated with a change in sequence type to K. pneumoniae ST2564. Abbreviations: CRE, carbapenem-resistant Enterobacteriaceae; MDR-GNB, multidrug-resistant gram-negative bacteria.
Pathogen-related factors detected by WGS may help predict future infection and allow us to prioritize therapeutic interventions for MDRO colonization [28, 29]. In our study, detection of carbapenemase genes was one such factor. CRE infection developed in 33% of patients colonized with CP-CRE but in none with non–CP-CRE colonization only. These findings are in keeping with previously reported CRE infection rates from CP-CRE outbreak settings [7, 8] and with recent literature suggesting that patient outcomes differ between CP-CRE and non–CP-CRE infections [30].
Our WGS data demonstrated an unexpected diversity of multidrug-resistant gram-negative bacteria isolates, particularly CRE. While the most common CRE clone was K. pneumoniae ST258, consistent with US epidemiologic studies [31–33], we noted multiple non-ST258 K. pneumoniae clonal types including the emerging ST307 clone [34]. Enterobacter species were also prominent and are an increasingly recognized cause of CRE infections [35]. This diversity of CRE isolates supports CRE endemicity rather than detection within outbreak settings reported previously [36–38]. Through WGS, we noted that approximately 25% of CRE-colonized patients had multiple CRE clones. The presence of diverse mechanisms of carbapenem resistance in several patients suggests repeated and independent acquisitions of CREs. This finding underscores the high exposure of SOT recipients to MDRO colonization, both by virtue of their immunosuppressed state and through repeated healthcare-associated exposures.
Our analyses of isolates sharing the same ST showed several instances of horizontal transmission between patients. This relationship between liver transplant recipients and other hospital patients highlights the possibility of common modes of transmission. Three of 6 analyses included isolates that were CRE and Ceph-RE, demonstrating the continuum between the 2 categories. Our genomic data therefore highlighted the limitations of using susceptibility phenotypes to investigate isolate relatedness and possible horizontal transmission.
Several challenges for use of active surveillance and WGS in clinical practice remain. Despite their lower MDRO detection rate, use of rectal swabs may be an appropriate compromise to improve sample collection. Our center currently collects rectal swabs on all LT patients immediately following their transplant surgery. Isolation precautions are applied according to CDC guidelines [39]. Currently, we do not systematically collect samples at other time points; however, it would be feasible to collect rectal swabs during regular outpatient follow-up that recipients receive as standard care. The second challenge is use of WGS, both due to cost and technical feasibility. This challenge is part of a broader discussion of how genomic data should be integrated into clinical management of infectious diseases [40]. We are hopeful that with the decreasing cost of sequencing and increased availability of automated analysis platforms, WGS will be integrated into clinical care in the foreseeable future. Our study shows the possible advantages of having these data.
Our study had several limitations. First, our data came from a single center with a focus on one patient population. However, the data were collected prospectively over several years and for parts of our analysis we conducted comparisons with the broader hospital. We also faced significant challenges in conducting a real-world study involving many patients over such a long duration. Approximately 30% of patients receiving transplants during the study period were not enrolled. During the course of our study, there were disparities in the completeness of longitudinal stool sampling between patients. Our study relied on traditional culture methods for initial MDRO detection and may not have detected isolates present in low concentrations. Conversely, to minimize the impact of possible false negatives, we therefore defined clearance only when 2 samples were negative. Last, due to logistical constraints, our efforts at WGS were limited to CRE and selected gram-negative isolates.
In conclusion, MDRO colonization is a highly dynamic and complex process after LT. However, better understanding of MDRO colonization may allow us to make more precise decisions for our patients. Possible advances include identifying patients at risk of infection who would benefit from therapeutic decolonization through fecal microbiota transplantation, tailoring isolation precautions by identifying patients who truly present MDRO transmission risks, and limiting antimicrobial use to patients suspected of having developed infection. It is only through acknowledging the protean nature of MDRO colonization and infection using novel tools such as WGS that we can effectively understand and combat the spread of antimicrobial resistance and improve patient outcomes.
Supplementary Data
Supplementary materials are available at Clinical Infectious Diseases online. Consisting of data provided by the authors to benefit the reader, the posted materials are not copyedited and are the sole responsibility of the authors, so questions or comments should be addressed to the corresponding author.
Notes
Acknowledgments. We thank the team of the curators of the Institut Pasteur multilocus sequence types system (Paris, France) for importing novel profiles at http://bigsdb.web.pasteur.fr.
Financial support. This work was supported by the National Institute of Allergy and Infectious Diseases, National Institutes of Health (grant numbers AI116939 to A.-C. U., S1-AI116939 to A.-C. U. and A. G. S., and 5T32AI100852 to A. G. S.) and the Irving Scholarship from Columbia University (to A.-C. U.).
Potential conflicts of interest. A.-C. U. has received funding from Merck. All other authors report no potential conflicts of interest. All authors have submitted the ICMJE Form for Disclosure of Potential Conflicts of Interest. Conflicts that the editors consider relevant to the content of the manuscript have been disclosed.
References
Author notes
Present affiliation: NEXUS Personalized Health Technologies, ETH Zürich, and Swiss Institute of Bioinformatics, Zurich, Switzerland.

