


Abstract
Carbapenem-resistant Enterobacteriaceae (CRE) are high-priority bacterial pathogens targeted for efforts to decrease transmissions and infections in healthcare facilities. Some regions have experienced CRE outbreaks that were likely amplified by frequent transmission in long-term acute care hospitals (LTACHs). Planning and funding of intervention efforts focused on LTACHs is one proposed strategy to contain outbreaks; however, the potential regional benefits of such efforts are unclear.
We designed an agent-based simulation model of patients in a regional network of 10 healthcare facilities including 1 LTACH, 3 short-stay acute care hospitals (ACHs), and 6 nursing homes (NHs). The model was calibrated to achieve realistic patient flow and CRE transmission and detection rates. We then simulated the initiation of an entirely LTACH-focused intervention in a previously CRE-free region, including active surveillance for CRE carriers and enhanced isolation of identified carriers.
When initiating the intervention at the first clinical CRE detection in the LTACH, cumulative CRE transmissions over 5 years across all 10 facilities were reduced by 79%–93% compared to no-intervention simulations. This result was robust to changing assumptions for transmission within non-LTACH facilities and flow of patients from the LTACH. Delaying the intervention until the 20th CRE detection resulted in substantial delays in achieving optimal regional prevalence, while still reducing transmissions by 60%–79% over 5 years.
Focusing intervention efforts on LTACHs is potentially a highly efficient strategy for reducing CRE transmissions across an entire region, particularly when implemented as early as possible in an emerging outbreak.
Carbapenem-resistant Enterobacteriaceae (CRE) are among selected bacteria of international concern [1], and were classified as an urgent antibiotic resistance threat in the United States [2]. Rising CRE incidence among patients in US healthcare facilities has been documented in recent years [3, 4]. Some regions in the United States have experienced rapid spread of CRE within local networks of healthcare facilities [5, 6]. Other areas of the United States have reported only sporadic CRE cases [7] but may be vulnerable to new regional outbreaks, particularly if healthcare systems do not react to emerging cases in a prompt, coordinated manner [8, 9]. Efforts to prevent new localized outbreaks may be crucial for successfully meeting the US government’s stated target of 60% reduction in hospital-acquired CRE infections by 2020 compared to 2011 [10].
Long-term acute care hospitals (LTACHs) are particularly vulnerable to CRE outbreaks [4] and might amplify region-wide transmission [5, 11–14]. LTACH patients spend longer time at risk of exposure, with average length of stay (LOS) >25 days, compared to 5–6 days for short-stay acute care hospital (ACH) patients, and often spent substantial time as ACH inpatients before LTACH admission [15]. They also typically have multiple comorbidities and require complex medical care, including high rates of exposure to invasive devices and multiple antibiotics. These characteristics all likely correlate with both a higher likelihood of importing CRE and higher susceptibility to acquiring sustained CRE colonization after exposure [16].
Interventions have effectively reduced CRE transmission using active surveillance to identify CRE carriers and improved use of contact precautions [17, 18]. These and other interventions are expensive; efficient use of resources to optimize their effect could alleviate financial barriers to reducing outbreak risk. Coordinating efforts among facilities exchanging patients can increase efficiency [8, 9], but systemic barriers and added costs may inhibit interfacility communication and streamlined record keeping required by such strategies. Given the importance of LTACHs in regional CRE outbreaks, we hypothesized that a completely LTACH-focused intervention would efficiently reduce region-wide CRE transmission without requiring coordination efforts.
Interventions in Chicago-area LTACHs successfully reduced CRE prevalence in the target facilities [18], but regional effects of those efforts were not investigated. Furthermore, those interventions were initiated well after CRE had spread extensively throughout the LTACHs and surrounding region. We used our model to test the effects of LTACH-focused interventions on a 10-facility network consisting of an LTACH, ACHs, and nursing homes (NHs) when implemented in the early and later stages of an emerging CRE outbreak.
METHODS
Single Long-term Acute Care Hospital Model
We first developed an agent-based model for CRE spread in a single LTACH, to estimate realistic transmission, clinical detection, and intervention effectiveness parameters based on data from LTACH facilities in a CRE outbreak region [18]. We assumed an average facility population of 75 patients, randomly admitted at a constant rate with 20.6% CRE importation prevalence [18]. Patient LOS was randomly distributed based on data from the Centers for Medicare and Medicaid Services for all fee-for-service beneficiary LTACH stays in the United States in 2012 (Supplementary Materials).
We modeled clearance of colonization and clinical detection of CRE-colonized patients, each using a constant rate parameter. We assumed average time to clearance of 387 days [19], and estimated the clinical detection rate in simulation testing described below. We assumed that transmissions among nonisolated susceptible and infectious inpatients occur with rate , where and are the number of susceptible and infectious patients in the facility. Clinically detected patients were assumed to be isolated and contributed 50% less to the transmission rate [20]. The transmission rate parameter was estimated along with the clinical detection rate to achieve simulated equilibrium LTACH prevalence (45.8%) and clinical detection incidence (3.7 per 1000 patient days) observed in the study [18].
We then simulated an intervention including 2 components: active surveillance and enhanced isolation. With active surveillance, each patient was tested for CRE carriage at admission with 91.1% adherence and biweekly during the LTACH stay with 95.4% adherence [18]. Tests of carriers were positive with 80% probability [21, 22]. Those testing positive were immediately isolated, as for clinical detections. With enhanced isolation, patients contributed 75% less to the transmission rate, compared to 50% with standard isolation, based on observed pre- vs post-intervention adherence to contact precautions and hand hygiene in CRE-positive patient rooms [20] (Supplementary Materials). We compared our results against the observed prevalence decrease in the intervention study after 1 year [18].
Regional Model
We then placed our LTACH model within a regional model of CRE spread in a generic set of facilities. Our goal was to produce generalizable insights about the consequences of regional patient flow patterns, rather than represent a specific real-world location. Our model included 10 facilities: the LTACH, 3 ACHs averaging 100 or 150 patients each, and 6 NHs averaging 60 or 90 residents each (Figure 1).
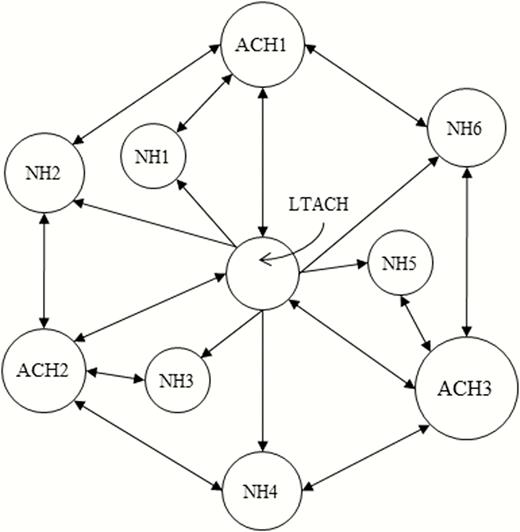
Facility network. Area of each circle is proportional to the average patient/resident population of the facility. Outgoing arrows from each facility refer to the facilities that receive most (but not necessarily all) of the transfer patients out of the facility. All facilities also discharge patients to the community, and all facilities admit patients from the community except for the long-term acute care hospital, which only admits transfer patients from the short-stay acute care hospitals. Abbreviations: ACH, short-stay acute care hospital; LTACH, long-term acute care hospital; NH, nursing home.
We formulated sophisticated assumptions for transfers, readmissions, and LOS (Table 1), which accounted for dependence between where individuals are admitted from and where they are discharged to. We used data from all ACHs and NHs in the US Veterans Health Administration to estimate conditional distributions of discharge and readmission destinations and LOS in each facility type and the community between multiple stays. We assumed all LTACH admissions were direct transfers from an ACH, with the fraction of ACH patients transferred to the LTACH and LOS in ACH prior to LTACH transfer calibrated to US data [15]. For LTACH discharges, we assumed destination probabilities consistent with 2013 Arkansas data [23]. We distributed interfacility transfers across the 10-facility network with connections shown in Figure 1 preferentially weighted (Supplementary Materials).
Model Assumptions for Location Transition Probabilities and Mean Length of Stay
| Previous Location | Current Location | Next Destination Transition Probability, %; Mean LOS, d | ||||
|---|---|---|---|---|---|---|
| Community | LTACH | ACH | NH | None | ||
| ACH | LTACH | 45.0; 27.1 | … | 6.0; 27.1 | 49.0; 27.1 | … |
| Community | ACH | 90.7 (43.2a); 4.8 | 4.3 (27.9a); 14.6 | 0.6 (0.3a); 8.2 | 4.4 (28.6a); 11.3 | … |
| LTACH | ACH | 75.5; 8.4 | 12.1; 14.6 | 1.3; 11.5 | 11.0; 11.4 | … |
| ACH | ACH | 66.9; 8.4 | 9.2; 14.6 | 12.8; 11.5 | 11.0; 11.4 | … |
| NH | ACH | 11.9; 11.9 | 6.9; 14.6 | 1.0; 8.2 | 80.1; 6.6 | … |
| Community | NH | 87.0; 41.3 | … | 12.5; 99.4 | 0.4; 124.8 | … |
| ACH/LTACH | NH | 71.4; 50.2 | … | 27.9; 70.1 | 0.6; 64.2 | … |
| NH | NH | 71.3; 162.8 | … | 22.4; 208.9 | 6.2; 37.2 | … |
| ACH/LTACH | Community | … | … | 67.0 (73.7a); 897 | 1.1 (1.2a); 598 | 31.9 (25.1a) |
| NH | Community | … | … | 16.8 (19.4a); 845 | 35.9 (41.5a); 351 | 47.3 (39.1a) |
Abbreviations: ACH, short-stay acute care hospital; LOS, length of stay; LTACH, long-term acute care hospital; NH, nursing home.
aNext destination transition probability (%) applied to patients with clinical carbapenem-resistant Enterobacteriaceae detection during current location stay; those patients are assumed to be more likely to be transferred to a long-term care facility (LTACH or NH) from an ACH when admitted from the community, and more likely to be readmitted after being discharged to the community.
Patients admitted to an ACH from the community and clinically detected with CRE during their stay had 13.7 times greater odds of transfer to the LTACH or a NH compared to others admitted from the community [24]. Also, individuals clinically detected with CRE in any facility and subsequently discharged into the community had 40% greater odds of readmission, based on data from patients clinically detected with methicillin-resistant Staphylococcus aureus (MRSA) [25].
The LTACH in the regional model used assumptions and results from our single-LTACH model, except CRE importation was governed by prevalence among ACH-to-LTACH transfers. Clinical detections in ACHs and NHs triggered isolation and decreased transmission as described for the LTACH, but occurred at a slower rate based on data from tracked surveillance-identified carriers (Supplementary Materials) [26, 27]. Isolated patients transferred to another facility were isolated at the new facility with 50% probability [28], and those readmitted to the same facility after an uninterrupted community stay were reisolated with 75% probability.
CRE transmission rates in ACH and NH are informed by prevalence data; estimates ranged from 1.9% to 7.1% for groups of ACH patients [11, 29–31] and 6.5% to 27.3% for residents of different types of non-LTACH long-term-care facilities [32, 33] (Supplementary Materials). Estimating transmission rates to capture these ranges in the regional model is complicated by the fact that each facility transmission rate affects prevalence in other facilities through interfacility transfer. In particular, the ACH transmission rate strongly affects importation to and thus prevalence in the LTACH. Therefore, we also tested how ACH and NH transmission rates affected LTACH prevalence, compared against observed LTACH prevalence range of 10%–54% in CRE outbreak regions [11, 18, 33, 34].
In addition to capturing absolute prevalence ranges, we also attempted to reproduce similar ratios between average LTACH prevalence (30.3%) and average ACH prevalence (3.3% in ICUs) observed in Chicago [11]. The high LTACH prevalence was partly caused by high importation (20.6% in a subset of those LTACHs [18]). Our model could not produce a similarly high LTACH importation rate from low-prevalence ACHs until we added an additional model feature: that ACH patients destined for LTACH transfer have higher CRE acquisition susceptibility than other ACH patients, a plausible assumption considering that characteristics of patients requiring LTACH transfer also correlate with CRE carriage risk [11, 16]. In all, we chose ranges for 3 transmission parameters (Table 2): NH transmission rate, ACH transmission rate (averaged over pre-LTACH and other patients), and relative increased acquisition rate for pre-LTACH ACH patients compared to other ACH patients. For this last parameter, we chose values of 2 and 10 as a reasonable range for the magnitude of increased acquisition risk (Supplementary Materials). Then we chose ranges for the ACH and NH transmission parameters by constraining their values to achieve high-end prevalence results for all 3 facility types when the 3 parameters were each at their high values, and low-end results when the 3 parameters were each at their low values (Table 3).
Carbapenem-Resistant Enterobacteriaceae Model Parameter Values
| Parameter | Assumed Value(s) | Source |
|---|---|---|
| LTACH transmission parameter | 0.0615a | [18] |
| ACH transmission parameter | 0.0615 (high) or 0.04 (low)a | [11, 29–31] |
| ACH acquisition risk factor for pre-LTACH patients | 10 (high) or 2 (low) | Assumed |
| NH transmission parameter | 1/7 (high) or 1/10 (low) ACH valuea | [32, 33] |
| LTACH clinical detection rate | 1/106 daysa | [18] |
| ACH clinical detection rate | 1/122 daysa | [26] |
| NH clinical detection rate | 1/8 ACH value | Assumed |
| Clearance rate | 1/387 days | [19] |
| Reduction in transmission rate from detected patients | 50% (75% enhanced) | [20] |
| Surveillance test sensitivity | 80% | [21, 22] |
| Probability of retaining CRE-positive detection status after direct interfacility transfer | 50% | [28] |
| Probability of retaining CRE-positive detection status after readmission to same facility after community stay | 75% | Assumed |
| Readmission odds increase for those clinically detected with CRE and discharged to community | 1.4b | [25] |
| Transfer to long-term care odds increase for those clinically detected with CRE in ACH after community admission | 13.7 | [24] |
Abbreviations: ACH, short-stay acute care hospital; CRE, carbapenem-resistant Enterobacteriaceae; LTACH, long-term acute care hospital; NH, nursing home.
aParameter value(s) calibrated to achieve results in cited work.
bResult in cited work was for methicillin-resistant Staphylococcus aureus.
Simulation Results for Different Parameter Combinations
| Transmission Rate Assumptionsa | Average CRE Prevalence at 5 y, % | Intervention Effectb | Chosen Modelsc | ||||
|---|---|---|---|---|---|---|---|
| ACH (Pre-LTACH) | ACH (Overall) | NH | LTACH | ACH | NH | ||
| High | High | High | 49 | 6.5 | 28 | −79% | Model A |
| High | High | Low | 46 | 5.7 | 21 | −84% | |
| High | Low | High | 30 | 2.8 | 13 | −92% | |
| High | Low | Low | 27 | 2.5 | 10 | −93% | Model B |
| Low | High | High | 32 | 5.0 | 22 | −87% | |
| Low | High | Low | 28 | 4.0 | 15 | −89% | |
| Low | Low | High | 14 | 1.5 | 7 | −90% | |
| Low | Low | Low | 13 | 1.2 | 5 | −90% | |
Abbreviations: ACH, short-stay acute care hospital; CRE, carbapenem-resistant Enterobacteriaceae; LTACH, long-term acute care hospital; NH, nursing home.
aHigh and low values of each parameter are described in Table 2.
bThe intervention effect was defined as the reduction in average total regional CRE transmissions over 5 years when the 2-component intervention was initiated at the first clinical CRE detection in the LTACH, compared to the result for the corresponding set of no-intervention simulations.
cChosen models for further analysis: those producing the least (model A) and greatest (model B) intervention effect.
Patients discharged to the community were tracked only when scheduled for readmission during the simulation. We modeled colonization clearance events in the community, but not acquisitions or clinical detections. To model CRE invasion into the region, we randomly assigned undetected carrier status at initial facility admission. The first new regional admission during the CRE invasion phase was designated a carrier, and subsequent new admissions were carriers with probability 0.0014, which led to an average interval of 31 days between regional importations.
We simulated the intervention described for the single-LTACH model within the regional model at the LTACH only, but inpatients were tested for carriage weekly rather than biweekly, and the intervention was initiated after the first clinical CRE detection in the LTACH. For each of the 8 combinations of the 3 high/low values of facility transmission parameters, we calculated the reduction in average total CRE transmissions compared to the corresponding no-intervention simulations. We chose 2 of the 8 models for more detailed analysis: those producing the smallest (model A) and largest (model B) intervention effect. For models A and B, we ran sensitivity tests in which each of the 2 intervention components was activated individually, the patient flow patterns from the LTACH were changed (Supplementary Table 3), and the initiation of the intervention was delayed until the fifth, 10th, or 20th CRE detection in the LTACH. Regional simulation results are each reported as the average of 1000 stochastic model runs.
RESULTS
Our single-LTACH model produced estimates for the LTACH transmission parameter (0.0615) and clinical detection rate (1/106 days). Our interventions results were similar to data from the modeled study [18]; where they observed a decrease in average prevalence to 34% postintervention, our model produced an average decrease to 29%–35% (Supplementary Materials).
We ran our regional model using the 8 possible combinations of high and low values for the 3 parameters characterizing CRE transmission in non-LTACH facilities, producing average 5-year CRE prevalence results across ranges of published data from outbreak regions. Intervention effects (reduced average 5-year total transmissions) ranged from 79% to 93%. We chose the 2 parameter sets producing the least and greatest intervention effects for additional analyses (Table 3).
Model A used high-end transmission rates in ACHs and NHs and correspondingly produced LTACH, ACH, and NH prevalence near the maximum observed for each facility type. Regional prevalence (fraction of individuals in all facilities carrying CRE) averaged 21% 5 years after initial introduction, and about 3700 cumulative CRE transmissions occurred within all facilities, on average. With the intervention, average regional prevalence was 6% after 5 years, and total transmissions decreased by 79%, with substantial reductions in all 3 facility types (Table 4). Model B used lower transmission rates in ACHs and NHs and produced average LTACH, ACH, and NH CRE prevalence of 27%, 2.5%, and 10% without intervention, which together are close to the set of values observed in Chicago [11, 33]. The intervention reduced average 5-year regional prevalence from 9% to 0.5% and total transmissions by 93% (Table 4).
Detailed Results for Chosen Models
| Model A | Model B | |||||
|---|---|---|---|---|---|---|
| No Intervention Average (90% VI) | Intervention Average (90% VI) | Average Effect | No Intervention Average (90% VI) | Intervention Average (90% VI) | Average Effect | |
| Prevalence at 5 y, % | ||||||
| Region | 21 (18–25) | 6.1 (1.3–11) | −71% | 8.7 (5.1–12) | 0.5 (0–1.4) | −94% |
| LTACH | 49 (36–62) | 12 (1.2–24) | −77% | 27 (12–43) | 1.4 (0–6.0) | −95% |
| ACH | 6.5 (3.9–9.5) | 2.0 (0.3–4.4) | −70% | 2.5 (0.7–4.4) | 0.2 (0–0.9) | −91% |
| NH | 28 (23–33) | 8.3 (1.8–15) | −70% | 10 (6.2–14) | 0.6 (0–1.7) | −94% |
| 5-y total transmissions | ||||||
| Region | 3749 (2571–4550) | 794 (214–1479) | −79% | 1533 (613–2233) | 113 (41–219) | −93% |
| LTACH | 1511 (1079–1798) | 189 (51–342) | −88% | 1022 (422–1452) | 44 (11–96) | −96% |
| ACH | 1363 (872–1748) | 370 (104–693) | −73% | 347 (126–537) | 54 (22–99) | −84% |
| NH | 876 (580–1080) | 236 (54–462) | −73% | 163 (51–253) | 14 (3–31) | −92% |
Averages results of 1000 simulations; 90% VI gives the 5th and 95th percentile result of the 1000 simulation runs. Average effect is the percentage decrease for the intervention average compared to the no-intervention average.
Abbreviations: ACH, short-stay acute care hospital; LTACH, long-term acute care hospital; NH, nursing home; VI, variability interval.
Active surveillance decreased transmissions by 52% and 83% for model A and model B, respectively, when implemented without enhanced isolation, while enhanced isolation decreased transmission by just 6% and 19% when applied only to clinically detected patients. However, for both models, enhancing isolation was synergistic with active surveillance: the 5-year transmission result for their combination was 56% lower than the result for active surveillance alone (Supplementary Table 5).
For model A, using an intervention initiation trigger of 1, 5, 10, and 20 detections produced intervention effects of 79%, 73%, 68%, and 60%, respectively. For model B, triggers of 1, 5, 10, and 20 produced decreases of 93%, 89%, 85%, and 79% (Supplementary Table 6). Tracking over 10 years showed that regional prevalence increased rapidly after initial CRE introduction and during the preintervention phase. Slowing or reversing the rise in prevalence occurred gradually after initiating the intervention, such that the average effect of delaying was evident even after several years, although variability intervals overlapped (Figure 2).
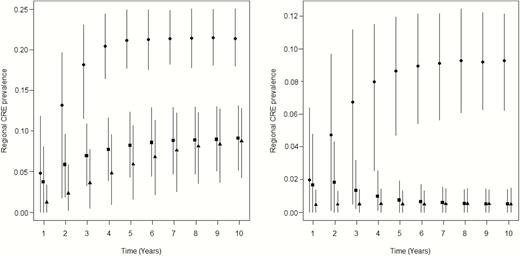
Long-term implications for delaying the start of intervention (both components) on average regional facility prevalence of carbapenem-resistant Enterobacteriaceae (CRE). Points are average prevalence at each year (horizontally offset for clarity) after initial CRE introduction for no intervention (circles); intervention initiation triggered at 1 clinical detection in the long-term acute care hospital (triangles) and at 20 clinical detections (squares). Vertical lines are 90% variability ranges across 1000 stochastic simulations. Left panel: model A; right panel: model B.
We ran the no- and combined-intervention simulations under very different assumptions for the distribution of LTACH discharge destinations. Results (Supplementary Table 6) showed that the main effect (decrease in 5-year cumulative transmissions) of intervention triggered at 1 detection was >73% for model A and >92% for model B for each alternate assumption.
DISCUSSION
The major finding of this study was that a simulated intervention focused on a single LTACH controlled transmission of CRE at the regional level. LTACH patients comprised only 8.6% of the regional facility population on average, yet the LTACH-focused intervention reduced region-wide average transmissions by 79%–93% over 5 years compared to no-intervention simulations. Targeting LTACHs or similarly influential facilities for intervention can be a highly efficient use of resources to prevent large-scale regional CRE outbreaks.
Mitigation of regional spread materialized more slowly if the intervention was not instituted promptly. When delaying the intervention, the same regional prevalence was eventually reached but the cumulative number of transmissions increased. This finding highlights the challenges of designing intervention trials to evaluate the benefits of control policies. In regions where CRE prevalence is already high, the regional benefits of an LTACH-only intervention may take several years to become apparent. Enhancements to an LTACH-only approach, such as actions by and improved communication with other facilities [8, 9], might expedite implementation of interventions and the realization of their effects across the region, particularly when other regional facilities experience elevated transmission (as in our model A).
Our findings for facility transmission rate parameters, which were bounded by CRE carriage prevalence observations in endemic regions, showed that per-capita transmission rates were highest in LTACHs, equal or lower in ACHs, and lower still in NHs. LTACH patients have both the prolonged LOS of NH residents and the antibiotic and device exposure of acute inpatients. Moreover, nearly all LTACH admissions are transfer patients who had long average LOS and potentially high CRE susceptibility in ACH before transfer, leading to high levels of CRE importation and subsequent exportation back to other facilities. All these features combine to cause LTACHs or similar facilities to amplify CRE dissemination throughout a region, analogous to the impact of a core group in the epidemiology of sexually transmitted diseases.
Our findings have practical implications for CRE control policies. Previous models demonstrated that regionally coordinated interventions were more effective than uncoordinated efforts [8, 9]. Focusing regional control strategies in LTACHs, or similarly vulnerable locations such as ventilator units of skilled nursing facilities, may be more efficient. Implementing LTACH-based interventions before CRE becomes endemic could produce public health benefits for all regional facilities. Direct costs of prevention policy implementation and indirect costs from incentive program penalties are of regional concern. Further work is needed to find ways to finance these efforts, as mechanisms to support costs borne by LTACHs may not currently exist.
The intervention we modeled, sometimes called active detection and isolation (ADI), has been tested in several trials, with inconsistent levels of success for drug-resistant pathogens such as MRSA [35, 36]. ADI was one component of an intervention that successfully reduced CRE in Chicago-area LTACHs [18], and our model produced equivalent reductions under similar conditions. Because that intervention included additional components, such as chlorhexidine gluconate bathing of all patients, it is possible that we have overestimated the effects of ADI implemented alone. However, our conclusions about the potential regional benefits of timely intervention in LTACHs remain valid for any particular intervention strategy that can successfully reduce transmissions in LTACHs.
We assumed that all new acquisitions of CRE in healthcare facilities were due to transmission from co-located CRE carriers and did not model other possible environmental or endogenous routes of acquisition [37]. However, adding other acquisition mechanisms to the model would be unlikely to change our conclusions about intervention effectiveness; for example, environmental acquisitions could be prevented by ADI through improved terminal cleaning of isolated patient rooms (Supplementary Materials).
The facilities providing the prevalence data we used to estimate CRE transmission parameters may have different patient-flow characteristics than what we assumed. However, our intervention effectiveness results were robust to substantial changes in discharge destinations of LTACH patients and to widely different expected prevalence across the 3 facility types. Even when assuming high transmission and prevalence in non-LTACH facilities, the LTACH-only intervention produced substantial regional benefit. This suggests that our main conclusions are not sensitive to particular details of our regional network assumptions. A preliminary analysis applying epidemic threshold theory to facility admission reproduction numbers (Supplementary Materials) [38] lends further support to this notion. The LTACH intervention shifts its transmission rate below a threshold required for a self-sustaining facility outbreak, whereas ACHs and NHs are likely below this threshold without intervention. Thus, the LTACH-focused intervention can shift the entire region below a critical threshold regardless of particular assumptions about connections to and transmissions within the non-LTACH facilities.
In summary, our model illuminates how the factors that may cause LTACHs or similarly vulnerable facilities to amplify multifacility CRE outbreaks could be harnessed to efficiently reduce region-wide transmission with timely interventions targeted there. Thus, ADI in LTACHs can be framed by health departments as a key component of a regional strategy to achieve control of CRE. The strategies we tested also can inform planning for newly emerging pathogens likely to have disproportionate outbreak potential in LTACHs. The costs and justification of implementing LTACH-focused interventions may vary by region because of differences in CRE prevalence and other factors. Nonetheless, steps should be undertaken now to evaluate the feasibility and impact of LTACH-focused initiatives to combat the spread of antibiotic resistance.
Supplementary Data
Supplementary materials are available at Clinical Infectious Diseases online. Consisting of data provided by the authors to benefit the reader, the posted materials are not copyedited and are the sole responsibility of the authors, so questions or comments should be addressed to the corresponding author.
Notes
Acknowledgments. The authors thank James Baggs for his review of Centers for Medicare and Medicaid Services data for length of stay among patients in LTACHs.
Disclaimer. The funders had no role in study design, data collection and analysis, decision to publish, or preparation of the manuscript. The views expressed in this article are those of the authors and do not necessarily reflect the position or policy of the Department of Veterans Affairs, the Centers for Disease Control and Prevention, the Agency for Healthcare Research and Quality, or the US government.
Financial support. This work was supported by a VA Center of Innovation Award from the US Department of Veterans Affairs Health Services Research and Development Service (award number I50HX001240 to D. J. A. T., K. K., A. V. G., M. A. R., and M. H. S.).
Potential conflicts of interest. A. V. G. has received personal fees from Promise Hospital of Salt Lake. All other authors report no potential conflicts. All authors have submitted the ICMJE Form for Disclosure of Potential Conflicts of Interest. Conflicts that the editors consider relevant to the content of the manuscript have been disclosed.
References
Author notes
Correspondence: D. J. A. Toth, University of Utah School of Medicine, Division of Epidemiology, 295 Chipeta Way, Salt Lake City, UT 84132 ([email protected]).

