


Abstract
The risk of infection with Mycobacterium tuberculosis among healthcare workers (HCWs) is estimated to be higher than the general population. However, HCW acceptance and compliance with available latent tuberculosis infection (LTBI) treatment regimens has been problematic. Recently, regimens have become available that might improve HCW acceptance and compliance with LTBI treatment.
A retrospective single-center review of Employee Health and Wellness Services records of all HCWs diagnosed with LTBI was conducted. HCWs diagnosed with LTBI were offered 9-month isoniazid (INH), 4-month rifampin (RIF), weekly rifapentine/isoniazid (RPT/INH) for 12 weeks, or no treatment. Acceptance, completion rates, and side effects were reported for each regimen. Comparisons of regimens were assessed using Fisher exact test.
Between 2005 and 2014, 363 of 927 (39%) HCWs diagnosed with LTBI accepted treatment. Of 363, 202 chose INH, 106 RIF, and 55 RPT/INH. Completion rates for each regimen were 58%, 80%, and 87%, respectively. HCWs were significantly more likely to have completed treatment with RIF (P < .0001) or RPT/INH (P < .0001) than INH. Rates of discontinuation owing to side effects were 35% for INH, 21% for RIF, and 10% for RPT/INH. Discontinuation of therapy due to side effects was significantly more frequent in the INH than the RPT/INH group (P = .0042).
Completion of RIF and RPT/INH for LTBI in an HCW population is more likely than INH. Rates of discontinuation due to side effects were lower among those taking RPT/INH. Shorter LTBI treatment regimens should be more widely considered for HCWs in the United States.
Reactivation of latent tuberculosis infection (LTBI) accounts for the majority of new active tuberculosis (TB) cases in countries with low incidence, including the United States. Therefore, a public health strategy to eliminate TB in the United States has been the identification and treatment of LTBI [1, 2]. Healthcare workers (HCWs) have been reported to have a higher rate of active TB and higher risk for TB compared to the general population [3, 4]. The Centers for Disease Control and Prevention (CDC) has published guidelines for preventing the transmission of Mycobacterium tuberculosis in healthcare facilities and recommending TB screening programs for all HCWs along with offering treatment when LTBI is diagnosed [5, 6]. However, the acceptance of LTBI treatment among HCWs is lower than in comparison to non-HCWs [7–10]. Barriers have included the types of therapies available, their duration, and their toxicities [7].
In 1965, the American Thoracic Society recommended isoniazid (INH) for the treatment of LTBI [11]. Since then, INH administered daily for 6–12 months has been the mainstay of treatment with reported efficacy rates ranging from 60% to 90% [12] but with completion rates of 44%–53% [9, 13–15].
Studies in non-HCWs have demonstrated that shorter regimens for treatment of LTBI, including rifampin (RIF) for 4 months [9, 13–17], RIF/INH for 3–4 months [18–21], RIF/pyrazinamide (PZA) for 2 months [22, 23], and rifapentine (RPT)/INH for 12 weeks [24–27], resulted in improved completion rates in comparison to 9 months of INH alone.
In 2000, CDC and the American Thoracic Society incorporated additional LTBI treatment options, including 4-month RIF and 2-month RIF/PZA [7]. However, both organizations later recommended against RIF/PZA due to the increased risk of liver injury and death in patients with underlying liver disease or alcohol use disorders [28, 29].
Starting in 2011, the CDC has been recommending a combination of RPT/INH for 12 weeks under directly observed therapy (DOT) for the general population, as well as for healthy patients with human immunodeficiency virus (HIV) infection [30]. This recommendation is based on the study by Sterling et al, which demonstrated the noninferiority of RPT/INH compared to INH in preventing active TB [25].
The objective of our study was to assess the acceptance and completion rates of newer and shorter-duration regimens for LTBI in HCWs at our center over a 10-year period. In addition, rates of side effects by regimen and rates of discontinuation of LTBI treatment due to side effects were measured.
METHODS
The study was reviewed and approved by the Institutional Review Board at Memorial Sloan Kettering Cancer Center (MSKCC), New York, New York. This was a retrospective review of medical records of all HCWs diagnosed with LTBI between 1 January 2005 and 31 December 2014. The term “HCW” refers to any employee (eg, physician, nurse, therapist, laboratory worker, clerical staff, housekeeping, food service, research, security) of MSKCC. Demographic characteristics (age, sex, and country of origin), history of previous Bacillus Calmette-Guerin (BCG) vaccination, tuberculin skin test (TST) results, interferon-γ release assay (IGRA) results, LTBI treatment accepted by the HCW, clinical symptoms reported by the HCW attributed to LTBI treatment, and liver function test (LFT) results were extracted from the electronic medical record at Employee Health and Wellness Services at MSKCC.
Diagnosis of Latent Tuberculosis Infection
HCWs at MSKCC are routinely screened for TB prior to start of employment and then annually once employed. TB screening involves TST testing in which 5 tuberculin units of purified protein derivative (PPD) (Tubersol, Sanofi-Pasteur, Toronto, Canada) is placed intradermally and read within 48–72 hours by trained nursing personnel. A TST result of ≥10 mm in the transverse diameter axis is considered positive. Since 2007, IGRA testing has been performed in PPD-positive, BCG-vaccinated individuals by using the QuantiFERON-TB Gold test (Cellestis, Melbourne, Australia) from 2007 to 2009, then the QuantiFERON-TB Gold In-Tube test (Qiagen/Cellestis, Melbourne, Australia) since 2010. A QuantiFERON value of at least 0.35 is considered positive. HCWs are assigned an LTBI diagnosis if the TST or IGRA testing is positive, a chest radiograph is negative for signs of active TB, and the history form (Health Assessment for Symptoms of Active TB) is negative.
Treatment for Latent Tuberculosis Infection
Four treatment options were offered starting in the years of availability [1]: no treatment (available all 10 years of study) [2]; INH 300 mg orally daily with pyridoxine 50 mg orally daily for 9 months (available for all 10 years of study); (3) RIF 600 mg orally daily for 4 months (available starting in March 2006 through 2014); or RPT 900 mg orally /INH 900 mg orally weekly for 12 weeks (available starting in January 2013 through 2014). All HCWs had the option to receive all regimens at no cost from the MSKCC pharmacy.
Baseline LFTs were obtained prior to starting treatment. Initially, follow-up LFTs were monitored at the treating clinician’s discretion [7]. However, because of severe hepatotoxicity occurring in an HCW taking INH alone, LFTs were subsequently monitored on a monthly basis after the first quarter of 2009. As previously reported by Lacaille et al [31], a self-administration strategy was developed instead of DOT for the RPT/INH treatment regimen. This strategy utilized weekly email reminders coupled with monthly urine color checks for the orange color change associated with RPT, and retrospectively confirmed with the dispensing pharmacy that prescriptions were actually filled.
Data Analysis
The primary outcomes were rates of acceptance and completion of treatment for LTBI. Secondary outcomes were rates of side effects by regimen and rates of permanent discontinuation of therapy because of side effects. Comparison of the differences between the acceptance and completion of the treatment, as well as rates of side effects and discontinuation by regimen, were measured by Fisher exact test. All side effects (both clinical and laboratory) were included in the tally, and all were graded independently by 3 physicians (E. A. P., W. J. S., and A. E. B.), using the National Cancer Institute’s Common Terminology Criteria for Adverse Effects (CTCAE) version 4.03 [32].
RESULTS
Between 1 January 2005 and 31 December 2014, 927 HCWs were diagnosed with LTBI at MSKCC. Demographic characteristics of HCWs are shown in Table 1. The mean age was 36 years; half were men; and the majority was foreign-born, of which 74% had previous BCG vaccination.
Demographic Characteristics of Healthcare Workers Diagnosed With Latent Tuberculosis Infection
| Characteristic | INH (n = 202) | RIF (n = 106) | RPT/INH (n = 55) | Decline (n = 564) | Total (N = 927) |
|---|---|---|---|---|---|
| Age, y, mean ± SD | 35 ± 10 | 39 ± 11 | 35 ± 8 | 37 ± 10 | 36 ± 10 |
| Male sex, No. (%) | 107 (53) | 59 (56) | 29 (53) | 271 (48) | 466 (50) |
| Origin, No. (%) | |||||
| Asia | 68 (34) | 46 (43) | 19 (36) | 248 (44) | 381 (41) |
| Latin American/Caribbean | 51 (25) | 21 (20) | 15 (27) | 109 (19) | 196 (21) |
| United States | 58 (29) | 26 (25) | 13 (23) | 94 (17) | 191 (21) |
| Eastern Europe | 8 (4) | 1 (1) | 2 (4) | 49 (9) | 60 (7) |
| Western Europe/Canada/Australia | 6 (3) | 6 (6) | 3 (5) | 34 (6) | 49 (5) |
| Africa | 8 (4) | 6 (6) | 3 (5) | 26 (5) | 43 (5) |
| Missing origin | 3 (2) | 0 (0) | 0 (0) | 4 (1) | 7 (1) |
| Previous BCG, No. (%) | 120 (59) | 78 (74) | 42 (76) | 443 (79) | 683 (74) |
Abbreviations: BCG, Bacillus Calmette-Guerin; INH, isoniazid; RIF, rifampin; RPT, rifapentine; SD, standard deviation.
Latent Tuberculosis Infection Acceptance Rates
Acceptance rates by year of any LTBI treatment during the study period ranged from 31% to 62% with an overall acceptance rate of 39% (363/927) (Figure 1). Figure 2 illustrates the choices that HCWs made by year of diagnosis of LTBI. Overall, 202 of 363 (56%) HCWs chose INH, 106 (29%) RIF, and 55 (15%) RPT/INH.
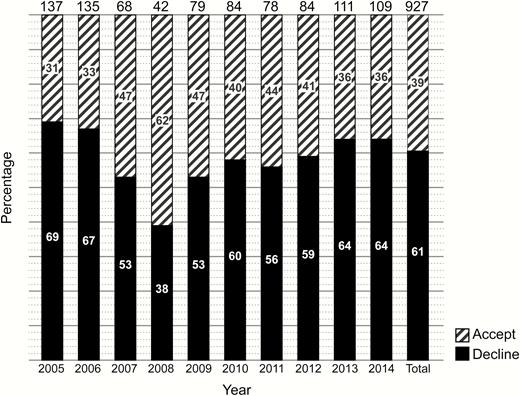
Acceptance of treatment for latent tuberculosis infection by year of diagnosis.
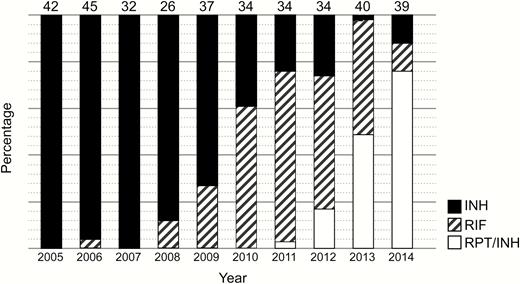
Treatment regimens by year of diagnosis of latent tuberculosis infection.
Abbreviations: INH, isoniazid; RIF, rifampin; RPT, rifapentine.
Treatment Completion Rates
The overall completion rate was 69% (250/363) (Figure 3). Of 202 HCWs who chose INH, 117 (58%) completed 9 months of treatment. An additional 20 HCWs completed 6–8.5 months of INH (6 months [n = 2]; 6.5 months [n = 1]; 7 months [n = 7]; 7.5 months [n = 2]; 8 months [n = 6]; and 8.5 months [n = 2]) for a total of 137 of 202 (68%). For RIF, 85 of 106 (80%) completed 4 months of treatment, and for RPT/INH, 48 of 55 (87%) completed 12 weeks of treatment. HCWs were significantly more likely to have completed treatment with RIF than INH (80% vs 58%; P < .0001) or RPT/INH than INH (87% vs 58%; P < .0001).
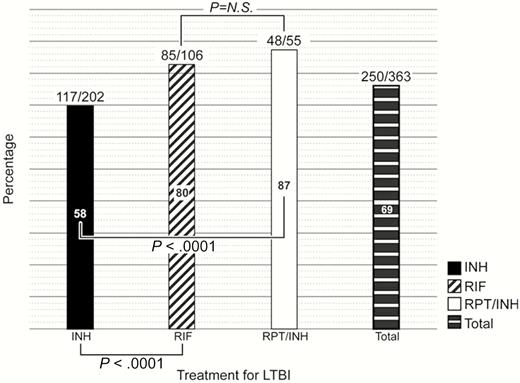
Percentage completing treatment for latent tuberculosis. Abbreviations: INH, isoniazid; LTBI, latent tuberculosis infection; N.S., not significant; RIF, rifampin; RPT, rifapentine.
Side Effects
Table 2 depicts the side effects reported by regimen. Overall, there were significantly more side effects reported in the RPT/INH group compared with the INH (73% vs 41%; P = .0001) and RIF groups (73% vs 49%; P = .0044). The most common side effect observed in the RPT/INH group was 25 cases (45%) of increased total bilirubin in comparison to INH (45% vs 1%; P < .0001) and RIF (45% vs 10%; P < .0001), respectively. All were grade 1 and 2, and none was of clinical significance. “Flu-like” symptoms were observed exclusively in HCWs treated with RPT/INH (3/55 [5%]). Aminotransferase elevations were observed significantly more often in the INH group (28%) compared to the RPT/INH group (7%) (P = .0006) as well as in the RIF group (24%) compared to the RPT/INH group (7%) (P = .0099). Seven of the 57 (12%) aminotransferase elevations among HCWs treated with INH were grade 3 or 4, whereas 1 of the 25 (4%) aminotransferase elevations among those treated with rifampin were grade 3. One HCW during the study period required hospitalization for severe hepatitis with grade 4 aminotransferase elevation as a complication of INH treatment for LTBI.
Side Effects Reported by Regimen
| Side Effect | INH (n = 202) | RIF (n = 106) | RPT/INH (n = 55) |
|---|---|---|---|
| Allergy | 0 (0) | 1 (1) | 2 (4) |
| Urticaria | 2 (1) | 2 (2) | 1 (2) |
| Fatigue/weakness | 5 (3) | 2 (2) | 1 (2) |
| Flulike symptoms | 0 (0) | 0 (0) | 3 (5) |
| Gastrointestinal symptoms | 9 (4) | 2 (2) | 2 (4) |
| Headache | 0 (0) | 1 (1) | 2 (4) |
| Increased total bilirubin | 3 (1) | 11 (10) | 25 (45) |
| Increased aminotransferases | 57 (28) | 25 (24) | 4 (7) |
| Increased ALP | 1 (1) | 6 (6) | 0 (0) |
| Rash | 3 (1) | 1 (1) | 0 (0) |
| Neuropathy | 2 (1) | 0 (0) | 0 (0) |
| Eye irritation | 0 (0) | 1 (1) | 0 (0) |
| Total | 82 (41) | 52 (49) | 40 (73) |
| HCWs with > 1 side effect | 14 (7) | 10 (9) | 7 (13) |
Data are presented as No. (%).
Abbreviations: ALP, alkaline phosphatase; HCW, healthcare worker; INH, isoniazid; RIF, rifampin; RPT, rifapentine.
Table 3 shows the graded severity of adverse events in HCWs receiving LTBI therapy and rates of discontinuation resulting from those side effects. Grade 3 and 4 adverse events were more commonly reported in the INH group. HCWs in the RPT/INH group were less likely to discontinue medication due to side effects in contrast to INH (10% vs 35%; P = .0042) (Table 3). There were no significant differences in discontinuation rates due to adverse effects between INH and RIF (35% vs 21%; P = not significant [ns]) and between RIF and RPT/INH (21% vs 10%; P = ns). Seven grade 3 and 4 aminotransferase elevations were seen in the INH group, and all 7 resulted in discontinuation of INH. The single grade 3 aminotransferase elevation in the RIF group resulted in discontinuation of this treatment.
Severity of Adverse Events in Healthcare Workers Taking Treatment for Latent Tuberculosis Infection
| AE Severity | INH (n = 82) | RIF (n = 52) | RPT/INH (n = 40) |
|---|---|---|---|
| Grade 1 | 67 (82) | 42 (81) | 23 (58) |
| Grade 2 | 7 (9) | 8 (15) | 17 (41) |
| Grade 3 | 6 (7) | 2 (4) | 0 (0) |
| Grade 4 | 1 (1) | 0 (0) | 0 (0) |
| Nongraded | 1 (1) | 0 (0) | 0 (0) |
| Drug discontinuationa | 29 (35) | 11 (21) | 4 (10) |
Data are presented as No. (%).
Abbreviations: AE, adverse event; INH, isoniazid; RIF, rifampin; RPT, rifapentine.
aINH vs RPT/INH, P = .0042; INH vs RIF, P = not significant; RIF vs RPT/INH, P = not significant.
DISCUSSION
To our knowledge, this is the first study to report acceptance and completion rates of LTBI treatment exclusively in HCWs at a single institution. In our study, only 39% of employees diagnosed with LTBI accepted treatment. This figure is lower than what has been previously reported for HCW acceptance rates for LTBI therapy, ranging between 44% and 84% [10, 33–36]. Because we did not query HCWs as to their reasons for refusing LTBI treatment, we are unable to offer explanations for the lower acceptance rate. However, prior studies have shown that HCWs are more likely than non-HCWs to decline treatment [8–10]. An inadequate understanding of key TB concepts (eg, difference between LTBI and active TB) and the meaning of screening test results as well as fear of therapeutic consequences (eg, adverse effects, follow-up visits, hidden costs) may be factors influencing HCW decision making [8, 10, 37]. For people who have received BCG vaccination, there may also be a perception that they are at low risk for progressing to TB disease and thus likely to see little benefit in LTBI treatment [38]. Improving TB health literacy has been noted to be a possible intervention to ensure that those truly at high risk for TB reactivation understand the importance of accepting LTBI treatment [10, 37].
For HCWs who did accept LTBI treatment, the overall completion rate was 69%, which is higher than what has been reported in other retrospective trials comparing INH to RIF-based regimens (45%–68%) or RPT/INH (60%) (Table 4) [9, 13–15, 26]. Similar to previously published prospective trials, HCWs who received shorter courses with either RIF or RPT/INH were significantly more likely to complete treatment than those who chose the 9-month INH regimen (Table 4) [16, 17, 24, 25, 27, 39]. One potential barrier to RPT/INH has been the need for DOT [27]. However, as demonstrated in a small pilot study of 26 HCWs, we have implemented a self-administration strategy incorporating weekly email reminders, monthly urine color inspections, and confirmations with the dispensing pharmacy to assure that prescriptions have been filled as an alternative to DOT [31]. During the last 5 years of our study (2010–2014), INH was no longer the regimen of choice for the majority of HCWs.
Overall, the total number of side effects reported in our study by regimen was significantly higher in the RPT/INH group compared with INH or RIF alone. However, 62.5% (25 of 40) of RPT/INH side effects were grade 1 (1.0–1.5 times normal) or 2 (1.5–3.0 times normal) elevations of total bilirubin that had no clinical significance. In studies by Sterling et al and Stennis et al, the side effects reported as attributable to the RPT/INH regimen were much lower: 14.7% (595/4040) and 13.2% (40/302), respectively [25, 27]. Unlike our study, neither of these investigations routinely conducted prospective monitoring of LFTs unless prompted by a clinical situation; as such, monitoring was left to the discretion of the investigator (Dr. Neil Schluger of the Sterling paper [25] and Dr. Diana Nilsen of the Stennis paper [27], personal communication). By obtaining LFTs as frequently as we did, we identified that low-grade elevations (grade 1 and 2) of total bilirubin occurred among HCWs taking RPT/INH, which had previously not been reported.
In our study, aminotransferase elevations were more frequently reported in the INH group (28%), followed by the RIF group (24%) and the RPT/INH group (7%). Within the INH group, 6 cases of grade 3 and 1 case of grade 4 aminotransferase elevation were reported. These grade 3 and 4 aminotransferase elevations in the INH group were clinically significant such that treatment was discontinued. The single case of grade 3 aminotransferase elevation in the RIF treatment group required discontinuation of RIF. No aminotransferase elevations were observed among the RPT/INH treatment group.
The best measure of the impact of side effects is whether the side effect actually resulted in discontinuation of the treatment regimen. In the current study, discontinuations as a consequence of hepatotoxicity were significantly more likely to occur with the INH group compared with the RPT/INH group, similar to what was reported by Sterling et al [25]. Hepatotoxicity in the INH treatment group of the Sterling et al study was 2.7% (103/3759), whereas grade 3 and 4 elevations of aminotransferase resulting in discontinuation of INH were reported to occur among 3.5% (7/202) of the INH-treated group in the current study. Hepatoxicity was minimal in the RPT/INH arm of the Sterling et al study (18/4040 [0.4%]), while grade 3 and 4 elevations of aminotransferase did not occur among any of the RPT/INH-treated group in the current study (0/55 [0%]).
One notable difference between our 2 studies is the finding by Sterling and colleagues of a higher discontinuation due to possible hypersensitivity in patients taking RPT/INH than INH (2.9% vs 0.4%; P < .001) [25]. They commented that their definition of possible hypersensitivity was very broad and that perhaps the frequent contact between patients and study staff in the setting of DOT for RPT/INH may have affected this finding. Although our numbers of HCWs taking RPT/INH was much smaller and we had monthly rather than weekly contact with those HCWs, we did not observe the hypersensitivity reactions as described by Sterling et al [25].
Limitations of our study include its retrospective nature, as well as our inability to provide reasons for why HCWs declined treatment in the first place. Additionally, because RPT/INH therapy was offered at our institution only in the last 2 years of the study (2013–2014), we had a relatively lower number of employees in the RPT/INH group compared to the other 2 groups. As mentioned earlier, another limitation is the fact that routine monthly LFT monitoring was not uniformly performed for the first 4.25 years of the study.
On the other hand, our study is the first to evaluate the acceptance and completion rates of an HCW population using short-term therapy for LTBI. It is also the first to describe the use of RPT/INH without utilizing DOT, as DOT is reportedly perceived as a significant impediment to enrollment for RPT/INH [27]. It is worth noting that our RPT/INH completion rates are comparable with studies utilizing DOT [24, 25, 27]. While we had overall low acceptance rates for LTBI treatment among HCWs, we found that shorter regimens such as RIF for 4 months or RPT/INH for 12 weeks had significantly higher completion rates compared to the traditionally used 9-month INH regimen.
In conclusion, shorter LTBI treatment regimens such as RIF or RPT/INH in lieu of INH should be more widely considered for HCWs in the United States. Increasing awareness and use of these 2 shorter regimens as alternatives to INH may also improve the likelihood of increased HCW acceptance for the treatment of LTBI. Studies should also be performed to further assess the implications of not using DOT in an HCW setting and whether this might have an impact on improving HCW acceptance rates for LTBI treatment.
Supplementary Data
Supplementary materials are available at Clinical Infectious Diseases online. Consisting of data provided by the authors to benefit the reader, the posted materials are not copyedited and are the sole responsibility of the authors, so questions or comments should be addressed to the corresponding author.
Footnotes
Presented in part: IDWeek 2015, San Diego, California, October 7–11, 2015.
Notes
Acknowledgments. The authors dedicate this manuscript to honor the memory of the late William J. Schneider, MD, MPH, who did not live to see the completion of this work. We acknowledge the infectious disease fellows who saw these employees at Employee Health and Wellness Services (EH&WS): Sherard N. J. Lacaille, MBBS; Maria Del Castillo, MD; Anabella Lucca Bianchi, MD; Sejal M. Morjaria, MD; and Fabian Andres Romero, MD. We also acknowledge the EH&WS nurses who cared for these employees, Evelyn Velazquez who helped with data analysis, and Anna Kaltsas, MD, who reviewed and provided suggestions for the manuscript.
Financial support. This work was supported by the National Institutes of Health/National Cancer Institute (Cancer Center Support Grant P30 CA008748).
Potential conflicts of interest. All authors: No reported conflicts of interest. All authors have submitted the ICMJE Form for Disclosure of Potential Conflicts of Interest. Conflicts that the editors consider relevant to the content of the manuscript have been disclosed.
References
Author notes
E. A. P., S. K. S., and A. E. B. contributed equally to this work.

