


Abstract
Despite the well-documented association between diabetes and active tuberculosis, evidence of the association between diabetes and latent tuberculosis infection (LTBI) remains limited and inconsistent.
We included observational studies that applied either the tuberculin skin test or the interferon gamma release assay for diagnosis of LTBI and that provided adjusted effect estimate for the association between diabetes and LTBI. We searched PubMed and EMBASE through 31 January 2016. The risk of bias of included studies was assessed using a quality assessment tool modified from the Newcastle-Ottawa scale.
Thirteen studies (1 cohort study and 12 cross-sectional studies) were included, involving 38263 participants. The cohort study revealed an increased but nonsignificant risk of LTBI among diabetics (risk ratio, 4.40; 95% confidence interval [CI], 0.50–38.55). For the cross-sectional studies, the pooled odds ratio from the random-effects model was 1.18 (95% CI, 1.06–1.30), with a small statistical heterogeneity across studies (I2, 3.5%). The risk of bias assessment revealed several methodological issues, but the overall direction of biases would reduce the positive causal association between diabetes and LTBI.
Diabetes was associated with a small but statistically significant risk for LTBI. Findings from this review could be used to inform future cost-effectiveness analysis on the impact of LTBI screening programs among diabetics.
Tuberculosis remains a major infectious disease globally; it caused 1.5 millions deaths in 2014 [1, 2]. Following initial contact with viable bacilli, hosts who fail to clear all Mycobacterium tuberculosis can progress to the status of latent tuberculosis infection (LTBI) and have a life-time risk of 5%–15% to further progress into active tuberculosis [3]. Treatment of LTBI aims at preventing progression to active disease and is now being increasingly recommended in low tuberculosis–burden countries, especially among specific high-risk populations including people living with human immunodeficiency virus (HIV), adult and child contacts of pulmonary tuberculosis cases, patients who initiate antitumor necrosis factor treatment, patients who receive dialysis, patients preparing for organ or hematological transplantation, and patients with silicosis [4].
Diabetes mellitus (DM) is a noncommunicable disease that can impair host immunity and lead to increased susceptibility to various infectious diseases including tuberculosis [5]. The prevalence of DM increased rapidly between 1980 and 2014 globally, from 4.3% to 9.0% in men and from 5.0% to 7.9% in women [6]. Previous cohort studies revealed that DM was associated with a 2- to 3-fold increase in tuberculosis risk [7]. The increasing prevalence of DM, especially in high-burden countries, has therefore generated concerns that this double epidemic could undermine the global tuberculosis control effort [8–10].
Despite the well-established association between DM and active tuberculosis, it is still unclear whether DM patients have a higher risk for LTBI. In the recently published World Health Organization (WHO) guideline on the management of LTBI, systematic testing for LTBI in people with DM was not recommended [4]. This recommendation was a conditional recommendation based on very low quality of evidence. Previous epidemiologic studies on DM and LTBI were limited and produced inconsistent results [11–14]. We therefore conducted a systematic review and metaanalysis to investigate this association.
METHODS
We adhered to the PRISMA guidelines for conducting the present systematic review and metaanalysis [15]. We included observational studies (cross-sectional, case-control, and cohort) that used either tuberculin skin test (TST) or interferon gamma release assay (IGRA) for the diagnosis of LTBI. We excluded observational studies that only provided the crude effect estimate of the association between DM and LTBI without any adjustment of potential confounding factors (ie, age, sex, smoking, alcohol use, HIV, body mass index, and socioeconomic status). We conducted a search on PubMed and EMBASE database through 31 January 2016, limiting to human patients and publications in English. The details of the search strategy are listed in Box 1. Three reviewers (Y. T. K., Y. P. H., and M. R. L.) screened all titles and abstracts independently and evaluated relevant articles. We also searched the reference lists of available bibliographies, review articles, and relevant metaanalyses for additional articles to be included.
Data Extraction
We used a standardized data extraction form that included study year, study location, study population, participant characteristics, diagnostic method of LTBI, DM definition, and crude and adjusted effect sizes and their 95% confidence intervals (CIs). For studies that only reported the crude effect size, we contacted the authors to request the adjusted effect size and relevant information. When the association between DM and LTBI was analyzed based on TST and IGRA separately, we reported the association based on the IGRA test for its superior specificity over TST and similar sensitivity [16].
Quality Assessment
To assess the quality of the included studies, we used a risk-of-bias tool that was modified from a previous systematic review and the Newcastle-Ottawa scale for observational studies (Supplementary Appendix 1) [17]. The tool was used to evaluate 3 major sources of bias in epidemiological studies using the following 5 items: selection bias (1 item), measurement bias (2 items), and confounding bias (2 items); each domain was classified as high risk or low risk according to prespecified criteria. All included studies were evaluated by an epidemiologist (H. H. L.) and a pulmonologist (M. R. L.) independently; any discrepancies were resolved through discussion.
Statistical Methods and Data Synthesis
We separately conducted metaanalyses on the association between DM and LTBI for different types of observational studies. A random-effects model was used to calculate the pooled effect size because of the heterogeneity of study populations. We assessed statistical heterogeneity across studies using the I2 statistic [18]. For studies that reported both the crude and adjusted effect estimates, we conducted 2 metaanalyses to pool the crude and adjusted estimates separately.
We conducted subgroup analyses and metaregression analyses to see if different study-level factors would influence the results of pooled estimates, including different LTBI diagnostic methods, region of the study population, background prevalence of LTBI in the study population, and risk of bias assessment [19]. We used Begg’s test and Egger’s test to assess the publication bias [20, 21]. All statistical analyses were performed using Stata 12.1 (StataCorp).
MeSH terms
1. ‘‘Tuberculin Test’’
2. ‘‘Interferon-gamma Release Tests’’
3. ‘‘Latent Tuberculosis’’
4. ‘‘Diabetes Mellitus’’
Text terms
5. ‘‘tuberculin skin test’’
6. ‘‘interferon gamma release assay’’
7. ‘‘latent tuberculosis’’
8. ‘‘diabetes’’ OR ‘‘diabetes mellitus’’
Search strings (all inclusive):
[(1 OR 2 OR 3 OR 5 OR 6 OR 7) AND (4 OR 8)] OR 7
Text terms
1. “Tuberculin Test” OR “tuberculin skin test”
2. “Interferon-gamma Release Tests” OR “interferon gamma release assay”
3. “Latent Tuberculosis”
4. “Diabetes Mellitus” OR “diabetes”
Search strings (all inclusive):
[(1 OR 2 OR 3) AND 4] OR 3
RESULTS
A total of 4434 records were screened and 443 full-text articles were assessed for eligibility. Twelve articles were selected for qualitative review, including 1 cohort study and 12 cross-sectional studies (1 article contained a cross-sectional study and a cohort study [22]; Figure 1). The characteristics of the 13 included studies are summarized in Table 1. The studies involved 38263 participants and 2999 DM patients from 7 countries. The majority of studies were conducted in high-risk populations from developed countries, such as contacts of active tuberculosis patients, immunocompromised patients, or immigrants from high-incidence countries. The mean/median age of the participants ranged from 25 to 82 years across studies. The prevalence of diabetes ranged from 2% to 26.5% and that of LTBI ranged from 9.1% to 80.3%. The largest study (n = 22227) was conducted among immigrants seeking medical attention in a tuberculosis control clinic with a high prevalence of LTBI (77.6%) and active tuberculosis disease (3.4%) [23].
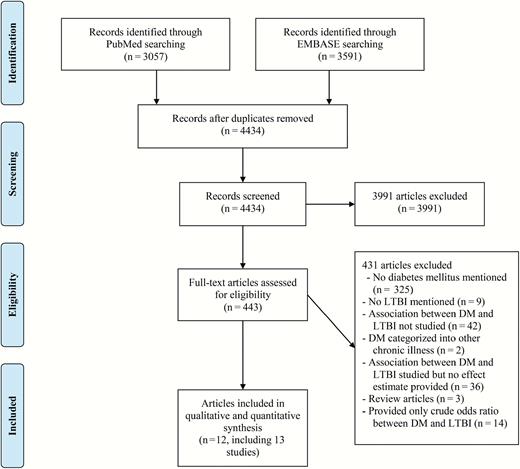
Flow chart of literature search. Abbreviations: DM, diabetes mellitus; LTBI, latent tuberculosis infection.
Characteristics of 13 Observational Studies in the Review
| Author and year | Study Type | Country | Study Population (n) | Exclusion of Active Tuberculosis | LTBI Prevalence (%) | DM Prevalence (%) | Age (Mean/ Median) | LTBI Diagnosis | DM Diagnosis | Odds ratio (95% Confidence Interval) |
|---|---|---|---|---|---|---|---|---|---|---|
| Arnedo-Pena 2015 [22] | Cohorta | Spain | Contacts of pulmonary tuberculosis patients (n = 198) | Yes | 9.1b | 2 | 37.5 | IGRA and TST | Unclear | Risk ratio: 4.40 (0.50–38.55) |
| Arnedo-Pena 2015 [22] | Cross sectionala | Spain | Contacts of pulmonary tuberculosis patients (n = 386) | Yes | 23.3 | 3.6 | 35.4 | IGRA and TST | Unclear | 1.71 (0.48–6.08) |
| Hensel 2015 [14] | Cross sectional | United States | Adult refugees (≥ 21 years) (n = 702) | Yes | 31.5 | 7.7 | 33 | QFT | HbA1c | 2.27 (1.15–4.48) |
| Alvarez 2014 [11] | Cross sectional | Canada | Households in areas of high tuberculosis incidence (n = 185) | Yes | 17.3 | 2.7 | 25 | TST | Unclear | 0.23 (0.02–2.65) |
| Bennet 2013 [13] | Cross sectional | United States | Immigrants (n = 4187) | Yes | 19.7 | 4.2 | 31 | Positive on either TST or QFT | Self-report? | 1.58 (1.13–2.20) |
| Chan-Yeung 2006 [39] | Cross sectional | China | Old age home residents (n = 3605) | No | 46.3 | 22.4 | 82.3 | TST | Medical records | 1.15 (0.97–1.37) |
| Lee 2010 [12] | Cross sectional | Taiwan | Hemodialysis patients (n = 83) | Yes | 38.6 | 26.5 | 58.3 | QFT | Self-report | 0.58 (0.15–2.21) |
| Shu 2012 [25] | Cross sectional | Taiwan | End-stage renal disease (n = 407) | Yes | 22.4 | 25.1 | 61.1 | QFT | Self-report | 0.89 (0.51–1.56) |
| Jackson 2013 [36] | Cross sectional | United Kingdom | Contacts of all active tuberculosis patients and new entrants from high-incidence countries (n = 4730) | Yes | 29.3 | 6 | Unknown, age ≧ 16 | Either T-SPOT. TB or QFT | Self-report | 1.15 (0.88–1.5) |
| Wang 2012 [40] | Cross sectional | Taiwan | Household contacts of pulmonary tuberculosis patients (n = 583) | Yes | 30.2 | 2.9 | 44.7 | T-SPOT.TB | Self –report | 1.01 (0.36–2.84) |
| Ting 2014 [37] | Cross sectional | Taiwan | High-risk and immunocompromised patients (n = 1018) | Yes | 29.1 | 14.4 | 59 | QFT | Interview and medical records | 1.11 (0.75–1.63) |
| Khawcharoenporn 2015 [38] | Cross sectional | Thailand | Human immunodeficiency virus (n = 150) | Yes | 24 | 4 | 40 | TST or QFT | Interview and medical records | 1.82 (0.32–10.53) |
| Suwanpimolkul 2014 [23] | Cross sectional | United States | Immigrants seeking medical attention at a tuberculosis clinic (n = 22227) | Yes | 80.3 | 6.1 | Not clear | TST or IGRA | Medical records | 1.13 (0.97–1.33) |
Abbreviations: DM, diabetes mellitus; IGRA, interferon gamma release assay; LTBI, latent tuberculosis infection; QFT, quantiferon test; T-SPOT.TB, T-SPOT.TB is an enzyme-linked immunospot assay which is a type of interferon gamma release assay; TST, tuberculin skin test.
aThe report by Arnedo-Pena et al contains 2 studies, 1 cross-sectional study at baseline and 1 follow-up cohort study.
bLTBI incidence from the cohort study.
Quality Assessment
The results of quality assessment are summarized Supplementary appendix Tables 1 and 2. The details of the cohort study are described in the following section. All cross-sectional studies applied universal screening and testing for LTBI. The ascertainment of DM was based on universal laboratory testing only in 1 study, by medical chart or physician diagnosis in 5 studies, and by the other methods in 6 studies. Age was adjusted for in 11 of the 12 studies, and all 12 studies adjusted for at least 1 of the other potentially important confounders.
Cohort Study
The only cohort study that was included was conducted in 247 Spanish contacts of pulmonary tuberculosis patients who were IGRA-negative at initial screening [22]. The baseline status of DM was based on self-report. After excluding 49 contacts who were lost to follow-up, 1 in 4 DM patients converted to IGRA-positive during follow-up, compared to 17 conversions in 194 non-DM individuals. In the Poisson regression analysis, DM was associated with a nonsignificant increased risk of LTBI, with an adjusted risk ratio of 4.40 (95% CI, 0.50–38.55; Figure 2) (personal communication).
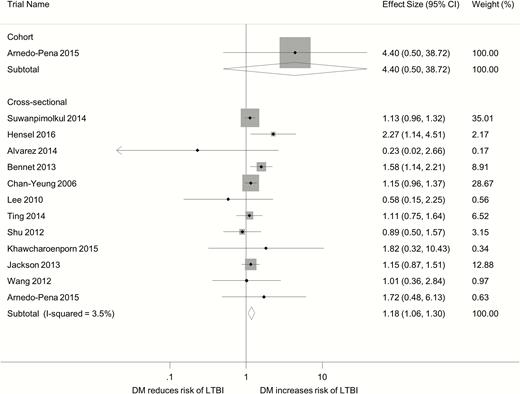
Forest plot of observational studies on diabetes and latent tuberculosis infection. Abbreviations: CI, confidence interval; DM, diabetes mellitus; LTBI, latent tuberculosis infection.
Cross-Sectional Study
The adjusted odds ratio (OR) from the 12 cross-sectional studies revealed no substantial statistical heterogeneity (I2, 3.5%). Overall the DM patients had a moderately increased odds of LTBI (pooled OR, 1.18; 95% CI, 1.06–1.30; Figure 2). In the 11 studies that provided both the crude and adjusted ORs, the crude OR was greater than the adjusted OR in 9 studies, and the ratio of OR ranged from 0.89 to 3.16 (Table 2). The pooled crude OR was 1.64 (95% CI, 1.33–2.02) compared with the pooled adjusted OR of 1.18 (95% CI, 1.07–1.29). This suggests the presence of positive confounding in most cross-sectional studies.
Crude and Adjusted Odds Ratios From 11 Cross-Sectional Studies That Reported Both Crude and Adjusted Odds Ratios
| Study | Crude OR (95% CI) | Adjusted OR (95% CI) | Ratio of OR | Adjusted Variables |
|---|---|---|---|---|
| Lee 2010 [12] | 1.83 (0.64, 5.24) | 0.58 (0.15, 2.21) | 3.16 | Age, gender, dialysis vintage |
| Bennet 2013 [13] | 3.33 (2.44, 4.52) | 1.58 (1.13, 2.20) | 2.11 | Birth region, age, gender, education, malignancy, HIV, end-stage renal disease, smoking |
| Wang 2012 [40] | 2.11 (0.80,5.55) | 1.01 (0.36, 2.84) | 2.09 | Sex, age, index smear positivity |
| Arnedo-Pena 2015 [22] | 2.57 (0.87, 7.62) | 1.71 (0.48, 6.08) | 1.50 | Age, sex, smoking |
| Jackson 2013 [36] | 1.45 (1.13, 1.86) | 1.15 (0.88, 1.5) | 1.26 | Age (further adjustment for sex, ethnicity, birthplace outside United Kingdom, previous contact with tuberculosis cases or previous tuberculosis history did not change the estimate) |
| Suwanpimolkul 2014 [23] | 1.40 (1.20, 1.63) | 1.13 (0.97, 1.33) | 1.24 | Age (cut-point, 45 years), HIV status, place of birth |
| Shu 2012 [25] | 1.09 (0.64, 1.86) | 0.89 (0.51, 1.56) | 1.22 | Age, gender, old tuberculosis, smoking |
| Chan-Yeung 2006 [39] | 1.38 (1.18, 1.61) | 1.15 (0.97, 1.37) | 1.2 | Age, marital status, education, place of birth, smoking, drug abuse, past tuberculosis, cardiovascular disease, arthritis, fracture, ischemic heart disease, COPD, cancer, liver disease, BMI, feeding method, Norton score |
| Ting 2014 [37] | 1.22 (0.84, 1.77) | 1.11 (0.75, 1.63) | 1.10 | Age, sex, BCG vaccination, smoking, COPD, fibrocalcified lesion in chest plain film |
| Hensel 2015 [14] | 2.19 (1.22, 3.94) | 2.27 (1.15, 4.48) | 0.96 | Age, sex, BMI, smoking status, vitamin D level, tuberculosis incidence in country of origin |
| Khawcharoenporn 2015 [38] | 1.62 (0.28, 9.22) | 1.82 (0.32, 10.53) | 0.89 | Sex, smoking |
| Pooled odds ratio | 1.64 (1.33, 2.02) | 1.18 (1.07, 1.29) | 1.39 |
Abbreviations: BCG, bacillus calmette-guerin; BMI, body mass index; CI, confidence interval; COPD: chronic obstructive pulmonary disease; HIV, human immunodeficiency virus; OR, odds ratio.
Subgroup Analysis and Publication Bias
In the subgroup analysis, there was no statistically significant difference across different subgroups based on risk of bias, host immunity, study region, and method of LTBI diagnosis (Table 3). With respect to the method of DM diagnosis, the only study that used universal laboratory screening for DM reported a higher OR (2.27; 95% CI, 1.14–4.51) than the other studies (pooled OR, 1.16; 95% CI, 1.05–1.27), although the difference was statistically insignificant (P = .086). The funnel plot of the ORs from cross-sectional studies showed no evidence of asymmetry by visual inspection; both the Egger’s test (P = .982) and the Begg’s test (P = .631) suggested no statistical evidence of publication bias (Supplementary Appendix Figure 1).
Subgroup Analysis by Study-Level Factors in the 12 Cross-Sectional Studies
| Measure or Outcome | Study Characteristic (Number of Studies) | Summary Estimate (95% CI) | I2 | Meta-Regression |
|---|---|---|---|---|
| P Value | ||||
| Selection bias: selection of participants | Low risk (n = 1) High risk (n = 11) | 1.15 (0.97, 1.36) 1.20 (1.04, 1.38) | NA 11.2 | .807 |
| Measurement bias: ascertainment of diabetes mellitus | Laboratory confirmed (n = 1) Others (n = 11) | 2.27 (1.14, 4.51) 1.16 (1.05, 1.27) | NA 0 | .086 |
| Measurement bias: ascertainment of LTBI | Low risk (n = 12) High risk (n = 0) | 1.18 (1.06, 1.30) | 3.5 | NA |
| Confounding bias: adjusted for age | Low risk (n = 11) High risk (n = 1) | 1.18 (1.05, 1.32) 1.82 (0.32, 10.43) | 10.4 0 | .649 |
| Confounding bias: adjusted for other variables | Low risk (n = 12) High risk (n = 0) | 1.18 (1.06, 1.30) | 3.5 | |
| Population | Immunocompromised (n = 4) Nonimmunocompromised (n = 8) | 1.02 (0.75, 1.39) 1.22 (1.06, 1.39) | 0 22.5 | .378 |
| Study region | Asia (n = 6) North America (n = 4) Europe (n = 2) | 1.11 (0.96, 1.30) 1.39 (0.96, 2.02) 1.17 (0.90, 1.53) | 0 63.7 0 | .511 |
| LTBI diagnostics | Either TST or IGRA (n = 4) IGRA (n = 6) TST (n = 2) | 1.27 (1.02, 1.58) 1.15 (0.92, 1.43) 0.83 (0.24, 2.95) | 20.8 11.4 39.4 | .730 |
| LTBI prevalence | ≧30% (n=5) <30% (n=7) | 1.16 (1.00, 1.35) 1.22 (1.02, 1.46) | 17.8 4.0 | .621 |
Abbreviations: CI, confidence interval; IGRA: interferon gamma release assay; LTBI, latent tuberculosis infection; NA, not available; TST, tuberculin skin test.
DISCUSSION
Our systematic review included 13 observational studies and revealed that DM was associated with an increased risk of LTBI. The only cohort we identified revealed a nonsignificant increased risk of LTBI among diabetics (risk ratio, 4.40; 95% CI, 0.50–38.55). For the cross-sectional studies, the pooled OR was 1.18 (95% CI, 1.06–1.30). The small prevalence OR implies a limited incremental gain if DM patients are targeted for LTBI screening. For example, if the prevalence of LTBI is 20.0% in the nondiabetic population, the expected prevalence of LTBI in the DM population would be 22.8% (Table 4).
Expected Prevalence of Latent Tuberculosis Infection and Number Needed to Screen in the Diabetic Population Under Different Background Prevalences of Latent Tuberculosis Infection (LTBI) in the Nondiabetic Population
| Prevalence of latent tuberculosis infection | |||||
|---|---|---|---|---|---|
| Background prevalence of LTBI in the non-DM population (%) | 10.0 | 20.0 | 30.0 | 40.0 | 60.0 |
| Expected prevalence of LTBI if DM population is screened (%) | 11.6 | 22.8 | 33.6 | 44.0 | 63.9 |
| Number needed to screen in DM population | 8.6 | 4.4 | 3.0 | 2.3 | 1.6 |
The prevalence odds ratio is set to 1.18 based on the present metaanalysis.
Abbreviations: DM, diabetes mellitus;LTBI, latent tuberculosis infection.
The association between DM and LTBI has been hypothesized previously, but evidence from epidemiologic studies has been limited [3]. In a previous systematic review, 4 cross-sectional studies on DM and LTBI were identified, but 3 of them reported only the crude OR. Pooling the ORs from the 4 studies, the authors found no evidence of a significant association between DM and LTBI (pooled OR, 1.01; 95% CI, 0.78–1.31) [24]. Our updated systematic review identified 13 observational studies that provided adjusted effect estimates and added to the knowledge regarding the impact of DM on LTBI.
The risk of bias analysis revealed several methodological concerns in the existing literature, and these concerns should be carefully considered before the results are interpreted. First, the majority of existing studies are cross-sectional studies, which suffer from the temporality issue between DM and LTBI. Since it is unlikely that LTBI can lead to the occurrence of DM, the incidence of DM is expected to be the same in the LTBI and non-LTBI groups. Therefore, the temporality issue would tend to bias the association between DM and LTBI toward the null. In addition, most of the cross-sectional studies excluded cases of current active tuberculosis (and sometimes previous active tuberculosis as well). If DM increases the risk of progression from LTBI to active TB, exclusion of active tuberculosis from the study population would differentially remove the LTBI individuals with DM, causing a downward bias (smaller OR) on the association between DM and LTBI (Figure 3).
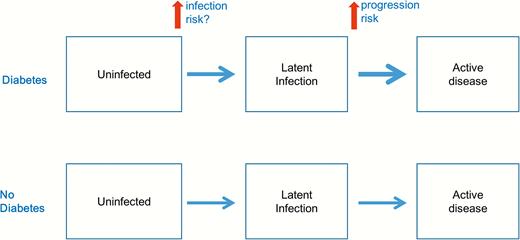
Possible effects of diabetes on the natural history of tuberculosis.
Another issue with selection is the restriction of study participants to a high-risk group that can be caused by DM. For example, 2 of the included studies were conducted in patients with end-stage renal disease, which can be an intermediate variable on the causal pathway between DM and LTBI [12, 25]. Restricting the analysis to an intermediate variable would result in overadjustment bias, attenuating the causal effect of an exposure [26].
The second methodological concern is the measurement bias. In terms of DM measurement, all except for 1 [14] of the included studies used self-report or medical record to verify the status of DM, rather than conducting universal screening tests in all participants. DM is a disease that is often underdiagnosed and undertreated. A previous review found that nearly 50% of adult DM patients were undiagnosed globally, ranging from 24% to 75% across regions [27]. The underdiagnosis of DM would likely result in nondifferential misclassification of DM, biasing the DM-LTBI association toward the null. Indeed, we found that the only study that used universal laboratory screening for DM [14] reported a stronger association than the other studies (Table 3). The Hensel et al study revealed a dose-response pattern between DM status and LTBI prevalence, with the prevalence of LTBI increasing from 25.9% in nondiabetics to 39.1% in prediabetics and to 43.4% in diabetics. If the findings from the Hensel et al study can be replicated in future studies, the incremental gain of screening diabetics might be higher than the figures provided in Table 4.
On the other hand, TST and IGRA (or both) were used to ascertain the status of LTBI in all studies. Previous studies suggested that DM patients may have a lower interferon gamma release compared with non-DM individuals, and the TST may have a lower sensitivity in DM patients, although the results from the literature were inconsistent [28, 29]. This differential misclassification of LTBI with respect to DM status would decrease the OR between DM and LTBI. Also, there were concerns that the positivity of TST and IGRA cannot ensure the diagnosis of LTBI [30]. In the present review, the DM–LTBI association was not different by different diagnostic method (Table 3).
Last but not the least, confounding bias is a methodological concern of the included studies. We consider age as the most important potential confounding factor, since it is often positively associated with both DM and LTBI. When we compared the crude and adjusted ORs in studies that reported both, the pooled crude OR (1.64; 95% CI, 1.33–2.02) was substantially larger than the pooled adjusted OR (1.18; 95% CI, 1.07–1.30). This justifies our exclusion of studies that only reported the crude OR during the study selection process. Of the 12 cross-sectional studies in the review, 11 adjusted for age and 12 adjusted for important covariates other than age. However, we cannot rule out the possibility of unmeasured confounding, which is always a concern in all observational studies.
Considering all methodological limitations of the included studies, the temporality bias, the selection bias, and the misclassification bias would reduce the positive association between DM and LTBI. On the other hand, the confounding bias (especially by age) would result in a spuriously positive association. Since the majority of included studies adjusted for age as well as some other major confounding variables, we think the overall direction of biases in these studies would reduce the positive association between DM and LTBI. Our review therefore supports an increased risk of LTBI among DM patients, although the magnitude of association cannot be quantified. On the other hand, if the outcome of interest is the true prevalence of LTBI in DM vs non-DM individuals, the 12 cross-sectional studies in our review provide useful information on this comparison. In this case, the temporality issue and exclusion of active tuberculosis cases would not cause bias.
In a previous metaanalysis, Jeon and Murray found that DM was associated with a 3-fold risk of active tuberculosis disease [7]. It was commonly hypothesized that the increased risk of active tuberculosis among diabetics was related to the higher risk of progression from latent infection (Figure 3). Our findings suggest that DM may also increase the risk of LTBI, although the magnitude of association between DM and LTBI seems to be smaller than that between DM and active TB.
Recent laboratory studies provide support for the biological plausibility of the DM–LTBI association. After the inhalation of M. tuberculosis bacilli, alveolar macrophages in the lung are the first defense mechanism against mycobacterial invasion [5]. Failure of clearance of M. tuberculosis in alveolar macrophages may lead to bacterial replication and further spreading [31]. It has been found that DM mice had a delayed and impaired innate immune response to the invasion of M. tuberculosis; evidence for impaired innate response was also found in DM patients [32, 33]. In addition, DM patients had defects in serum complement factors, allowing M. tuberculosis to invade into mononuclear phagocytes and achieve intracellular survival [34]. Further laboratory studies are warranted to better characterize the immunological responses in DM patients against M. tuberculosis invasion.
In addition to the biological plausibility, there are also nonbiological pathways through which DM may lead to an increased risk of LTBI. Diabetic patients tend to visit healthcare facilities more frequently than nondiabetic individuals. These patients might therefore be more likely to be exposed to patients with infectious tuberculosis in the healthcare settings because of frequent healthcare visit [35]. In addition, lower socioeconomic status can be a risk factor for both DM and TB. As a result, diabetic patients may also have more frequent exposure to tuberculosis because of the network dynamics.
A major strength of our study is that it includes a large number of participants. Previous studies that revealed a positive association between DM and LTBI usually failed to reach statistical significance [36–38]. This can be attributed to the lack of power to detect the differences in most studies.
Our review also has limitations. First, all except for 1 of the included studies were cross-sectional. We have carefully examined all the potential biases in these cross-sectional studies and found that existing literature supported a positive causal association between DM and LTBI. Second, we were not able to assess the relationship between glycemic control and risk of LTBI because data on glycemic control were not available in most studies. Third, we excluded studies that only reported crude effect estimates. Although we tried to contact the authors to obtain adjusted effect estimates, we had to exclude 14 studies because of no response from the authors.
In the recently published WHO guideline on the management of LTBI in low-burden countries, systematic testing for LTBI in people with DM was not recommended [4]. However, this recommendation was a conditional recommendation with very low quality of evidence. The potential impact of an LTBI screening program depends on both the yield (number needed to screen) of LTBI screening in the target population and the number needed to treat to prevent 1 case of active tuberculosis among screen-positive individuals. Our review provides the most updated evidence of the association between DM and LTBI prevalence and indicates the possible low yield of screening LTBI among DM patients in a low-burden setting (Table 4). Our results could be used to inform future cost-effectiveness analysis on the impact of LTBI screening programs among diabetics.
In conclusion, our review adds to the cumulating evidence on the effect of DM on the natural history of tuberculosis. The result suggests that DM not only increases the risk of progression to active tuberculosis disease but also increases the risk of LTBI. In addition, the findings from the review could be used to evaluate the potential impact of targeted LTBI screening among the diabetic population.
Supplementary Data
Supplementary materials are available at Clinical Infectious Diseases online. Consisting of data provided by the authors to benefit the reader, the posted materials are not copyedited and are the sole responsibility of the authors, so questions or comments should be addressed to the corresponding author.
Notes
Author contributions. L. M. R., H. Y. P., K. Y. T., L. C. H., and S. Y. J. wrote the first draft of the manuscript. L. M. R., H. Y. P., and K. Y. T. searched the databases and extracted the data. L. M. R. and L. H. H. evaluated the risk of bias. L. M. R. and H. Y. P. did the statistical analysis. S. C. C., W. J. Y., K. J. C., Y. C. J. and L. H. H. critically revised the manuscript. All authors contributed to the final version of the manuscript.
Potential conflicts of interest. All authors: No potential conflicts of interest. All authors have submitted the ICMJE Form for Disclosure of Potential Conflicts of Interest. Conflicts that the editors consider relevant to the content of the manuscript have been disclosed.
References
Author notes
Correspondence: H.-H. Lin, Institute of Epidemiology and Preventive Medicine, College of Public Health, National Taiwan University, 17 Xuzhou Rd, Rm 706, Taipei 10055, Taiwan ([email protected]).

