


Abstract
Background. The Veterans Health Administration (VHA) introduced the Methicillin-Resistant Staphylococcus aureus (MRSA) Prevention Initiative in March 2007. Although the initiative has been perceived as a vertical intervention focusing on MRSA, it also expanded infection prevention and control programs and resources. We aimed to assess the horizontal effect of the initiative on hospital-onset (HO) gram-negative rod (GNR) bacteremia.
Methods. This retrospective cohort included all patients who had HO bacteremia due to Escherichia coli, Klebsiella species, or Pseudomonas aeruginosa at 130 VHA facilities from January 2003 to December 2013. The effects were assessed using segmented linear regression with autoregressive error models, incorporating autocorrelation, immediate effect, and time before and after the initiative. Community-acquired (CA) bacteremia with same species was also analyzed as nonequivalent dependent controls.
Results. A total of 11 196 patients experienced HO-GNR bacteremia during the study period. There was a significant change of slope in HO-GNR bacteremia incidence rates from before the initiative (+0.3%/month) to after (–0.4%/month) (P < .01), while CA GNR incidence rates did not significantly change (P = .08). Cumulative effect of the intervention on HO-GNR bacteremia incidence rates at the end of the study period was estimated to be −43.2% (95% confidence interval, −51.6% to −32.4%). Similar effects were observed in subgroup analyses of each species and antimicrobial susceptibility profile.
Conclusions. Within 130 VHA facilities, there was a sustained decline in HO-GNR bacteremia incidence rates after the implementation of the MRSA Prevention Initiative. As these organisms were not specifically targeted, it is likely that horizontal components of the initiative contributed to this decline.
Hospital-onset (HO) bacteremia is one of the most serious healthcare-associated (HCA) infections and a major cause of morbidity and mortality, despite the advancement of medical care. Gram-negative rods (GNRs) are responsible for approximately 25%–30% of HO bacteremia in previous studies [1, 2], and have recently become particularly problematic due to emerging drug resistance combined with lack of investment in antimicrobial drug discovery.
To prevent transmission of bacteria within healthcare settings, the general infection prevention strategies have been divided into 2 domains: vertical and horizontal [3–5]. Vertical approaches target specific pathogens through active surveillance, followed by measures, such as contact precautions, to prevent transmission from colonized or infected patients to others. Horizontal approaches aim to reduce risks of transmission by implementing standard practices, such as hand hygiene, which are broadly effective across many possible pathogens. Although the 2 general approaches are not mutually exclusive, certain programs favor vertical approaches while others support horizontal approaches. During the past decade, few programs have implemented vertical approaches for multidrug-resistant (MDR) GNRs given the difficulty and expense of detecting these pathogens with surveillance testing and the lack of evidence supporting targeted prevention strategies. In contrast, there has been greater interest in implementing vertical strategies for methicillin-resistant Staphylococcus aureus (MRSA).
The Veterans Health Administration (VHA) introduced the MRSA Prevention Initiative in 2007, which mandated implementation of a comprehensive evidence-based bundle at all facilities, including active screening and isolation for MRSA and increased infection prevention resources [6–8]. This initiative has largely been seen as an organism-specific (vertical) intervention focusing on MRSA. However, it also included many horizontal components with generalizable effects, such as emphasis on hand hygiene, expanded educational activities, cultural transformation, and increased human resources for infection prevention staff. The nationwide expansion of infection control programs through implementation of this initiative provided the unique opportunity to explore and quantify the initiative's horizontal effect on transmission of HCA pathogens beyond MRSA, which were not directly targeted.
We hypothesized that the horizontal components of the initiative had reduced HO-GNR bacteremia, and aimed to quantify the effect by interrupted time-series analysis. To strengthen our analyses, we also analyzed community-acquired (CA) GNR bacteremia without recent healthcare exposures as nonequivalent dependent controls, as community infections would not be reduced through specific components of the initiative. If the MRSA Prevention Initiative had positive effects beyond MRSA reductions, as well as Clostridium difficile infections and vancomycin-resistant Enterococcus infections [6], this would strengthen the case for the cost-effectiveness of the program.
METHODS
The institutional review board (IRB) of the University of Iowa and Iowa City Veterans Affairs Health Care System approved this study. Waiver for informed consent was granted by the IRB for this retrospective cohort.
Definitions
Bacteremia episodes were classified as CA, HCA, and hospital-onset (HO) bacteremia according to previously published and standardized definitions [9, 10]. The episode was considered to be HO bacteremia when the patient had been in the hospital for 48 hours or longer at the specimen collection time of the first positive blood culture. Among episodes which did not meet criteria for HO bacteremia, HCA bacteremia was defined as when the patient (1) had been admitted to an acute care facility within 90 days prior to the bacteremia episode; (2) was a resident of a nursing home or rehabilitation facility; (3) was on renal replacement therapy; or (4) received wound care or specialized nursing care either in an outpatient setting or at home in the 30 days prior to the onset of bacteremia. If the patient did not meet any of the above criteria, the episode was classified as CA bacteremia.
Multidrug resistance was defined by interim standard definitions, proposed by an expert panel of the European Centre for Disease Prevention and Control and the US Centers for Disease Control and Prevention [11]. In brief, multidrug resistance was defined as acquired nonsusceptibility to at least 1 agent in 3 or more antimicrobial categories.
Study Population
We conducted a retrospective observational cohort study of all veterans who were admitted to acute care wards and units at 130 VHA hospitals in 48 continental states and the District of Columbia in the United States and Puerto Rico from January 2003 through December 2013, who had positive blood cultures for Escherichia coli, Klebsiella species, or Pseudomonas aeruginosa. We decided to include these 3 species a priori, because previous studies consistently showed that these 3 organisms represent the majority of GNR bacteremia across various healthcare settings [10, 12–18]. We obtained data through Veterans Affairs Informatics and Computing Infrastructure, which includes data extracted from VHA's integrated electronic medical record system. If a patient had multiple positive blood cultures of the same species during a single hospital admission, we included only the first isolate in the analysis. To estimate the population at risk for bacteremia, we identified monthly patient-days of acute inpatient care units (inpatient denominator for HO bacteremia) and numbers of unique patients who received any healthcare (outpatient denominator for CA bacteremia) within the VHA system.
Acute inpatient capacities ranged from 10 to 260 beds, and total acute inpatient capacity was approximately 10 000 operating acute beds including 1900 authorized intensive care unit (ICU) beds [19]. We excluded stays in mental health, rehabilitation, and nursing home care units as inpatient care, and bacteremia episodes that occurred in these units were considered HCA bacteremia.
Study Design
To analyze the effect of the initiative, we used a quasi-experimental interrupted time-series analysis [20]. We analyzed data of HO-GNR bacteremia to assess the horizontal effects of the initiative, as the implementation of the initiative primarily focused on inpatient units. We also analyzed data of CA-GNR bacteremia as a nonequivalent dependent control group, as these patients experienced bacteremia with the same organisms and would be subject to the same background secular trends as HO infections but in a setting that was not specifically targeted by the initiative. Because the implementation at the whole facility level could also affect the care outside the acute inpatient units such as nursing home or rehabilitation units at least partially, we did not consider the HCA bacteremia group as controls.
Outcomes were defined as the monthly incidence rates (HO bacteremia: cases per 10 000 patient-days; CA bacteremia: cases per 10 000 person-months). During the study period, data from 132 months (50 before and 74 after implementation) were available for analysis.
Intervention
Major components of the MRSA Prevention Initiative are summarized in Table 1 including 2 MRSA-specific vertical interventions and 6 horizontal interventions. Beginning in March 2007, VHA provided funds to each medical facility for educational materials and a newly created position, the MRSA Prevention Coordinator (MPC). Hospital leadership teams were responsible for implementation and required to provide adequate supports and resources to infection control team at all facilities. The MPC at each facility oversaw local implementation, collected and reported data of MDR organisms and hand hygiene compliance at that facility, provided feedback to frontline healthcare workers, and dealt with local challenges. Positive deviance approach was also promoted as a cultural transformation strategy [21, 22]. A prior study reported that the successful implementation of this initiative was associated with substantial decline of HCA MRSA infections [6]. By October 2007, all facilities were required to complete implementation of the initiative within all acute care units, and a similar intervention was implemented in long-term care units in late 2008.
Components of the Veterans Health Administration Methicillin-Resistant Staphylococcus aureus Prevention Initiative
| Strategies | Domains | Interventions | Comments |
|---|---|---|---|
| Vertical Interventions | MRSA-specific interventions | Active surveillance screening | Nasal MRSA swab screening for all patients admitted to the hospital, all patients transferred from one unit to another, and all patients discharged from the hospital |
| Contact precaution | Contact precautions for all patients with positive MRSA screening or infection with MRSA | ||
| Horizontal Interventions | Expansion of local human resources | MPC position | MPC positions were created at all VHA facilities to oversee implementation, collect and report data, and provide feedback to frontline providers in collaboration with infection preventionists |
| Cultural transformation | “Positive deviance” approach | Recommended problem-solving approaches based on the observation that certain community persons/groups with uncommon behaviors or strategies enable them to find better problem solutions | |
| Emphasis on hand hygiene | Hand hygiene was strongly emphasized as a cultural transformation process, as “infection prevention is everyone's responsibility” | ||
| Educational resources | Training resources for MPCs | Training materials, conference calls, and webinars were made available for MPCs | |
| Patient education materials | Templates and sample documents for patient education materials of infection prevention were made available for all facilities | ||
| Leadership involvement | Clarification of leadership responsibility | VA guidance documents from central office clearly stated that facility directors and clinical executive teams are responsible for implementation and adequate resources procurement for infection prevention team. The initiative was also incorporated into leadership performance measurement system. |
Abbreviations: MPC, multidrug-resistant organism prevention coordinator; MRSA, methicillin-resistant Staphylococcus aureus; VA, Veterans Affairs; VHA, Veterans Health Administration.
Statistical Analysis
Segmented linear regression with autoregressive error models were fit to account for baseline trends, autocorrelation, seasonality, and trends before and after the implementation of the initiative [23–26]. Times before and after implementation were incorporated into the model development as independent variables to assess the significance. A dummy variable for the completion of implementation was also included to detect intercept changes (ie, immediate changes). For HO bacteremia, we also considered monthly mean length of stay as a possible independent variable. Model diagnostics, including autocorrelation functions and residual plots, were considered to ensure the appropriateness of all models. Slopes of trends and intercept changes were calculated as relative effects compared to the point estimates at the beginning of each period. The overall effect of the intervention was estimated as the relative value of the point estimates with coefficients of intercept change and postintervention slope, compared to point estimates without them. To estimate 95% confidence intervals (CIs) of relative changes, we used bootstrapping methods proposed by Zhang and colleagues [26].
We also hypothesized that there might be differential effects on incidence rates for each of the 3 bacterial species or antimicrobial susceptibility patterns (MDR vs non-MDR), and conducted multiple subgroup analyses. We performed the all analyses using SAS/ETS version 9.3 software (SAS Institute, Cary, North Carolina).
RESULTS
Study Population Demographics
From January 2003 to December 2013, VHA provided >30 million patient-days of acute inpatient care. Demographic characteristics of the VHA population are summarized in Table 2. The number of hospital admissions increased by approximately 16% over the 11-year study period, while patient-days decreased from 2.8 million in 2003 to 2.6 million in 2013. The mean age of patients who utilized VHA as a care provider was stable during the study period.
Demographic Characteristics of Veterans Health Administration Acute Care Patient Population, 2003–2013
| Characteristic | 2003 | 2004 | 2005 | 2006 | 2007 | 2008 | 2009 | 2010 | 2011 | 2012 | 2013 |
|---|---|---|---|---|---|---|---|---|---|---|---|
| Outpatient care | |||||||||||
| No. of unique patients who received carea | 4357 | 4532 | 4623 | 4705 | 4719 | 4784 | 4945 | 5083 | 5193 | 5281 | 5355 |
| Male sex | 91.8% | 92.0% | 91.7% | 91.5% | 91.3% | 90.9% | 90.9% | 90.8% | 90.7% | 90.4% | 90.2% |
| Mean age | 61.5 | 61.7 | 61.7 | 61.8 | 61.6 | 61.4 | 61.1 | 61.0 | 60.9 | 60.7 | 60.6 |
| Inpatient care | |||||||||||
| Hospital admissionsa | 470 | 481 | 489 | 492 | 498 | 516 | 536 | 549 | 552 | 552 | 545 |
| Average LOS, d | 6.0 | 5.8 | 5.6 | 5.5 | 5.4 | 5.3 | 5.1 | 5.0 | 5.0 | 4.8 | 4.8 |
| Patient-daysa | 2805 | 2783 | 2749 | 2718 | 2701 | 2745 | 2747 | 2748 | 2735 | 2675 | 2611 |
Abbreviation: LOS, length of stay.
a In thousands.
Incidence Rates of GNR Bacteremia
A total of 47 480 episodes of GNR bacteremia occurred during the study period. Most patients were male (96.4%). Of GHR bacteremia episodes, 41.7% were CA, 34.8% were HCA, and 23.6% were HO (Table 3). Over the study period, the proportions of CA and HCA increased while HO episodes decreased, especially in the second half of the study period (Ptrend < .01) (Supplementary Figure 1). The overall incidence rate for HO-GNR bacteremia was 3.73 per 10 000 patient-days (E. coli, 1.32; Klebsiella species, 1.50; P. aeruginosa, 0.91), CA-GNR bacteremia was 3.69 per 10 000 patient-years (E. coli, 2.53; Klebsiella species, 0.89; P. aeruginosa, 0.26), and HCA-GNR bacteremia was 3.08 per 10 000 patient-years (E. coli, 1.54; Klebsiella species, 1.00; P. aeruginosa, 0.54).
Demographic Characteristics of Gram-Negative Rod Bacteremia Episodes
| Characteristic | Total | Escherichia coli | Klebsiella spp | Pseudomonas aeruginosa |
|---|---|---|---|---|
| No. of episodes | 47 480 | 25 782 | 14 651 | 7047 |
| Age, y, mean (SD) | 69.1 (12.2) | 69.8 (12.3) | 68.5 (12.1) | 68.5 (11.9) |
| Male sex | 96.4% | 95.3% | 97.3% | 97.9% |
| Place of acquisition | ||||
| Community-acquired | 19 777 (41.7%) | 13 572 (52.6%) | 4791 (32.7%) | 1414 (20.1%) |
| Healthcare-associated | 16 507 (34.8%) | 8254 (32.0%) | 5364 (36.6%) | 2889 (41.0%) |
| Hospital-onset | 11 196 (23.6%) | 3956 (15.3%) | 4496 (30.7%) | 2744 (38.9%) |
Refer to “Methods” section for definitions of community-acquired, healthcare-associated, and hospital-onset bacteremia.
Abbreviation: SD, standard deviation.
Effect of the MRSA Prevention Initiative on GNR Bacteremia Incidence Rates
When fitting a line through the monthly incidence rates of HO-GNR bacteremia over time, there was a visible change of the trend after October 2007, when the initiative implementation was completed (Figure 1A), whereas change in CA-GNR bacteremia was less obvious (Figure 1B). Autoregressive models showed a significant increase in incidence rates of HO-GNR bacteremia prior to implementation of the initiative (+0.3%/month) and a significant decrease after the implementation (–0.4%/month), with a statistically significant change in slope (P < .01) but no significant change in intercept (Table 4). During the same study period, there was not a statistically significant change in intercept or change in slope (P = .25 and P = .08, respectively) in CA-GNR incidence rates. Combining effects of changes in slopes and intercept changes, we estimated a 43.3% (95% CI, −51.6% to −32.4%) relative reduction in HO-GNR bacteremia compared to a 14.8% reduction (95% CI, −27.2% to 1.4%) in CA-GNR bacteremia over the same time period. Monthly mean length of stay was not a significant predictor for HO-GNR incidence rates and did not improve model fit; therefore, it was excluded from final models.
Effect of the Initiative on Changes in Incidence Rates
| Type of Infection | Immediate Change (95% CI) | P Value for Immediate Change | Estimated Slope per Month (95% CI) | P Value for Slope Change | Estimated Relative Effect at the End of Study Period (95% CI) | |
|---|---|---|---|---|---|---|
| Hospital-onset | −4.8% (−11.6 to 2.8) | .18 | Preimplementation | +0.3% (0.1 to 0.5) | <.0001 | −43.2% (−51.6 to −32.4) |
| Postimplementation | −0.4% (−0.5 to −0.3) | |||||
| Community-acquired | −4.0% (−10.8 to 3.5) | .25 | Preimplementation | +0.1% (0.0 to 0.3) | .08 | −14.8% (−27.2 to 1.4) |
| Postimplementation | +0.0% (−0.2 to 0.1) | |||||
| Subgroup analysis by species | ||||||
| Escherichia coli | ||||||
| Hospital-onset | −3.1% (−14.5 to 10.3) | .62 | Preimplementation | +0.3% (−0.1 to 0.7) | .02 | −28.5% (−44.3 to −3.8) |
| Postimplementation | −0.1% (−0.4 to 0.0) | |||||
| Community-acquired | −4.7% (−12.0 to 3.6) | .18 | Preimplementation | +0.2% (0.0 to 0.4) | .02 | −19.2% (−31.6 to −2.6) |
| Postimplementation | −0.1% (−0.2 to 0.1) | |||||
| Klebsiella spp | ||||||
| Hospital-onset | −9.6% (−18.0 to −0.1) | .02 | Preimplementation | +0.4% (0.2 to 0.8) | <.0001 | −51.8% (−60.3 to −40.5) |
| Postimplementation | −0.4% (−0.6 to −0.3) | |||||
| Community-acquired | −5.8% (−17.1 to 8.6) | .33 | Preimplementation | +0.2% (−0.2 to 0.5) | .60 | −10.8% (−29.9 to 27.9) |
| Postimplementation | +0.1% (−0.1 to 0.3) | |||||
| Pseudomonas aeruginosa | ||||||
| Hospital-onset | −3.1% (−15.6 to 11.8) | .63 | Preimplementation | +0.1% (−0.2 to 0.5) | <.001 | −50.3% (−64.3 to −26.6) |
| Postimplementation | −0.6% (−0.8 to −0.4) | |||||
| Community-acquired | +7.4% (−12.0 to 32.8) | .47 | Preimplementation | −0.2% (−0.6 to 0.2) | .98 | +9.9% (−34.4 to 173.4) |
| Postimplementation | −0.3% (−0.5 to 0.1) | |||||
| Subgroup analyses by MDR/non-MDR | ||||||
| MDR | ||||||
| Hospital-onset | −19.8% (−27.6 to 11.0) | <.0001 | Preimplementation | +1.0% (0.6 to 1.5) | <.0001 | −63.6% (−69.7 to −56.1) |
| Postimplementation | −0.4% (−0.6 to −0.3) | |||||
| Community-acquired | −6.3% (−17.0 to 6.3) | .30 | Preimplementation | +1.2% (0.7 to 2.0) | <.0001 | −37.9% (−48.7 to −23.2) |
| Postimplementation | +0.0% (−0.2 to 0.2) | |||||
| Non-MDR | ||||||
| Hospital-onset | +5.5% (−3.8 to 16.1) | .17 | Preimplementation | −0.1% (−0.3 to 0.1) | <.01 | −19.3% (−36.0 to 6.5) |
| Postimplementation | −0.4% (−0.5 to −0.2) | |||||
| Community-acquired | −3.2% (−12.7 to 4.4) | .38 | Preimplementation | −0.1% (−0.2 to 0.2) | .87 | −4.5% (−24.2 to 17.3) |
| Postimplementation | −0.1% (−0.2 to 0.1) | |||||
Abbreviations: CI, confidence interval; MDR, multidrug-resistant.
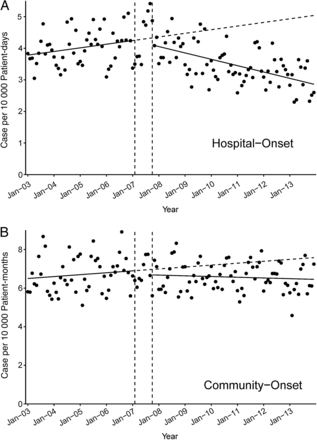
Effect of the Methicillin-Resistant Staphylococcus aureus Prevention Initiative on changes in incidence rates of gram-negative rod bacteremia. Solid slope lines are slopes estimated by autoregressive models; break slope lines are estimated slopes without effects of intervention; vertical break lines are beginning and end of implementation of the initiative.
Subgroup Analyses
In subgroup analyses of each species, models showed significant downward change of the slopes in HO bacteremia episodes due to all species (E. coli, P = .02; Klebsiella species, P < .01; P. aeruginosa, P < .01), with significant intercept decrease (P = .02) in Klebsiella species (Table 4 and Figure 2). During the same period, CA-GNR bacteremia episodes due to Klebsiella species and P. aeruginosa did not have statistically significant changes of the slopes (P = .60 and P = .98, respectively), whereas E. coli had statistically significant declining change of the slope (P = .02). All species in CA-GNR bacteremia episodes had no statistically significant intercept change.
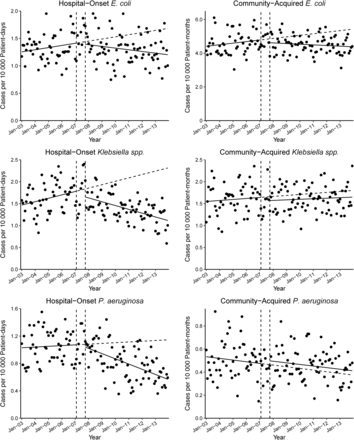
Effect of the Methicillin-Resistant Staphylococcus aureus Prevention Initiative on changes in incidence rates of bacteremia due to each species. Solid slope lines are slopes estimated by autoregressive models; break slope lines are estimated slopes without effects of intervention; vertical break lines are beginning and end of implementation of the initiative.
In subgroup analyses between MDR and non-MDR organisms (Table 4 and Supplementary Figure 2), HO-MDR bacteremia had a significant decline in intercept (−19.8%, P < .0001) and downward change of slopes (from +1.0% per month to −0.4% per month, P < .0001) before and after implementation. HO non-MDR bacteremia had a slight intercept increase (+5.5%, P = .17) followed by a statistically significant change of the slope (from −0.1% per month to −0.4% per month, P < .01), which together suggest a delayed onset of the intervention's effect (estimated cross-point: 17.1 months after the implementation). CA-MDR bacteremia incidence had a significant upward trend before implementation followed by flat incidence rates after implementation. There were no changes in intercept or slope seen in non-MDR CA bacteremia.
DISCUSSION
Over an 11-year period within 130 VHA facilities, we demonstrated that the nationwide infection control program expansion contained with the MRSA Prevention Initiative was strongly associated with a sustained and statistically significant decline in HO-GNR bacteremia rates. Similar declines were not seen in our nonequivalent dependent controls with CA-GNR bacteremia. We estimated the cumulative reduction in HO-GNR bacteremia to be >43%, which was 3 times larger than the 14.8% background reduction seen in CA-GNR bacteremia, despite the fact that these pathogens were not directly targeted by the initiative. Of note, incidence of HCA-GNR bacteremia was stable after the implementation of the initiative (Supplementary Figure 1), so it was unlikely that shifts of care from hospital to outpatient settings could explain the trend in HO-GNR bacteremia. These results strongly suggested that the horizontal components of the initiative, including increased infection control staffing, emphasis on hand hygiene compliance, cultural transformation, and leadership support, had collateral benefits on the epidemiology of HO-GNR bacteremia.
In subgroup analyses of each species, we observed larger reductions in Klebsiella species and P. aeruginosa compared with E. coli. It is possible that these differences were due to the unique microbiologic characteristics of each pathogen including specific infections caused by each pathogen and opportunities to interrupt transmission and/or infections. For example, Klebsiella species and P. aeruginosa are more commonly associated with device-related infections, such as ventilator-associated pneumonia (VAP), central line–associated bloodstream infection (CLABSI), and catheter-associated urinary tract infection (CAUTI) [1, 27, 28]. Therefore, there is a greater potential for reducing infections caused by these organisms through evidence-based interventions [29]. On the other hand, HO E. coli bacteremia is rarely secondary to VAP or CLABSI. Approximately 50% of HO E. coli bacteremia episodes are due to intra-abdominal infections and primary bacteremia, which are not currently considered preventable through standard infection prevention bundles [30].
Additionally, subgroup analyses based on antimicrobial susceptibility showed significant slope changes in both rates of MDR and non-MDR HO bacteremia. This also suggests the universally beneficial effects of the horizontal components of the initiative, as we would expect improved hand hygiene compliance to interrupt transmission of both susceptible and resistant strains of each pathogen. Interestingly, there was a delayed onset of intervention effects on non-MDR pathogens, while there was a significant immediate decline on MDR pathogen incident rates. This may represent an indirect benefit of the vertical component of the Initiative. Jones et al reported that active screening of MRSA and contact isolation of MRSA-positive patients resulted in preemptive isolation of patients with MDR-GNR, even without active surveillance for those organisms [31]. Because MRSA patients are frequently co-colonized with MDR-GNR [31–33], it is possible that the immediate isolation of MRSA patients would have a large immediate effect on MDR-GNR. However, there would be a delay in improving hand hygiene, culture change, and hiring infection prevention staff, so the larger effect on broader targets could be delayed until these horizontal components were in place.
The strength of our approach is that we identified the cohort based on microbiology data without relying on administrative code data (eg, International Classification of Diseases) from a nationwide system of 130 hospitals in diverse settings. Previous studies have found significant limitations in the use of administrative code data to accurately identify sepsis and bacteremia and raised concerns that diagnosis and coding practices could have been changed over time due to other external effects [34–36]. Case identification strategies utilizing microbiologic data eliminates this concern and increases the validity of our findings [37, 38]. Additionally, the large number of data points allowed for utilization of time-series analytical techniques including segmented autoregressive analyses, which improves the internal and statistical validity of our findings [20, 24–26]. Additionally, utilization of CA-GNR bacteremia incidence as a nonequivalent dependent control improves the internal validity of this quasi-experimental observational study.
This study has several limitations. First, because of the retrospective quasi-experimental nature of this study, we cannot exclude the possibility that additional external factors other than the initiative influenced the incidence rates of HO-GNR bacteremia. These external factors could include efforts to prevent other types of hospital-acquired infections, including VAP, CLABSI, and CAUTI. However, we used the most robust and effective design among various available quasi-experimental approaches, and the degree and timing of the effect suggest a strong association between change in incidence and implementation of the initiative. Prevention bundles for CLABSI and VAP were implemented in all ICUs in the VHA system as of April 2006 [39], but we did not see visible effect on HO-GNR bacteremia in our study until the implementation of the initiative. This suggests at least synergistic or augmenting effect of the initiative on other interventions. Second, >95% of patients in this cohort were male, which may limit the generalizability to populations outside VHA. However, a previous study from Olmsted County in Minnesota reported no statistically significant difference of GNR bacteremia incidence rates between sexes [16]. Third, data for improvements of horizontal components, such as hand hygiene compliance rates, were not available. Last, we did not have information regarding the primary source of bacteremia. As we have already discussed, it is possible that the differential effects among the 3 GNR species could be explained by the differences in primary source of infections.
In conclusion, we found a strong association between the continuous and sustained decline of HO-GNR bacteremia and the nationwide implementation of an infection control bundle targeted at MRSA in 130 VHA hospitals. Similar effects were found across different GNR species and antimicrobial susceptibility profiles, which suggests a horizontal benefit beyond the originally intended scope of the initiative. Given our findings, cost-effectiveness analyses of the VHA MRSA Prevention Initiative along with other vertical infection control bundles should also include the added benefits of reduced incidence of infections due to nontargeted pathogens that manifest through the implementation of horizontal components of the bundles.
Notes
Disclaimer. The views expressed in this manuscript are scientific opinions of authors, and do not necessarily reflect the position or policy of the Department of Veterans Affairs. Funding sources had no role in study design, data collection and analysis, decision to publish, or preparation of the manuscript.
Financial support. This work was funded by Department of Veterans Affairs Health Services Research and Development and the Center for the Comprehensive Access and Delivery Research and Evaluation, and supported with resources and the use of facilities of the Iowa City Veterans Affairs Health Care System.
Potential conflicts of interest. E. N. P. has received research funding from Merck & Co, Inc. J. S. M. has received speaker's honoraria from bioMérieux. All other authors report no potential conflicts. All authors have submitted the ICMJE Form for Disclosure of Potential Conflicts of Interest. Conflicts that the editors consider relevant to the content of the manuscript have been disclosed.
References
Author notes
Presented in part: IDWeek 2015, San Diego, California, 26–30 October 2015.

