


Abstract
Information on outcomes of methicillin-susceptible and -resistant Staphylococcus aureus (MSSA and MRSA, respectively) bacteremia, particularly readmission, is scarce and requires further research to inform optimal patient care.
We performed a retrospective analysis using the 2014 Nationwide Readmissions Database, capturing 49.3% of US hospitalizations. We identified MSSA and MRSA bacteremia using International Classification of Diseases, Ninth Revision, Clinical Modification among patients aged ≥18 years. Thirty-day readmission, mortality, length of stay, and costs were assessed using Cox proportional hazards regression, logistic regression, Poisson regression, and generalized linear model with gamma distribution and log link, respectively.
Of 92 089 (standard error [SE], 1905) patients with S. aureus bacteremia, 48.5% (SE, 0.4%) had MRSA bacteremia. Thirty-day readmission rate was 22% (SE, 0.3) overall with no difference between MRSA and MSSA, but MRSA bacteremia had more readmission for bacteremia recurrence (hazard ratio, 1.17 [95% confidence interval {CI}, 1.02–1.34]), higher in-hospital mortality (odds ratio, 1.15 [95% CI, 1.07–1.23]), and longer hospitalization (incidence rate ratio, 1.09 [95% CI, 1.06–1.11]). Readmission with bacteremia recurrence was particularly more common among patients with endocarditis, immunocompromising comorbidities, and drug abuse. The cost of readmission was $12 425 (SE, $174) per case overall, and $19 186 (SE, $623) in those with bacteremia recurrence.
Thirty-day readmission after S. aureus bacteremia is common and costly. MRSA bacteremia is associated with readmission for bacteremia recurrence, increased mortality, and longer hospitalization. Efforts should continue to optimize patient care, particularly for those with risk factors, to decrease readmission and associated morbidity and mortality in patients with S. aureus bacteremia.
Staphylococcus aureus is a major cause of bacteremia in developed countries [1]. The incidence of invasive methicillin-resistant Staphylococcus aureus (MRSA) infection increased substantially during the 1990s to early 2000s [2–5], and it has become a well-recognized community-acquired pathogen as the clones such as USA300 emerged [6]. Although the rate of MRSA infection continues to evolve as infection prevention efforts continue [7], S. aureus bacteremia remains an important cause of mortality and morbidity in the United States [8].
Infections with drug-resistant organisms result in worse outcomes [9]. Higher mortality in patients with MRSA infection has been reported [2, 4, 10–14], although more recent non-US studies did not reproduce the result [15, 16]. While mortality is an important measure of outcome, the unplanned readmission rate within 30 days after discharge has attracted increasing attention as a quality measure [17]. Understanding of readmission can result in improvement in patient care, as a substantial proportion of readmissions may be potentially preventable [18]. Despite the extensive research effort on the mortality outcome, large-scale, population-based data on unplanned readmission in the context of S. aureus bacteremia are lacking from the United States, although awareness of such information, particularly risk factors, can help optimize discharge planning or postdischarge care for these patients.
In this study, we sought to provide population-based estimates of 30-day readmission rates associated with S. aureus bacteremia by methicillin susceptibility in the United States. In parallel, we also assessed mortality, length of stay, and costs.
METHODS
Study Design
We performed a population-based retrospective analysis using the Nationwide Readmissions Database (NRD) from 2014, compiled by the Healthcare Costs and Utilization Project (HCUP) of the Agency for Healthcare Research and Quality [19]. The NRD is a nationally representative database with all payers and the uninsured that allows for studies of readmission, capturing discharge records from the 22 US states (available at the HCUP website, https://www.hcup-us.ahrq.gov/db/availability_public.jsp) that account for 51.2% of the US population and 49.3% of US hospitalizations. Discharges in the NRD are weighted using poststratification on hospital geographic region, rural/urban location, teaching status, bed size, and hospital control as well as patient sex and age, allowing for obtaining national estimates with sampling errors. Records in the NRD with transfer to or from other hospitals within the catchment area are collapsed into one record [19]. HCUP data use agreement training was completed for analyses described herein. Per communication with the institutional review board of the University of Mississippi Medical Center, this study was classified as non–human subjects research.
We identified index cases of S. aureus bacteremia without prior hospitalizations for such diagnosis among discharge records of patients aged ≥18 years from 1 January 2014 to 30 November 2014; patients discharged in December were not eligible for being an index case so that 30-day readmission could be assessed. Staphylococcus aureus bacteremia diagnosis was identified by searching for International Classification of Diseases, Ninth Revision, Clinical Modification (ICD-9-CM) diagnosis codes of 038.12 (MRSA bacteremia) and 038.11 (methicillin-susceptible S. aureus [MSSA] bacteremia) in any of the diagnoses listed in the database. Cases with in-hospital death were excluded from the readmission analysis but were included in all other analyses.
Demographic (sex, primary insurance, hospital teaching/metropolitan status, and quartile classification of median household income of residents in the patient’s zip code), length of stay, and in-hospital death information was collected using the variables provided by the database. Each index case was evaluated for unplanned readmission within 30 days after discharge using the de-identified patient linkage codes provided by the database. Readmissions with S. aureus bacteremia in any of the diagnoses listed in the database were considered to have readmission with S. aureus bacteremia recurrence.
Charlson scores [20] were obtained using an algorithm described elsewhere [21]. We used ICD-9-CM codes to identify the following comorbidities (Supplementary Table 1): human immunodeficiency virus (HIV) infection, hematologic malignancy, brain tumor or malignant solid tumor, hematopoietic stem cell transplant recipients, solid organ transplant recipients, congestive heart failure, diabetes mellitus, chronic pulmonary disease, rheumatologic disorders, and drug abuse. We also identified following coexisting infectious conditions using ICD-9-CM codes (Supplementary Table 1): musculoskeletal infection (osteomyelitis, septic arthritis, pyomyositis, and intraspinal abscess) including those involving prosthesis, skin and soft tissue infection (excluding those with coexisting musculoskeletal infection), infective endocarditis including those involving prosthesis, and central line–associated bloodstream infection.
Costs of hospitalization were estimated using the total charge data in the database and the cost/charge ratio provided by the HCUP, which was derived from all-payer inpatient cost/charge ratio when available, or hospital group average all-payer inpatient cost/charge ratio otherwise. Geometric means of costs, in addition to arithmetic means, were presented to account for the positively skewed nature of cost data, as geometric mean is less influenced by extreme values than arithmetic means.
Statistical Analysis
Bivariate analysis of categorical variables was performed using Pearson χ2 test. The primary exposure of interest was MRSA bacteremia, as compared with MSSA bacteremia. The primary outcome of interest was readmission within 30 days of discharge, which was assessed by developing Cox proportional hazards regression models. Proportional hazards assumption was assessed by developing models including interaction terms between days without readmission and MRSA bacteremia. Secondary outcomes included in-hospital death, length of stay, and costs. In-hospital mortality and length of stay were assessed using logistic regression and Poisson regression, respectively. Comparison of costs was performed by developing generalized linear models with gamma distribution and log link function [22]. We included the following characteristics in the aforementioned regression models to adjust for potential confounding factors: sex, age, primary insurance, quartiles of median household income in the patient’s zip code, hospital teaching/urban status, Charlson score, presence of each of the comorbidities listed above, and coexisting infectious conditions.
Data were analyzed using R software version 3.5.0 (R Foundation for Statistical Computing, Vienna, Austria) and Stata software version 15 (StataCorp, College Station, Texas). Presented values are weighted values accounting for the NRD sampling design, unless otherwise specified. We used a 2-sided significance level of .05 in all analyses.
RESULTS
Between 1 January 2014 and 30 November 2014, we identified 92 089 (standard error [SE], 1905) index cases of S. aureus bacteremia, of which 48.5% (SE, 0.4%; 44 653 cases [SE, 1030]) had MRSA bacteremia (Supplementary Table 2). The majority of the patients with S. aureus bacteremia were male, but female patients were slightly more likely to have MRSA bacteremia (Supplementary Table 2). Patients with MRSA bacteremia tended to be on Medicare or Medicaid, to reside in a lower-income neighborhood, or to be treated in nonteaching hospitals. The rates of MRSA bacteremia were higher in patients with HIV infection, congestive heart failure, and chronic pulmonary disease. MRSA bacteremia was more likely to be accompanied by skin and soft tissue infection or pneumonia, whereas musculoskeletal infection, endocarditis, and central line–associated bloodstream infection were more likely to be present with MSSA bacteremia (Supplementary Table 2). In-hospital death occurred in 13% (SE, 0.2; 11 923 cases [SE, 344]) of patients with S. aureus bacteremia overall, and the death rate in MRSA bacteremia was 14.1% (SE, 0.3) (Supplementary Table 2).
Among those who survived initial S. aureus bacteremia hospitalization, all-cause 30-day readmission occurred in 22% (SE, 0.3) (Table 1), although the rates did not differ significantly between MRSA and MSSA bacteremia cases (Table 2). Patients who had MRSA bacteremia were 17% more likely to have 30-day readmission with S. aureus bacteremia recurrence (hazard ratio, 1.17 [95% confidence interval, 1.02–1.34]) (Table 2).
Characteristics of Staphylococcus aureus Bacteremia by the Presence of Overall Readmission in the United States, 2014
| Characteristic | No Readmission n = 62 539 (SE, 1284) | Readmission n = 17 627 (SE, 424) | Bivariate Analysis | ||
|---|---|---|---|---|---|
| No. (SE) | % (SE) | No. (SE) | % (SE) | P Valuea | |
| MRSA | 29 780 (689) | 47.6 (0.4) | 8587 (259) | 48.7 (0.7) | .12 |
| Demographics | |||||
| Male sex | 24 800 (566) | 39.7 (0.3) | 7416 (192) | 42.1 (0.7) | .003 |
| Age, y | <.001 | ||||
| 18–39 | 8930 (282) | 14.3 (0.3) | 2309 (96) | 13.1 (0.5) | |
| 40–59 | 20 245 (501) | 32.4 (0.4) | 5352 (156) | 30.4 (0.6) | |
| 60–79 | 23 372 (525) | 37.4 (0.4) | 7163 (222) | 40.6 (0.6) | |
| ≥80 | 9992 (260) | 16.0 (0.4) | 2803 (107) | 15.9 (0.5) | |
| Primary insurance | <.001 | ||||
| Private | 11 369 (345) | 18.2 (0.4) | 2572 (113) | 14.6 (0.5) | |
| Public (Medicare or Medicaid) | 45 919 (967) | 73.5 (0.4) | 14 015 (351) | 79.6 (0.6) | |
| Other (including uninsured) | 5167 (202) | 8.3 (0.3) | 1028 (66) | 5.8 (0.6) | |
| Median household income in patient’s zip code | .66 | ||||
| 1st quartile (≤$39 999) | 19 037 (698) | 30.9 (0.8) | 5448 (242) | 31.4 (1.0) | |
| 2nd quartile ($40 000–$50 999) | 17 294 (498) | 28.1 (0.6) | 4745 (171) | 27.3 (0.8) | |
| 3rd quartile ($51 000–$65 999) | 14 014 (423) | 22.8 (0.5) | 4027 (154) | 23.2 (0.7) | |
| 4th quartile (≥$66 000) | 11 180 (484) | 18.2 (0.7) | 3145 (154) | 18.1 (0.8) | |
| Hospital teaching/urban status | <.001 | ||||
| Teaching, urban | 39 822 (1134) | 63.7 (0.9) | 11 595 (379) | 65.8 (1.0) | |
| Nonteaching, urban | 17 224 (510) | 27.5 (0.8) | 4808 (163) | 27.3 (0.9) | |
| Nonteaching, rural | 5493 (319) | 8.8 (0.5) | 1223 (101) | 6.9 (0.6) | |
| Comorbidity | |||||
| Charlson score, median (IQR) | 2 (1–4) | 3 (1–5) | … | ||
| HIV infection | 787 (54) | 1.3 (< 0.1) | 225 (26) | 1.3 (0.1) | .91 |
| HSCT recipients | 139 (21) | 0.2 (< 0.1) | 75 (17) | 0.4 (< 0.1) | .007 |
| SOT recipients | 1131 (80) | 1.8 (0.1) | 503 (42) | 2.9 (0.2) | <.001 |
| Hematologic malignancy | 2074 (106) | 3.3 (0.1) | 822 (53) | 4.7 (0.3) | <.001 |
| Solid organ malignancy | 7842 (245) | 12.5 (0.3) | 2198 (115) | 12.5 (0.5) | .89 |
| Rheumatologic disorders | 2302 (92) | 3.7 (0.1) | 835 (50) | 4.7 (0.3) | <.001 |
| Diabetes mellitus | 25 116 (593) | 40.2 (0.4) | 7693 (215) | 43.6 (0.7) | <.001 |
| Congestive heart failure | 14 905 (398) | 23.8 (0.4) | 5252 (166) | 29.8 (0.6) | <.001 |
| Chronic pulmonary disease | 15 163 (410) | 24.2 (0.4) | 5133 (173) | 29.1 (0.6) | <.001 |
| End-stage renal disease | 9822 (303) | 15.7 (0.4) | 3660 (136) | 20.8 (0.6) | <.001 |
| Drug abuse | 6593 (250) | 10.5 (0.3) | 1952 (100) | 11.1 (0.5) | .22 |
| Coexisting infectious conditions | |||||
| Musculoskeletal infectionb | 12 499 (369) | 20.0 (0.3) | 3291 (138) | 18.7 (0.6) | .02 |
| Skin and soft tissue infection | 12 546 (316) | 20.1 (0.3) | 2764 (101) | 15.7 (0.5) | <.001 |
| Endocarditisb | 6731 (228) | 10.8 (0.3) | 2183 (99) | 12.4 (0.4) | <.001 |
| CLABSI | 9344 (281) | 14.9 (0.3) | 3325 (137) | 18.9 (0.6) | <.001 |
| Pneumonia | 15 150 (372) | 23.6 (0.4) | 4276 (148) | 30.2 (0.4) | .95 |
Abbreviations: CLABSI, central line–associated bloodstream infection; HIV, human immunodeficiency virus; HSCT, hematopoietic stem cell transplant; IQR, interquartile range; MRSA, methicillin-resistant Staphylococcus aureus; SE, standard error; SOT, solid organ transplant.
aP values were obtained using χ2 test.
bIncludes those with prosthetic infections.
Outcomes of Methicillin-resistant Staphylococcus aureus Bacteremia Compared With Methicillin-sensitive S. aureus Bacteremia in the United States
| Outcomes (Regression Methods Employeda) | Results | P Value |
|---|---|---|
| Primary outcomes | ||
| 30-day readmission (Cox proportional hazards regression) | Hazard ratio (95% CI) | |
| All-cause readmission | 1.03 (.98–1.09) | .18 |
| Readmission with bacteremia recurrence | 1.17 (1.02–1.34) | .025 |
| Secondary outcomes | ||
| Odds ratio (95% CI) | ||
| In-hospital mortality (logistic regression) | 1.15 (1.07–1.23) | <.001 |
| Incidence rate ratio (95% CI) | ||
| Length of stay (Poisson regression) | 1.09 (1.06–1.11) | <.001 |
| Cost (generalized linear model with gamma distribution) | Ratio of costs, MRSA/MSSA (95% CI) | |
| Index hospitalization | 1.02 (.99–1.04) | .20 |
| All-cause readmission | 1.03 (.97–1.08) | .32 |
| Readmission with bacteremia recurrence | 1.02 (.89–1.16) | .77 |
Abbreviations: CI, confidence interval; MRSA, methicillin-resistant Staphylococcus aureus; MSSA, methicillin-susceptible Staphylococcus aureus.
aCovariates in adjusted models: sex, age, primary insurance, quartiles of median household income in the patient’s zip code, hospital teaching/urban status, Charlson score, comorbidities, and coexisting infectious conditions.
Figure 1 summarizes the characteristics that attained statistical significance in an association with S. aureus bacteremia recurrence-related 30-day readmission (for more details, including characteristics without statistical significance, see the Supplementary Figure). Endocarditis during the index hospitalization was associated with 30-day readmission with S. aureus bacteremia recurrence, whereas patients with skin and soft tissue infection were less likely to be readmitted (Figure 1). Among comorbidities studied, patients with congestive heart failure, end-stage renal disease, rheumatologic disease, hematologic malignancy, and drug abuse were associated with readmission with S. aureus bacteremia recurrence. The hazards of readmission with S. aureus bacteremia recurrence were higher among patients who were treated in nonteaching urban hospitals (as compared with urban teaching hospitals) (Figure 1).
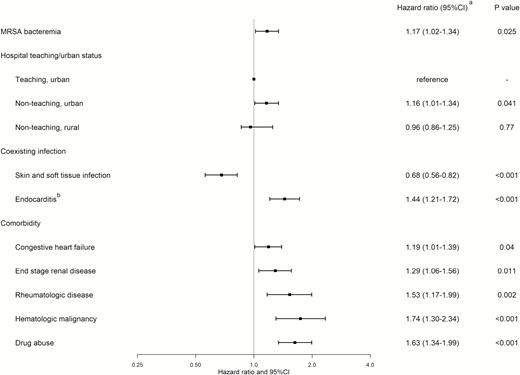
Multivariable analysis of risk factors for 30-day readmission with Staphylococcus aureus bacteremia recurrence (those that attained statistical significance only). aObtained using Cox proportional hazards regression. bIncludes those with prosthetic infections. Abbreviations: CI, confidence interval; MRSA, methicillin-resistant Staphylococcus aureus.
The odds of in-hospital death were 15% greater (odds ratio, 1.15 [95% confidence interval, 1.07–1.23]) with MRSA bacteremia than with MSSA bacteremia on adjusted analysis (Table 2). Length of stay was longer in patients with MRSA bacteremia, compared with MSSA bacteremia (Table 2). Costs of hospitalization were similar between MRSA and MSSA bacteremia overall (Tables 2 and 3). Readmission with S. aureus bacteremia recurrence was more costly than all-cause readmission (Table 3). Overall, geometric means were substantially lower than arithmetic means, indicating positively skewed nature of the cost data. Geometric mean of the overall readmission cost after S. aureus bacteremia hospitalization was $12 425 (SE, $174), and that of readmission with S. aureus bacteremia recurrence was $19 186 (SE, $623).
Cost of Staphylococcus aureus Bacteremia–related Hospitalizations, in 2014 US Dollars
| Type of Hospitalization | MSSA | MRSA | ||
|---|---|---|---|---|
| Geometric Mean (SE) | Arithmetic Mean (SE) | Geometric Mean (SE) | Arithmetic Mean (SE) | |
| Cost of index hospitalization | $23 749 (318) | $37 202 (727) | $23 579 (330) | $37 169 (694) |
| Cost of all-cause 30-day readmission | $12 281 (219) | $20 160 (490) | $12 578 (224) | $20 024 (503) |
| Cost of 30-day readmission with bacteremia recurrence | $18 522 (841) | $30 737 (1787) | $19 850 (841) | $31 064 (1631) |
Abbreviations: MRSA, methicillin-resistant Staphylococcus aureus; MSSA, methicillin-susceptible Staphylococcus aureus; SE, standard error.
DISCUSSION
Using a population-based database, we found that overall 30-day readmission was common and costly among patients surviving initial S. aureus bacteremia hospitalization, occurring in 22%. Although the overall 30-day readmission rates did not differ significantly between MRSA and MSSA bacteremia, MRSA bacteremia had a higher chance of readmission with recurrent bacteremia, particularly in patients with endocarditis, congestive heart failure, end-stage renal disease, underlying immunocompromising comorbidities, and drug abuse. MRSA bacteremia was associated with increased risks for in-hospital death and longer duration of hospital stay.
The 30-day readmission rate of 22% observed in our study is substantially higher than the 13.1% readmission rate reported for elderly Medicare beneficiaries without targeted conditions (myocardial infarction, heart failure, and pneumonia), and is still higher than 17.8% readmission rate in those with targeted conditions [23]. The in-hospital mortality rate of 13% in our study may be lower than some of older studies [13], but was similar to more recent studies [16, 24, 25]. The high readmission rate, along with the in-hospital mortality, indicates the substantial impact of S. aureus bacteremia on the patient outcomes in the United States.
We observed that the overall 30-day readmission rates were similar between MRSA and MSSA bacteremia. Studies have reported higher readmission rates in patients with MRSA carriage [26], or infection [27, 28], as compared with those without. Our study differs from these studies in that we used MSSA bacteremia as the comparison group. No difference in overall readmission rates observed in our study may reflect high readmission rates associated with S. aureus bacteremia itself.
In contrast, MRSA bacteremia was associated with higher likelihood of 30-day readmission with S. aureus bacteremia recurrence. A single-institution study from Australia with data from 1997 to 2007 reported no significant increase in infection-related readmission rate with MRSA bacteremia as compared with MSSA bacteremia, after extensive adjustment effort [16]. Our study differs from the Australian study in several ways, including the setting (US population-based study) and the sample size. As readmission in association with MRSA bacteremia has not been studied extensively, it should continue to be the focus of the future studies, as it may lead to improved discharge planning or postdischarge care in these patients.
In our study, a number of factors were associated with 30-day readmission with S. aureus bacteremia on regression analysis. Infective endocarditis has been associated with high risk of readmission [29] for various causes such as heart failure [30]. Our study result underscores the importance of careful monitoring of patients with endocarditis for treatment failure. On the other hand, the lower readmission risk with S. aureus bacteremia recurrence in patients with skin and soft tissue infection is plausible, considering its typically less severe manifestations. Among comorbidities, conditions associated with compromised immunity such as hematologic malignancy and rheumatologic diseases, as well as drug abuse, tended to have strong associations with higher S. aureus bacteremia readmission risks. Higher readmission risks with chronic kidney disease and congestive heart failure have been described in the setting of various conditions [31, 32].
Although the use of a population-based dataset allowed for studying a large number of patients, the quality of predischarge or postdischarge care of these patients could not be assessed in this study. There is an abundance of data supporting the utilization of infectious disease specialist consultation to improve patient outcome [25, 33–35]. Most of these studies focused on mortality, and a few smaller studies assessed readmission [36, 37]. Optimal interventions to improve readmission remain unclear and should continue to be the focus of future studies.
We found higher mortality associated with MRSA bacteremia, compared with MSSA bacteremia. Past studies have reported higher mortality with MRSA infection [2, 4, 10–14], although recent non-US studies have suggested that the mortality risk associated with methicillin resistance may not be as high as had been reported [15], or can be attributable to confounding factors that increase the likelihood of both death and MRSA infections [16]. Some of the recent US studies with large sample sizes have reported that the mortality rate with MRSA infection may still be higher than with MSSA, although mortality was not the primary focus of those studies [25, 38]. Our study also suggests that MRSA bacteremia is associated with higher mortality in the United States, at the population level.
MRSA bacteremia was associated with longer hospitalization than was MSSA bacteremia. Length of stay has not been extensively studied in this context, but long hospitalization with MRSA infection has been previously reported [28]. Studies with smaller sample size or heterogeneous sample populations including multidrug-resistant organisms have reported no difference in length of stay [9, 39]. Length of stay outcome may not be as important as mortality or readmission, but these data can be useful in designing future quality improvement projects, and should continue to be the focus of future studies.
Readmission after S. aureus bacteremia index hospitalization resulted in substantial costs, particularly when accompanied by recurrent S. aureus bacteremia, considering the reported mean overall cost for US medical hospitalizations of $9100 in 2014 [40]. Our results of hospitalization cost analysis were consistent with the recent study utilizing the US National Inpatient Sample data with regard to the no difference in overall costs between MRSA and MSSA infections [38]. Although our reported arithmetic means of costs were similar to the values in their study, geometric means were lower, indicating the positive skewness of cost data. Our results provide additional information on readmission cost in the context of S. aureus bacteremia, which was substantial. Thus, research into measures contributing to decreased readmission may improve not only patient care and outcomes, but also healthcare expenditure.
Limitations of the Study
First, as in the case of any research using administrative data, we needed to rely on accurate ICD-9-CM coding for identification of cases and characteristics. Although the codes to identify S. aureus bacteremia have been used extensively in various studies [38, 41], the local coding practice can have influence on the accuracy of diagnostic coding, and bias cannot be excluded. Second, the NRD database does not contain records from all states in the United States. The large number of patients covered by the database (50% of all US population) likely mitigates this limitation, but selection bias remains a possibility. Third, there is a possibility that some patients left the catchment area of the database after discharge, which may cause bias in readmission analysis. Moving out of the state after having S. aureus bacteremia within 30 days of discharge is not expected to occur frequently; however, this is a theoretical limitation. Fourth, we were not able to assess the readmission rates in patients who were discharged in the month of December. Although we considered that this would not affect the conclusions, this is a potential source of bias. Fifth, the presence of orthopedic or cardiac prosthetic devices in the setting of S. aureus bacteremia increases the risk of relapsed infection [42]. Although we included patients who presented with infections involving prosthetic devices, whether those devices were removed during the treatment could not be determined. Sixth, because of the nonrandomized nature of the study, residual confounding in the outcome analyses cannot be excluded. Seventh, in patients with S. aureus, the infection can recur without bacteremia, and our study design may not capture all patients with recurrence of infection, although we believe that bacteremia is a clearer endpoint than apparent recurrences in local body sites, which may not always be accompanied by microbiologic evidence of recurrence.
In conclusion, readmission is common and costly among US patients who survived S. aureus bacteremia hospitalization, occurring in 22%. MRSA bacteremia had a higher likelihood of readmission with recurrent bacteremia, particularly in patients with endocarditis, underlying immunocompromising comorbidities, or drug abuse. MRSA bacteremia was also associated with increased in-hospital mortality and longer duration of hospitalization. Efforts should continue to optimize patient care, particularly for those with risk factors for readmission, to decrease readmissions and associated morbidity and mortality in the context of S. aureus bacteremia.
Supplementary Data
Supplementary materials are available at Clinical Infectious Diseases online. Consisting of data provided by the authors to benefit the reader, the posted materials are not copyedited and are the sole responsibility of the authors, so questions or comments should be addressed to the corresponding author.
Note
Potential conflicts of interest. All authors: No reported conflicts of interest. All authors have submitted the ICMJE Form for Disclosure of Potential Conflicts of Interest. Conflicts that the editors consider relevant to the content of the manuscript have been disclosed.

