


Abstract
Background. Statins are associated with increased diabetes risk in large, human immunodeficiency virus (HIV)–uninfected cohorts; the impact of statins on insulin resistance or diabetes in HIV-infected persons has not been assessed within a randomized controlled study.
Methods. HIV-infected participants on stable antiretroviral therapy with a low-density lipoprotein cholesterol level of ≤130 mg/dL and heightened immune activation or inflammation were randomized to rosuvastatin 10 mg daily or placebo for 96 weeks. Fasting serum glucose, insulin, and hemoglobin A1C (HgbA1C) were measured; insulin resistance was estimated by calculating the homeostatic model assessment of insulin resistance (HOMA-IR); and a 2-hour oral glucose tolerance test was administered.
Results. Seventy-two participants were randomized to rosuvastatin therapy and 75 to placebo. Increases in fasting glucose were observed within both groups but were not different between study arms (P = .115); changes in glucose tolerance and HgbA1C did not differ between study arms (P = .920 and P = .650, respectively). Criteria for diabetes were met by 1 participant in the rosuvastatin and 3 in the placebo arm by week 96. Compared with placebo, rosuvastatin therapy was associated with significantly greater increases in insulin and HOMA-IR (P = .008 and P = .004, respectively).
Conclusions. We detected a significant worsening in insulin resistance and an increase in the proportion of participants with impaired fasting glucose but not a clinical diagnosis of diabetes in the rosuvastatin arm. Our findings suggest that prescription of statin therapy should be accompanied by a careful consideration of the risks and benefits, particularly in patients with lower cardiovascular disease risk.
Clinical Trials Registration. NCT01218802.
Cardiovascular disease is a leading cause of death among aging adults with human immunodeficiency virus (HIV) infection [1, 2]. Although an increased prevalence of cardiovascular disease risk factors accounts for a significant proportion of cardiovascular disease burden among HIV-infected persons, excess risk appears to persist after adjusting for these known risk factors [3, 4]. Heightened inflammation and immune activation, even among persons on antiretroviral therapy (ART), have been associated with increased risk of cardiovascular mortality in a large prospective cohort of HIV-infected adults [5–7]. 3-hydroxy-3-methylglutaryl-coenzyme A reductase inhibitors (statins) are associated with a decreased risk of major cardiovascular events and cardiovascular mortality, particularly in those with elevated inflammation [8, 9]. Therefore, statins are an appealing therapeutic option for primary prevention of cardiovascular disease deaths among HIV-infected adults with heightened inflammation.
Despite the overwhelming benefits of statin therapy, no treatment is without adverse effects. A metaanalysis including more than 91 000 participants found a 9% increase in the risk of diabetes among persons prescribed statins [10]. Further studies that indicated a similar increased risk for diabetes with statin use [11] prompted a 2012 Food and Drug Administration–mandated label change to statins warning of the increased diabetes risk. As the risk for diabetes among HIV-infected persons is elevated [12, 13], the risk for insulin resistance or development of diabetes with statins may be even greater among those with HIV. Little is known about the impact of statins on the risk for diabetes in HIV outside of observational studies; statin use was not associated with increased diabetes among 3601 participants in the AIDS Clinical Trials Group Longitudinal Linked Randomized Trials cohort [14] or participants in an Italian cohort (Spagnuolo V et al, unpublished data), after adjustment for underlying confounding by indication, but was associated with a modestly increased risk of diabetes in the HIV Outpatient study [15].
Both HIV-infected patients and their providers need a better understanding of the potential risks and benefits of statin use, particularly if statins are used for primary prevention of cardiovascular events. Furthermore, results from prior statin trials clearly support the need for assessment of diabetes or worsening insulin resistance as secondary endpoints. We previously reported the impact of randomized, double-blinded rosuvastatin therapy on inflammation and cardiovascular disease markers among HIV-infected adults with heightened inflammation or immune activation [16-19]. Our goal in the current analysis was to determine the incidence of diabetes or insulin resistance with rosuvastatin in HIV-infected persons in a randomized controlled study.
METHODS
Study Design and Participants
The SATURN-HIV (Stopping Atherosclerosis and Treating Unhealthy bone with Rosuvastasin in HIV) study is a randomized, double-blinded, placebo-controlled trial designed to measure the impact of daily rosuvastatin at 10 mg on cardiovascular disease and skeletal health, as previously described [16–19]. Randomization was 1:1 and stratified by protease inhibitor use at study entry, by the presence or absence of osteopenia (at either hip or spine), and by the presence or absence of coronary calcifications by computed tomography scan. The study statistician generated randomization lists that were provided directly to the investigational pharmacist who administered study drugs. This report details prespecified interim analysis of changes in markers of glucose metabolism and insulin resistance from baseline to week 96. Enrollment occurred between March 2011 and August 2012. Eligible participants were HIV-infected adults aged ≥18 years with a fasting low-density lipoprotein cholesterol (LDL-C) of ≤130 mg/dL and either a high-sensitivity C-reactive protein level of ≥2 mg/L and/or ≥19% activated CD8+ T-cell counts (CD8+CD38+ human leukocyte antigen-D-related [HLA-DR]). Additional eligibility criteria included receipt of stable ART for ≥12 weeks with cumulative ART duration of ≥6 months, HIV-1 RNA ≤1000 copies/mL, and no history of fragility fractures. Participants were excluded for an active or chronic inflammatory condition (other than HIV), prior myocardial infarction, pregnancy/lactation, receipt of systemic chemotherapy or steroids, diabetes mellitus or uncontrolled thyroid disease, or use of anabolic agents, growth hormone, >81 mg aspirin daily, or bone therapies. The study is registered on clinicaltrials.gov (NCT01218802) and was approved by the institutional review board of University Hospitals Case Medical Center (Cleveland, Ohio). All participants provided written informed consent.
Clinical Assessments
At the initial visit, self-reported demographics and medical and HIV treatment history were obtained, with confirmation by medical records. Physical exam included height and weight measurements. Physical activity was estimated through a self-reported questionnaire [20]. Body mass index (BMI) was calculated using the weight (kg) divided by the height (m) squared. Blood samples were collected after a 12-hour fasting period. Glucose, hemoglobin A1C (HgbA1C), and LDL-C were measured from fresh samples in the clinical laboratory; serum and plasma were stored at −80°C without prior thawing until analysis. Serum insulin was measured by radioimmunoassay at Quest Diagnostics. Insulin resistance was estimated by calculating the homeostatic model assessment of insulin resistance (HOMA-IR) as fasting insulin [µIU/mL] × fasting glucose [mg/dL]/405, with higher values indicating a greater amount of insulin resistance [21]. Following fasting blood sample collection, an oral glucose tolerance test was administered by providing an oral glucose load of 75 g; glucose levels were obtained 2 hours following the oral glucose load. Based on American Diabetes Association criteria [22], diabetes mellitus was diagnosed if 1 of the following criteria was met at 2 separate time points over 1 year or if 2 criteria were met at the same study visit: fasting glucose ≥126 mg/dL, random plasma glucose ≥200 mg/dL with suggestive symptoms of diabetes, plasma glucose ≥200 mg/dL 2 hours post glucose load, or HgbA1C ≥6.5%. HIV-1 RNA level and CD4+ lymphocyte count were obtained as part of routine clinical care.
Dual-Energy X-Ray Absorptiometry
Whole-body dual-energy X-ray absorptiometry (DXA) was performed in anteroposterior view using the Lunar Prodigy Advance machine (GE Healthcare, Madison, Wisconsin). Peripheral fat depots (limb fat) and central fat depots (trunk fat) were used in the analysis. Total lean mass was defined as fat-free, bone-free mass as measured by DXA. Technicians used the same machine on the same participant throughout the study. An experienced radiologist blinded to study information read all DXA scans at Case Medical Center.
Markers of Inflammation and Activation
Plasma markers of inflammation and activation including hs-CRP, soluble vascular cell adhesion molecule-1, soluble tumor necrosis factor-α receptor (sTNFR)-I, sTNFR-II, interleukin-6, lipoprotein-associated phospholipase A2 (Lp-PLA2), soluble CD163, and soluble CD14 were measured as previously reported [17].
Statistical Analyses
This was a prespecified secondary analysis to assess changes from baseline to 96 weeks in measures of insulin resistance, with HOMA-IR as the primary outcome. The sample size for the clinical trial was selected to detect differences in the primary endpoints of carotid intima-media thickness and bone mineral density with adequate power. Continuous measures were described by medians and interquartile ranges and nominal variables with frequencies and percentages. Nominal variables were compared using χ2 analysis or Fisher exact test. Changes in outcomes from study entry were analyzed using linear mixed modeling techniques. The design factors were time (24, 48, and 96 weeks), treatment, and the interaction between treatment and time as fixed effects. Participant was treated as a random effect. Age, sex, race, hepatitis C, and family history of diabetes were included as fixed effects. Additional covariates were examined for association with HOMA-IR using Spearman rank correlation coefficient and included smoking, use of protease inhibitor, self-reported physical activity, baseline and week 96 changes in BMI, limb and trunk fat, total lean mass, CD4, HIV-1 RNA, LDL-C, and markers of inflammation (week 96 change in sTNFR-II and Lp-PLA2). Significant variables were candidates for inclusion to be incorporated singly in additional models. Lastly, models were created including week 96 change in sTNFR-II or Lp-PLA2 and the week 96 change in BMI. Spatial power law and unstructured covariance structures were considered and fit statistics were used to compare outputs. All analyses were performed with SAS version 9.4 (SAS Institute, Cary, North Carolina).
RESULTS
Study Population
A total of 147 HIV-1-infected persons enrolled and were assigned to receive rosuvastatin (72 participants) or placebo (75 participants). The groups were well balanced between arms (Table 1). Overall, the median age was 47 years, the median CD4+ lymphocyte count was 613 cells/µL, and 78% had an HIV-1 RNA <50 copies/mL. The majority of participants were male, African American, and smokers. No participants had diabetes, but 18% in the rosuvastatin arm and 15% in the placebo arm had fasting glucose >100 mg/dL at study entry.
Baseline Characteristics of the Study Population
| Characteristic | Statin (n = 72) | Placebo (n = 75) |
|---|---|---|
| Demographics | ||
| Age (years) | 45.6 (41.1–51.4) | 46.9 (39.2–53.6) |
| Male | 58 (81) | 57 (76) |
| African American | 51 (71) | 52 (69) |
| Current smoker | 43 (60) | 54 (72) |
| HIV-related characteristics | ||
| CD4+ lymphocyte count (cells/µL) | 608 (440–848) | 627 (398–853) |
| Nadir CD4+ T-cell count (cells/µL) | 173 (84–312) | 190 (89–281) |
| HIV-1 RNA <50 copies/mL | 56 (78) | 58 (77) |
| Antiretroviral therapy duration (months) | 63 (37–119) | 71 (39–116) |
| Current protease inhibitor-containing regimen | 36 (50) | 36 (48) |
| Hepatitis C | 5 (7) | 7 (9) |
| Clinical characteristics | ||
| Body mass index (kg/m2) | 26.6 (23.4–30.0) | 27.2 (23.5–30.5) |
| Fat mass (kg) | 23.3 (14.3, 32.0) | 22.4 (14.0, 32.2) |
| Lean body mass (kg) | 56.3 (50.6, 61.9) | 57.2 (48.9, 61.3) |
| CD8+CD38+HLA-DR% | 13.3 (9.0–19.1) | 11.5 (8.0–16.5) |
| High-sensitivity C-reactive protein (μg/mL) | 1.6 (0.9–4.9) | 2.0 (0.7–5.2) |
| Soluble tumor necrosis factor-α receptor-II (ng/mL) | 2.48 (1.78–3.01) | 2.16 (1.61–2.62) |
| Lipoprotein-associated phospholipase A2 (ng/mL) | 165 (134–199) | 169 (142–206) |
| Fasting glucose (mg/dL) | 84 (75, 95) | 87 (79, 94) |
| Fasting insulin (µIU/mL) | 8 (5, 15) | 11 (6, 23) |
| Fasting homeostatic model assessment of insulin resistance | 1.7 (1.0, 3.1) | 2.2 (1.3, 4.8) |
| Low-density lipoprotein cholesterol (mg/dL) | 96 (76, 107) | 97 (77, 121) |
Values presented as median (25th, 75th percentile) or number (%).
Abbreviations: HIV, human immunodeficiency virus; HLA-DR, human leukocyte antigen D-related.
Twenty-eight participants withdrew prior to the week 96 analysis, including 9 in the rosuvastatin arm and 19 in the placebo arm. Eleven participants were lost to follow-up, 2 moved from the area, and 2 were incarcerated. Thirteen participants (12 on placebo, 1 on rosuvastatin) withdrew before week 96, including 1 in the placebo arm who developed diabetes 1 month following the week 48 visit. Three participants (2 on rosuvastatin) prematurely stopped the assigned treatment but remained on the study. Participants who withdrew or were lost to follow-up were more likely to be female (P = .013); other baseline characteristics were not significantly different.
There was no significant difference in fasting glucose changes between study arms (P = .115; Figure 1A). Significant increases were observed within both groups (Table 2), with increases from study entry in the rosuvastatin arm of 11.07% at week 24 (P < .001), 10.60% at week 48 (P < .001), and 12.86% at week 96 (P < .001). The increases in the placebo arm were 6.11% at week 24 (P < .01), 6.58% at week 48 (P < .01), and 9.00% at week 96 (P < .001). By week 96, 20 (32%) participants in the rosuvastatin arm and 12 (21%) in the placebo arm had impaired fasting glucose (>100 but <126 mg/dL). One (2%) participant in the rosuvastatin and 2 (3%) in the placebo arm had fasting glucose ≥126 mg/dL at week 96.
Least Square Mean Estimates of % Change from Baseline to Week 24, 48, and 96
| Study Week | Study Arm | Fasting Glucose (mg/dL) | P Value | Glucose Tolerance (mg/dL) | P Value | Hemoglobin A1C (%) | P Value | Fasting Insulin (µIU/mL) | P Value | Homeostatic Model Assessment of Insulin Resistance | P Value |
|---|---|---|---|---|---|---|---|---|---|---|---|
| 24 | Rosuvastatin | 11.07 | <.001 | 11.70 | <.01 | −1.02 | .20 | 26.74 | <.001 | 43.79 | <.001 |
| Placebo | 6.11 | <.01 | 8.52 | .06 | −1.54 | <.05 | 2.26 | .75 | 12.32 | .19 | |
| 48 | Rosuvastatin | 10.60 | <.001 | 6.48 | .09 | −1.01 | .20 | 51.94 | <.001 | 77.52 | <.001 |
| Placebo | 6.58 | <.01 | 6.82 | .08 | −1.45 | .07 | 8.45 | .49 | 19.26 | .26 | |
| 96 | Rosuvastatin | 12.86 | <.001 | 2.81 | .56 | −0.10 | .91 | 49.41 | <.001 | 72.03 | <.001 |
| Placebo | 9.00 | <.001 | 4.09 | .40 | −0.43 | .61 | 26.55 | .08 | 38.82 | .03 |
Glucose tolerance, assessed by 2-hour glucose measurements post glucose load.
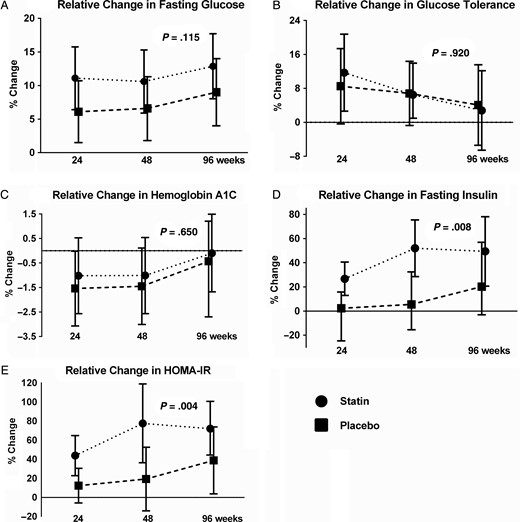
Relative mean changes from study entry to weeks 24, 48, and 96. The rosuvastatin arm is shown by the dotted line and circles, and the placebo arm by the dashed line and squares. The error bars represent the 95% confidence intervals and the P value compares the relative change between rosuvastatin and placebo. A, Change in fasting glucose; B, change in glucose 2-hours following an oral glucose load; C, change in hemoglobin A1C; D, change in fasting insulin; and E, change in fasting homeostatic model assessment of insulin resistance. Abbreviation: HOMA-IR, homeostatic model assessment of insulin resistance.
Changes in glucose tolerance were not significantly different between study arms (P = .920; Figure 1B). Within study arms, the rosuvastatin group increased by 11.70% (P < .013), 6.48% (P = .09), and 2.81% (P = .56) at weeks 24, 48, and 96, respectively. The placebo group increased by 8.52% (P = .06) at week 24, 6.82% (P = .08) at week 48, and 4.09% (P = .40) at week 96 (Table 2).
There was no significant difference between study arms with respect to changes in HgbA1c (P = .650; Figure 1C). None of the changes within study arms were significant with the exception of the change in the placebo arm at week 24 (P = .048; Table 2). By week 96, 1 participant in the rosuvastatin arm and 3 in the placebo arm met diagnostic criteria for diabetes; 1 in the rosuvastatin arm and 2 in the placebo arm initiated pharmacologic therapy for diabetes prior to the week 96 visit.
Rosuvastatin therapy was associated with statistically greater increases in fasting insulin (P = .008; Figure 1D) compared with the placebo. Within the rosuvastatin arm, fasting insulin increased significantly from study entry to week 24 (26.74%, P < .001), week 48 (51.94%, P < .001), and week 96 (49.41%, P < .001). No significant changes in fasting insulin were seen in the placebo arm (2.26%, 8.45%, 26.55%, all P ≥ .08; Table 2).
Compared with the placebo, rosuvastatin therapy was also associated with significantly greater changes in HOMA-IR (P = .004; Figure 1E). A significant increase in the HOMA-IR was observed within the rosuvastatin arm from study entry to week 24 (by 43.79%, P < .001), week 48 (77.52%, P < .001), and week 96 (72.03%, P < .001). In the placebo arm, only the increase at week 96 was significant (38.82%, P = .03).
In subsequent models, covariates that could explain the relationship between statin use and the percent change in HOMA-IR were incorporated as fixed effects. Type 3 tests of fixed effects yielded significant effects of treatment and time in all of these models. The estimated difference in HOMA-IR change with assignment to rosuvastatin was 40.07% (95% confidence interval [CI], 11.48, 68.66%; P = .0064) in a model including age, sex, race, hepatitis C, and family history of diabetes. The treatment effect of rosuvastatin on HOMA-IR remained significant even after accounting for changes in BMI, trunk fat, and lean body mass.
Lastly, we explored the association between insulin resistance and inflammation or immune activation. The 96 week relative change in HOMA-IR was inversely correlated with the week 96 change in sTNFR-II (r = −0.34, P = .013) and Lp-PLA2 (r = −0.27, P = .0035) but not with other markers of inflammation or immune activation. The association between rosuvastatin and HOMA-IR remained significant in a model that included age, sex, race, hepatitis C, family history of diabetes, week 96 change in BMI, and addition of the week 96 relative change in sTNFR-II (estimate 52.98%; 95% CI, 23.40, 82.57%; P < .001). In a similar model with Lp-PLA2 in place of sTNFR-II, the association between rosuvastatin and HOMA-IR also remained significant (estimate 46.63%; 95% CI, 16.08, 77.17%; P = .003).
DISCUSSION
We are the first to report the effect of randomized rosuvastatin therapy on insulin resistance in HIV-infected participants on ART. We found that rosuvastatin led to significant increases in serum fasting insulin and HOMA-IR, robust indicators of worsening insulin resistance. The increases in insulin and HOMA-IR occurred within the first 24 weeks of rosuvastatin and persisted over 96 weeks of follow-up, which is consistent with the observation of early statin effects reported in HIV-uninfected populations [23]. Change in HOMA-IR after rosuvastatin was inversely correlated with changes in inflammation markers sTNFR-II and Lp-PLA2. In contrast, although fasting glucose increased throughout the duration of the study and more participants in the rosuvastatin arm had impaired fasting glucose (>100 mg/dL), the changes in fasting glucose, glucose tolerance, and incident diabetes did not differ between study arms. Considering our relatively small sample size and relatively short study duration, it was not surprising that we failed to detect an increased prevalence of diabetes. A large metaanalysis of more than 91 000 HIV-uninfected participants randomized to statin or placebo estimated the absolute risk of developing diabetes at 1 case per 1000 patient-years of treatment [10].
The combination of our findings raises questions as to the potential mechanisms by which some statins may lead to insulin resistance. Interestingly, we found an initial worsening in glucose tolerance and then a return to near baseline, with a consistent but stable increase in insulin and HOMA-IR, suggesting that the initial worsening in glucose was compensated by a persistent increase in insulin. Several possible mechanisms for the development of glucose intolerance and insulin resistance with statins have been proposed and demonstrated in vivo and in vitro [24, 25]. Statin effects on calcium signaling within pancreatic β cells may impair release of insulin or regulation of insulin release either directly or through a reduction in cholesterol [26–28]. Statins decreased adipocyte differentiation and expression of glucose transporter 4 (GLUT4), which is necessary for insulin-mediated glucose uptake, as well as other cholesterol pathway products that enhance GLUT4 actions [29, 30]. Reduction in adiponectin with worsened insulin resistance has been shown in some studies [31, 32]; however, others have demonstrated no change [33, 34]. Ultimately, the underlying mechanisms are not well understood and are likely a combination of pathways with differing effects between statins [24].
The association between greater reductions in sTNFR-II and Lp-PLA2 and a greater impairment in insulin resistance suggests that statin efficacy may contribute to the amount of glucose metabolism impairment. Indeed, we did detect a weak correlation between changes in LDL-C and HOMA-IR, although it did not reach statistical significance (r = −0.18, P = .055), suggesting that greater statin potency may be associated with greater insulin resistance. Interindividual variation in regard to drug efficacy may have been impacted by concomitant medications or by underlying genetic factors that have an impact on drug metabolism, as all participants in the treatment arm received the identical statin and dose. Pharmacologic interactions between protease inhibitors and statins were unlikely, as we were unable to detect a correlation between the week 96 change in HOMA-IR and any protease inhibitor use (r = −0.06, P = .49). Interstatin variation is reported, with a greater risk for diabetes and insulin resistance among the higher potency statins, including rosuvastatin [23, 35, 36]. The increased risk of insulin resistance with higher potency statins is of particular relevance with the 2013 American College of Cardiology/American Heart Association Guidelines, which support initiation of moderate-intensity or higher statin therapy for those with identified cardiovascular disease risk [37].
The randomized design of our study clearly shows an association between rosuvastatin use and insulin resistance among HIV-infected adults on effective ART. Although our study sample was relatively small in comparison to many statin trials in HIV-uninfected populations, we have eliminated the bias of prescribing indication and have measures of insulin resistance to detect changes that may not be discernible by using only a diagnosis of diabetes. However, our findings should be interpreted with caution. Our results are specific only for rosuvastatin; statin-specific effects can differ markedly. The study population was carefully selected and included those without an indication for secondary prevention, with an LDL-C < 130, and no diabetes. The impact of rosuvastatin on glucose or insulin could differ in a population with greater cholesterol abnormalities or diabetes. Our population was predominantly overweight and African American and may be at a greater risk for the development of insulin resistance compared with the general population. Lastly, we used fasting measures of glucose, insulin, HOMA-IR, and an oral glucose tolerance test. While these are reasonable screening tests for impaired fasting glucose and insulin resistance [38], the gold standard measurement for insulin resistance is a euglycemic insulin clamp.
In summary, in a 96-week randomized, double-blinded, placebo-controlled trial of rosuvastatin in HIV-infected adults on ART, we detected a significant worsening in insulin resistance and an increase in the proportion of participants with impaired fasting glucose but not diabetes. Furthermore, in the overall study population, the significant increases in glucose and insulin emphasize that insulin resistance is of increasing importance in those with HIV who are aging regardless of concomitant statin therapy. Our study findings are a reminder that the safest, first-line population-wide interventions do not come in a “magic pill” but in intensive lifestyle modifications [37]. Although statins clearly have a highly effective role in reducing death due to cardiovascular disease in certain populations, our findings suggest that prescription of statin therapy should be accompanied by a careful consideration of the risks and benefits, particularly in patients with lower cardiovascular disease risk.
Notes
Financial support. This project was supported by the National Institutes of Health (NIH) (NR012642 to G. A. M. and R03AG040594 and K23AG050260 to K. M. E.) and the Hartford Foundation Centers for Excellence in Geriatric Medicine (K. M. E.). Technical support was provided by the Center for AIDS Research, Case Western Reserve University (P30 AI36219). Study drug and matching placebo were donated by AstraZeneca.
Disclaimer. The content is solely the responsibility of the authors and does not necessarily represent the official views of the NIH.
Potential conflicts of interest. G. A. M. has served as a scientific advisor or speaker for Bristol-Myers Squibb (BMS), Gilead, Pfizer, and Merck and has received research grants from BMS, GlaxoSmithKline, and Gilead Sciences. S. M. D. serves on the Data Safety and Monitoring Board for a Johnson & Johnson–sponsored study. All other authors: No potential conflicts of interest.
All authors have submitted the ICMJE Form for Disclosure of Potential Conflicts of Interest. Conflicts that the editors consider relevant to the content of the manuscript have been disclosed.
References
Author notes
Presented in part: Conference on Retroviruses and Opportunistic Infections, Boston, MA, 3–6 March 2014. Abstract 134; Conference on Retroviruses and Opportunistic Infections, Seattle, WA, 23–26 February 2015. Abstract 771.

