


Abstract
Background. Older adults have the highest influenza-related morbidity and mortality risk, but the influenza vaccine is less effective in the elderly. It is unknown whether influenza vaccination of nonelderly adults confers additional disease protection on the elderly population.
Methods. We examined the association between county-wide influenza vaccination coverage among 520 229 younger adults (aged 18–64 years) in the Behavioral Risk Factors Surveillance System Survey and illnesses related to influenza in 3 317 709 elderly Medicare beneficiaries aged ≥65 years, between 2002 and 2010 (13 267 786 person-years). Results were stratified by documented receipt of a seasonal influenza vaccine in each Medicare beneficiary.
Results. Increases in county-wide vaccine coverage among younger adults were associated with lower adjusted odds of illnesses related to influenza in the elderly. Compared with elderly residents of counties with ≤15% of younger adults vaccinated, the adjusted odds ratio for a principal diagnosis of influenza among elderly residents was 0.91 (95% confidence interval, .88–.94) for counties with 16%–20% of younger adults vaccinated, 0.87 (.84–.90) for counties with 21%–25% vaccinated, 0.80 (.77–.83) for counties with 26%–30% vaccinated, and 0.79 (.76–.83) for counties with ≥31% vaccinated (P for trend <.001). Stronger associations were observed among vaccinated elderly adults, in peak months of influenza season, in more severe influenza seasons, in influenza seasons with greater antigenic match to influenza vaccine, and for more specific definitions of influenza-related illness.
Conclusions. In a large, nationwide sample of Medicare beneficiaries, influenza vaccination among adults aged 18–64 years was inversely associated with illnesses related to influenza in the elderly.
Only 36.7% of adults aged 18–64 years received influenza vaccination in the 2013–2014 season [1], despite guidelines that support vaccination unless contraindicated [2]. Prior research findings suggest that perceived low risk of influenza diagnosis [3, 4], concern about vaccine adverse effects [4, 5], and unwillingness to spend the time [6] or money [6] to obtain vaccination, contribute to reduced vaccination coverage.
However, particularly in urban areas, persons of all ages have contact with the elderly and immunocompromised; for example, in households, on public transportation and in stores. Although healthy individuals are at low risk for serious complications from influenza, they may spread disease to others at a higher morbidity or mortality risk [7–9]. This includes older persons who were vaccinated against influenza, because of modest vaccine effectiveness in the elderly [10–12].
Prior theoretical models suggest that during a pandemic influenza outbreak, vaccinating children and young adults would be more effective than vaccinating high-risk individuals [7–9, 13], based on a hypothesis that children transmit the virus to their parents, who transmit it to the community at large [7, 8]. An inverse association between child influenza vaccination and elderly infection rates has been observed empirically [14–17]; excess mortality rates from influenza in Japan rose when a policy to vaccinate schoolchildren was relaxed [18]. Furthermore, evidence of herd immunity has been demonstrated through the effects of vaccinating nursing home staff on resident mortality rates [19]. Previous work has been limited by small geographic areas [14–17, 19] and focus on children [14–18]. In the current study, we employed 3 national data sets to consider whether communities with higher influenza vaccination coverage among nonelderly adults had less influenza-related illness in the elderly.
METHODS
Data
We obtained data from 3 sources. First, the Behavioral Risk Factors Surveillance System Selected Metropolitan/Micropolitan Area Risk Trends (BRFSS-SMART) telephone survey of the Centers for Disease Control and Prevention provided data on adult vaccinations against seasonal influenza in selected urban counties between 2002–2010 [20]. Supplementary Table 1 summarizes vaccine availability and disease activity by season. For our primary analysis, we did not consider children, because county-level immunization data were available for <10 counties per year [21]. Second, the Centers for Medicare and Medicaid Services provided Medicare claims data for a 20% random sample of enrollees aged ≥65 years. We considered individuals enrolled in Parts A and B of fee-for-service Medicare for ≥1 year [22]. Third, the US Census Bureau provided data on county-wide demographics and socioeconomic status [23]. Data sets were linked using a zip code–county look-up table.
Influenza Vaccination Coverage among Nonelderly Adults
Across all influenza seasons (October–May) [24] and counties, we estimated influenza vaccination coverage among 520 229 nonpregnant adults aged 18–64 years based on BRFSS-SMART data, using Kaplan–Meier survival curves (Supplementary Methods 1) [20, 25, 26]. We categorized county-wide vaccination coverage for each influenza season as ≤15%, 16%–20%, 21%–25%, 26%–30%, or ≥31%, based on the 5% increments that most closely represented quintiles.
Influenza-related Illness in the Elderly
For each influenza season and county, we proxied influenzalike illness through diagnostic (International Classification of Diseases, Ninth Revision) codes in Medicare inpatient, outpatient, and carrier claims. We identified 3 types of diagnoses related to seasonal influenza (“influenza-related illness”), from most to least specific definition: influenza (principal diagnosis) [27], influenza (principal or secondary diagnosis) [27], and pneumonia or influenza [28] (Supplementary Table 2). We did not consider broader definitions of influenza-related illness, which would include few cases of true influenza. Separate analyses for hospitalizations used inpatient claims only.
Covariates
For each Medicare beneficiary, we identified receipt of influenza vaccine in each season, age, sex, race/ethnicity, each Charlson comorbid condition [29], and residence in a skilled nursing facility (Supplementary Table 2). For each county, we controlled for 11 health indicators (using BRFSS-SMART data) and access to health care and demographics (using US Census data) (Supplementary Table 2) [23]. We controlled for severity of the entire influenza season (percentage of samples tested positive for influenza, by US Health and Human Services region) [30]. We also controlled for variation by influenza season and state of residence. In alternate specifications (not shown), we controlled for county-wide vaccination coverage among elderly residents, with similar results. The study protocol was approved by the Institutional Review Boards of New York University School of Medicine and the National Bureau of Economic Research.
Analysis
We used logistic regression models to examine the relationship between county-wide vaccination coverage [19, 31] in nonelderly adults and diagnosis of influenza-related illness in the elderly. The dependent variable was diagnosis of influenza-related illness in each Medicare beneficiary (yes or no), by influenza season. The independent variable of interest was county-wide vaccination coverage among adults aged 18–64 years, by influenza season. P values for trend were obtained using a Wald test for a score variable based on median county-wide vaccination coverage in each category. We repeated the analysis for hospitalizations for influenza-related illness. Covariates were as described above. An adjusted odds ratio (AOR) <1 was considered suggestive of herd protection conferred by nonelderly adults on the elderly. We expected to observe a lower AOR with more specific definitions of influenza-related illness than with less specific definitions [32]. In addition, we included an interaction term between seasonal vaccination in each Medicare beneficiary and county-wide vaccination coverage, to consider whether associations were stronger in vaccinated (AOR for interaction, <1) or unvaccinated (AOR for interaction, >1) elderly adults. Standard errors were clustered by Medicare beneficiary, and significance tests were 2-sided at the 5% level.
Sensitivity Analyses
We used a series of sensitivity analyses to address potential biases. First, we analyzed sensitivity to our definition of influenza season, changing the outcome from diagnosis at any time during influenza season to diagnosis in peak (December–March) versus nonpeak (October–November or April–May) months of influenza season [32], using multinomial logistic regression (dependent variable categories were no influenza-related illness, illness during peak months, and illness during nonpeak months) and a Wald test for equality of coefficients. We expected to observe a lower AOR during peak months [32]. We also changed the outcome to diagnosis in the July–August preceding each influenza (“preinfluenza”) season, during which vaccination should provide no benefit (expected AOR, 1) [33, 34].
Second, we addressed varying severity of influenza seasons, applying an interaction term between county-wide vaccination coverage and influenza season severity (categorized as at or above the median [15.4%] vs below the median proportion of samples tested positive for influenza). We expected to observe a lower AOR in more severe influenza seasons. We also considered diagnosis in January–May of the 2009–2010 influenza season, during which there was minimal seasonal influenza activity and H1N1 pandemic virus was declining (expected AOR, 1) [30].
Third, we stratified influenza seasons by their antigenic match to influenza vaccine (categorized as at or above vs below the median; Supplementary Methods 2), expecting to observe a lower AOR in seasons with better match.
Fourth, in 3 separate models, we tested the association between nonelderly adult vaccination coverage and outcomes that should be unrelated to influenza (expected AOR, 1): hip fracture (considered because influenza outcomes may differ by patient frailty) [35], low back pain (considered because both low back pain and influenza vaccination may proxy for access to care), and moderate to severe liver disease (considered because influenza vaccination cannot protect against non–influenza-related diagnoses) (Supplementary Table 2).
Children
Vaccination coverage among nonelderly adults might reflect coverage among children. To assess this possibility, we obtained data from the National Immunization Survey (NIS) to measure statewide vaccination coverage among children aged 6–23 months for each influenza season between 2002–2013 (and for teenagers aged 13–17 years for seasons with available data, 2007–2013), in all 50 states plus Washington, DC. We also considered subsamples through 2010, the final year for data in our primary analysis. We regressed vaccination coverage for nonelderly adults against coverage for children, controlling for influenza season and state of residence. An AOR of 1 would suggest no association, reducing the possibility of unobserved confounding in the main analysis. In addition, the National Immunization Survey reported child immunizations for the same age ranges in 26 counties, 25 of which overlapped with our primary analysis (82 county-years). For these counties, we repeated our primary analysis with independent variables of both nonelderly adult and child vaccination coverage, each categorized as at or above the median versus below the median, to consider the relative strength of associations between vaccination coverage in nonelderly adults versus children and influenza-related illness in the elderly.
Preventable Influenza-Related Illness in the Elderly
We estimated population-attributable risk as the proportion of influenza-related illness that would have been prevented in the elderly had vaccination coverage among nonelderly adults been ≥31% in all counties, with all other risk factors unchanged [36].
RESULTS
The combined data set consisted of 13 267 786 person-years among 3 317 709 Medicare beneficiaries in 313 counties comprising 56.6% of the US population [37]. Table 1 (and Supplementary Table 3) provides summary statistics; 55.4% of elderly individuals had a documented influenza vaccine.
Summary Statistics for Medicare Beneficiaries
| Variablea | Mean (SD)b | ||
|---|---|---|---|
| Total | Documented Influenza Vaccinec | No Influenza Vaccinec | |
| Person-years, No. | 13 267 786 | 7 350 619 | 5 917 167 |
| Medicare beneficiaries, No.d | 3 317 709 | 2 276 426 | 2 424 716 |
| Influenza-related illness, October–May | |||
| Influenza (principal diagnosis) | 0.50 (7.02) | 0.34 (5.82) | 0.69 (8.26) |
| Influenza (principal or secondary diagnosis) | 0.72 (8.48) | 0.49 (6.95) | 1.02 (10.05) |
| Pneumonia or influenza | 7.23 (25.90) | 4.94 (21.67) | 10.08 (30.11) |
| Hospitalization for influenza-related illness, October–May | |||
| Influenza (principal diagnosis) | 0.026 (1.598) | 0.020 (1.432) | 0.032 (1.789) |
| Influenza (principal or secondary diagnosis) | 0.041 (2.029) | 0.033 (1.809) | 0.052 (2.281) |
| Pneumonia or influenza | 1.76 (13.16) | 1.26 (11.14) | 2.42 (15.36) |
| County-wide influenza vaccination coverage in individuals aged 18–64 y | 26.73 (7.45) | 27.38 (7.39) | 25.91 (7.44) |
| Age, y | 77.40 (7.57) | 77.54 (7.29) | 77.24 (7.89) |
| Receipt of influenza vaccine in Medicare beneficiary | 55.40 (49.71) | 100.0 (0.0) | 0.0 (0.0) |
| Comorbidity by Charlson Scorea | |||
| 0 | 85.98 (34.72) | 87.71 (32.84) | 83.84 (36.81) |
| 1 | 6.24 (24.18) | 5.84 (23.45) | 6.73 (25.05) |
| ≥2 | 7.78 (26.79) | 6.45 (24.57) | 9.43 (29.22) |
| Demographicsa | |||
| White | 84.21 (36.46) | 88.30 (32.14) | 79.13 (40.64) |
| Nonwhite | 15.69 (36.26) | 11.60 (32.34) | 20.77 (40.24) |
| Race unknown or missing | 0.12 (3.51) | 0.10 (3.20) | 0.15 (3.86) |
| Female sex | 61.19 (48.73) | 61.10 (48.75) | 61.31 (48.71) |
| Residence in a skilled nursing facility | 9.59 (29.45) | 6.77 (25.12) | 13.11 (33.75) |
| Influenza season severity (specimens testing positive for influenza in HHS region) | 15.90 (5.10) | 16.00 (5.10) | 15.80 (5.00) |
| County-wide demographics | |||
| BMI, kg/m2 | 26.99 (0.67) | 26.98 (0.67) | 26.99 (0.67) |
| Population density, 1000 persons/square mile (2.59 km2) | 3.27 (8.04) | 2.96 (7.51) | 3.65 (8.64) |
| Median household income (Census 2000), × $1000 | 47.30 (10.10) | 47.90 (10.20) | 46.60 (10.00) |
| Individuals of all ages in poverty | 10.40 (4.10) | 10.00 (3.90) | 10.80 (4.20) |
| Primary care physicians, No./100 000 persons | 109.50 (38.50) | 109.70 (38.30) | 109.20 (38.80) |
| Short-term general hospital beds, No./100 000 persons | 286.90 (144.10) | 283.70 (140.30) | 290.80 (148.60) |
| Daily servings of fruits and vegetables (continuous), No. | 2.18 (0.11) | 2.18 (0.12) | 2.18 (0.11) |
| Medical condition or history in adults aged ≥18 y | |||
| Current smoker | 18.65 (4.38) | 18.58 (4.38) | 18.73 (4.37) |
| Diabetic | 7.59 (1.92) | 7.54 (1.92) | 7.66 (1.91) |
| History of myocardial infarction | 3.74 (1.06) | 3.74 (1.07) | 3.75 (1.05) |
| History of stroke | 2.37 (0.79) | 2.35 (0.80) | 2.38 (0.79) |
| Asthma | 63.61 (8.59) | 63.85 (8.53) | 63.32 (8.65) |
| Arthritis | 25.19 (4.20) | 25.27 (4.18) | 25.09 (4.23) |
| High risk for HIV infectione | 4.45 (1.85) | 4.38 (1.83) | 4.54 (1.86) |
| Pregnant (female subjects only) | 4.99 (2.46) | 5.01 (2.47) | 4.97 (2.45) |
| Leisure time physical activity in past 30 d | 76.73 (4.81) | 77.08 (4.77) | 76.29 (4.82) |
Abbreviations: BMI, body mass index; HHS, US Department of Health and Human Services; HIV, human immunodeficiency virus; SD, standard deviation.
a Regression models included more precise definitions of comorbidity and race/ethnicity, plus additional covariates for influenza season and state of residence. See Supplementary Table 3 for additional summary statistics.
b Unless otherwise specified, values represent percentages. Differences were significant for all variables (P < .001).
c Small differences may be significant owing to large sample size.
d Because county-wide vaccination coverage changed each year, an individual may be included in multiple subgroups. Therefore, the number of individuals obtained by adding subgroups exceeds the total number of individuals.
e Exact criteria are shown in Supplementary Table 2.
Figure 1 shows AORs for influenza-related illness in the elderly according to county-wide vaccination coverage among younger adults (aged 18–64 years). Increases in county-wide vaccination coverage among younger adults were associated with progressively lower adjusted odds of influenza-related illness in the elderly. Compared with elderly residents of counties with ≤15% of younger adults vaccinated, the AOR for a principal diagnosis of influenza among elderly residents was 0.91 (95% confidence interval [CI], .88–.94) for counties with 16%–20% of younger adults vaccinated, 0.87 (.84–.90) for counties with 21%–25% vaccinated, 0.80 (.77–.83) for counties with 26%–30% vaccinated, and 0.79 (.76–.83) for counties with ≥31% vaccinated (P for trend < .001). Elderly individuals also had lower adjusted odds of influenza (principal or secondary diagnosis) (AOR for ≥31% vs ≤15% of younger adults vaccinated, 0.80; 95% CI, .77–.84) and pneumonia or influenza (AOR, 0.97; .95–.98). (Supplementary Table 4 provides further details.)
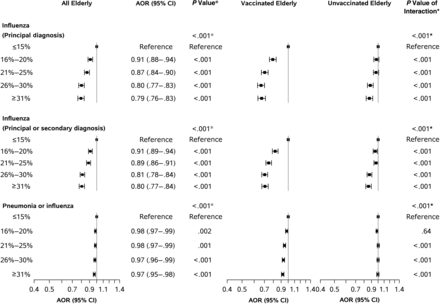
Influenza-related illness in the elderly versus county-wide vaccination coverage among nonelderly adults. We regressed diagnosis of influenza-related illness in 13 267 786 person-years among 3 317 709 Medicare beneficiaries aged ≥65 years versus county-wide influenza vaccination coverage among nonelderly adults aged 18–64 years, controlling for all variables in Table 1. Each row shows county-wide influenza vaccination coverage among nonelderly adults aged 18–64 years. “Vaccinated elderly” were Medicare beneficiaries with documented receipt of an influenza vaccine. “Unvaccinated elderly” were other Medicare beneficiaries. Supplementary Figure 1 and Supplementary Table 4 present more detailed results. Error bars represent 95% confidence intervals (CIs). *First P value in each section represents a test for trend across vaccination coverage groups or equality of coefficients; other P values are for the AOR on the vaccination coverage group in each row. Abbreviation: AOR, adjusted odds ratio.
The observed association was stronger for vaccinated than unvaccinated elderly adults. For vaccinated elderly adults, those in counties with the highest vaccination coverage had an AOR for principal diagnosis of influenza of 0.67 (95% CI, .63–.71) compared with vaccinated elderly adults in counties with the lowest rates. For unvaccinated elderly adults, those in counties with the highest vaccination coverage had an AOR of 0.87 (95% CI, .83–.92) compared with unvaccinated elderly adults in counties with the lowest rates (P for interaction <.001) (Figure 1). Similar differences were observed for alternate definitions of influenza-related illness. For hospitalizations, the AOR for principal or secondary diagnosis of influenza in counties with ≥31% versus ≤15% of younger adults vaccinated was 0.70 (95% CI, .57–.86; P < .001) among vaccinated and 0.92 (.76–1.13; P = .44) among unvaccinated elderly adults (P for interaction = .006) (Supplementary Figure 1). For hospitalization with pneumonia or influenza, results were significant only in vaccinated elderly adults (Supplementary Figure 1).
Figure 2 shows sensitivity analyses. The association was stronger in peak months, more severe influenza seasons, and seasons with better antigenic match between circulating virus and influenza vaccine. In counties with ≥31% versus ≤15% of younger adults vaccinated, the AOR for principal diagnosis of influenza was 0.75 in peak months (95% CI, .70–.80) versus 0.89 (.83–.95) in nonpeak months (P for difference = .006), 0.75 (.70–.79) in more severe influenza seasons versus 0.81 (.77–.86) in less severe influenza seasons (P for difference = .022), and 0.79 (.75–.83) in seasons with better antigenic match versus 0.91 (.87–.95) in seasons with worse antigenic match (P for difference < .001). The association was not significant in preinfluenza season (P for trend = .46) or postpandemic 2009–2010 influenza season (P for trend = .31). Conditions unrelated to influenza vaccination (hip fracture, low back pain, and moderate to severe liver disease) were not significantly associated with county-wide vaccination coverage (P for trend = .40–.72) (Supplementary Figure 2). Similar results were obtained for alternate definitions of influenza-related illness (Supplementary Figure 2).
![Sensitivity analysis. We show results for a series of sensitivity analyses: varying definition of influenza season (reflected by an end point of diagnosis in peak vs nonpeak months of influenza season [expected adjusted odds ratio (AOR) lower in peak months] or diagnosis in the July–August preceding each influenza season [expected AOR, 1]); varying severity of influenza seasons (reflected by diagnosis in more severe vs less severe influenza seasons [expected AOR lower in more severe seasons] or diagnosis in January–May of the 2009–2010 influenza season, during which there was minimal viral activity [expected AOR, 1]); varying antigenic match between circulating virus and influenza vaccine (reflected by diagnosis in seasons with better vs worse antigenic match [expected AOR lower in seasons with better match]); and diagnoses of 3 conditions that should be unrelated to influenza (hip fracture, low back pain, and moderate-severe liver disease [expected AOR for each condition, 1]). Each row shows influenza vaccination coverage among nonelderly adults aged 18–64 years. Supplementary Figure 2 provides sensitivity analyses for alternate definitions of influenza-related illness. Error bars represent 95% confidence intervals (CIs). *First P value in each section represents a test for trend across vaccination coverage groups or equality of coefficients; other P values are for the AOR on the vaccination coverage group in each row.](https://oup.silverchair-cdn.com/oup/backfile/Content_public/Journal/cid/61/10/10.1093_cid_civ630/1/m_civ63002.gif?Expires=1750415946&Signature=0opoEkEQz~oxqCVo~wbvucHvQVyzUrM8SKA8ARd~i7fadtpCuYZy3bapotVrofoRCf~IeaRZa~GJdiVw7C22I0FR7PWZRziTIL0lBdT6ky~kypGivjbU-TmlCTiGkI9qWgZvSIPYQB6KWewjID33D4QmBC6CTmuw6WYXL0lqqO-Rgbc0nCT-fzfL2k7NaNHye9sa59~TTBNh4KqdooeyUCVL953XHv-s3v2-fINGRYDDmTcyspVBs9LrZo3fUOvlFJDbIR5cdnV2dVdMcwxQn2XhWh0dbgp~Rk6MwGsOeDG4eKNsEY1Ub8rSg9xWFVa7c5uqs2AkcKQcIBF1AOZ6fQ__&Key-Pair-Id=APKAIE5G5CRDK6RD3PGA)
Sensitivity analysis. We show results for a series of sensitivity analyses: varying definition of influenza season (reflected by an end point of diagnosis in peak vs nonpeak months of influenza season [expected adjusted odds ratio (AOR) lower in peak months] or diagnosis in the July–August preceding each influenza season [expected AOR, 1]); varying severity of influenza seasons (reflected by diagnosis in more severe vs less severe influenza seasons [expected AOR lower in more severe seasons] or diagnosis in January–May of the 2009–2010 influenza season, during which there was minimal viral activity [expected AOR, 1]); varying antigenic match between circulating virus and influenza vaccine (reflected by diagnosis in seasons with better vs worse antigenic match [expected AOR lower in seasons with better match]); and diagnoses of 3 conditions that should be unrelated to influenza (hip fracture, low back pain, and moderate-severe liver disease [expected AOR for each condition, 1]). Each row shows influenza vaccination coverage among nonelderly adults aged 18–64 years. Supplementary Figure 2 provides sensitivity analyses for alternate definitions of influenza-related illness. Error bars represent 95% confidence intervals (CIs). *First P value in each section represents a test for trend across vaccination coverage groups or equality of coefficients; other P values are for the AOR on the vaccination coverage group in each row.
There was no association between vaccination coverage among nonelderly adults and among children in the same states (P = .31–.98; Supplementary Table 5). For counties with nonelderly adult coverage above the median, the AOR for a principal diagnosis of influenza in the elderly was 0.85 (95% CI, .79–.92; P < .001) compared with counties below the median; whereas for counties with child vaccination coverage above the median, the AOR for a principal diagnosis of influenza in the elderly was not significant (1.01; .93–1.10; P = .87) (Figure 3 and Supplementary Table 5). The estimated population-attributable risk ranged from 0.7% (95% CI, .1%–1.3%) for pneumonia or influenza to 5.9% (4.0%–7.7%) for a principal diagnosis of influenza (Figure 4).
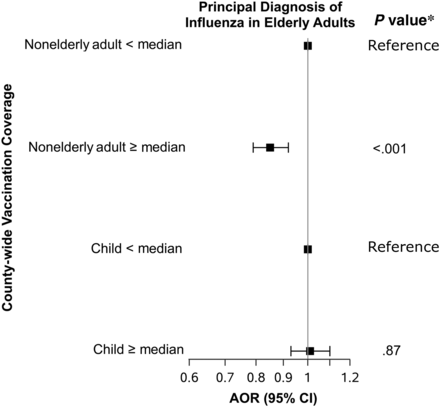
Sensitivity analysis for children. For 82 county-years with overlapping data (2002–2010), a principal diagnosis of influenza in elderly adults was associated with county-wide vaccination coverage among nonelderly adults but not among children. Supplementary Table 5 presents additional results. Abbreviations: AOR, adjusted odds ratio; CI, confidence interval.
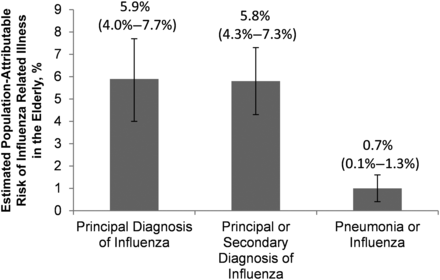
Preventable influenza-related illness in the elderly. We estimated population-attributable risk as the proportion of influenza-related illness that would have been prevented in the elderly had vaccination coverage among all nonelderly adults equaled the mean of our highest coverage group (35.3%), with other risk factors unchanged.
DISCUSSION
Using national data comprising >3 million Medicare beneficiaries across 13 million person-years in 313 counties, we found a strong inverse relationship between vaccination coverage among nonelderly adults and influenza-related illness in the elderly. Counties with ≥31% vaccination coverage among nonelderly adults had 20.6% lower adjusted odds of a principal diagnosis of influenza in the elderly than counties with ≤15% vaccination coverage.
Past studies have explored the effects of vaccination of healthcare workers or children on influenza in the elderly. A recent meta-analysis of randomized controlled trials (RCTs) found that vaccination of healthcare workers reduced influenza-like illness in residents of long-term care facilities by 42%, with no significant impact on hospitalizations [38]. A cluster RCT found that vaccination of children in Canadian Hutterite colonies reduced influenza by 61% in unvaccinated community members [15]. These studies have been limited by narrow geographic areas where RCTs were feasible. An earlier community-based trial found that vaccination of children was associated with modest reductions in medically attenuated acute respiratory illness for adults [17]. Observational work found that vaccination of Japanese schoolchildren from 1962 to 1987 was associated with 1 fewer death nationwide per 420 vaccinations, even though the program had been earlier abandoned due to concern about lack of efficacy [18]. However, the impact of herd protection for influenza among adults has not been assessed.
The risk reduction observed in our study was more than twice as large for vaccinated as for unvaccinated elderly adults, suggesting that community-wide vaccination may amplify the benefits of individual vaccination. This result is seemingly at odds with a conventional herd immunity framework, in which disease transmission ceases because the vast majority of community members are vaccinated, resulting in disproportionate benefits for the few remaining unvaccinated community members. However, our finding is explained by the fact that most younger adults remain unvaccinated in each county, so that all elderly persons remained likely to come in contact with infected individuals.
We illustrate this point with a simple infectious disease transmission model, in which disease transmission depended on 3 parameters: prevalence in nonelderly adults, contacts with the community, and risk of transmission from each contact with an infected individual (Supplementary Methods 4) [39]. The first 2 parameters affected vaccinated and unvaccinated elderly adults similarly, whereas the risk of transmission was attenuated only in vaccinated elderly adults. In this setting, vaccinated elderly adults required proportionately more contacts to contract disease. As the share of vaccinated nonelderly adults increased, the number of cases of influenza among vaccinated elderly adults was therefore expected to fall faster than for the unvaccinated elderly adults (Supplementary Figure 3).
At the state level, we observed no association between vaccine coverage for children and nonelderly adults. Surprisingly, for counties with vaccination coverage available for both age groups, only nonelderly adult coverage was associated with influenza-related illness among the elderly. This result is seemingly at odds with theoretical work suggesting that vaccination of children and their parents (or young adults in general) may be sufficient to protect elders [7–9, 13]. However, most prior studies have considered near-universal vaccination of children [14, 15] or optimal vaccine allocation strategies during pandemic rather than typical influenza seasons [7–9]. It is possible that at observed vaccine coverage levels and disease prevalence, the elderly benefit most from vaccination of other adults, with whom they are more likely to have direct contact [40]. This inference may be somewhat tempered by improved child influenza vaccine coverage in recent years (58.9% in 2013–2014 vs 27% in our sample) [1], although even this coverage is well below universal.
For many adults, the decision to be vaccinated is taken to decrease one's personal influenza-related morbidity and mortality risk. However, the risk of significant morbid effects among healthy, nonelderly adults is small, and recommendations partially hinge on reducing outpatient medical visits and worker absenteeism [2]. Indeed, most developed nations do not recommend routinely vaccinating healthy adults [41, 42]. Our findings suggest that young, healthy persons who obtain vaccination may also protect higher-risk individuals in their community, with the potential to prevent up to 5.9% of influenza diagnoses in elderly individuals. It remains to be seen whether physicians who discuss altruism might inspire adults at low influenza morbidity and mortality risk—particularly those living in densely populated cities—to be vaccinated.
Limitations
Our study has important limitations:
1. Our data are observational and subject to confounding. We used diagnostic codes to proxy for influenza-related illness because laboratory-confirmed influenza was not available. However, we conducted extensive sensitivity analyses to address potential sources of bias (including confounders studied in prior work) [32–35], which consistently supported our hypothesis.
2. Our comparison data for children were limited to infants/toddlers and adolescents, whereas previous theoretical work has hypothesized that elementary school–aged children may be the main spreaders of influenza [7–9, 13]. However, additional data (not publicly reported by county or state) would matter only to the extent that immunization patterns for elementary school–aged children mirrored those of nonelderly adults rather than those for both younger and older children, which we found to be unrelated to adult vaccination coverage.
3. Some Medicare beneficiaries may have obtained influenza vaccination without a claim (for example, at a free vaccination fair or in a facility that required out-of-pocket payment because it did not participate in Medicare) and therefore been misclassified. In that case, the interaction with vaccination may be stronger than we observed.
4. Because our data comprised urban areas, results may not be generalizable to rural counties with fewer contacts between community members.
5. Because we estimated vaccination coverage throughout influenza season, actual coverage may have been lower at the time of diagnosis.
6. In 2013–2014, US vaccination coverage among nonelderly adults rose to 36.7% [1], slightly above the mean for counties in our highest coverage group (35.3%). Although we cannot distinguish the association of further increases in vaccination coverage with influenza-related illness in the elderly, coverage in some states with a high proportion of retirees remains below the national average (eg, 26.7% in Florida) [1].
7. Finally, the Fluzone high-dose vaccine (Sanofi Pasteur), introduced in December 2009 [43], may alter the strength of observed relationships.
Conclusions
In a large, nationwide sample of Medicare beneficiaries, the odds of influenza-related illness was lower in areas with higher vaccination coverage among 18–64 year-olds. These results may help inform both influenza vaccination policy and physician-patient discussions about the benefits of influenza vaccination.
Notes
Acknowledgments. We thank Nancy L. Keating, MD, MPH, for helpful comments and advice. This study began while G. B. T. was with the Departments of Population Health and Medicine, New York University School of Medicine, New York.
Author contributions. G. B. T. conceived the research idea, conducted the statistical analysis, and wrote the first draft of the manuscript. G. B. T. and D. M. C. designed the study and acquired the data. All authors analyzed and interpreted the data, contributed to the interpretation of the results and critical revision of the manuscript for important intellectual content, approved the final version of the manuscript, and serve as guarantors.
Disclaimer. The funding source had no role in study design; in the collection, analysis, and interpretation of data; in the writing of the report; or in the decision to submit the article for publication.
Financial support. This study was supported in part by the Clinical and Translational Science Collaborative of Cleveland (grant KL2TR000440) and New York University (CTSA grant UL1TR000038), both from the National Center for Advancing Translational Sciences, National Institutes of Health.
Potential conflicts of interest. D. M. C. discloses outside activities at http://scholar.harvard.edu/cutler/content/outside-activities. All other authors report no potential conflicts.
All authors have submitted the ICMJE Form for Disclosure of Potential Conflicts of Interest. Conflicts that the editors consider relevant to the content of the manuscript have been disclosed.
References

