


Abstract
We developed a highly efficient composite quantum chemical method tailored for biomass-derived molecules. The method achieves chemical accuracy in evaluating CCSD(T)/CBS correlation energies and enthalpies of formation while reducing computational costs by over 2 orders of magnitude. This efficiency makes large-scale thermodynamic analysis feasible. Furthermore, the approach can be extended to condensed-phase and catalytic systems, enabling quantitative insights into biomass conversion and related chemical processes in diverse environments.
Converting plant-derived biomass, i.e. lignocellulosic biomass, into valuable materials and promoting its reuse are crucial for achieving a sustainable society. In this process, polymers such as cellulose, hemicellulose, and lignin undergo pyrolysis, breaking down into low-molecular-weight fuels and gases. A detailed understanding and precise control of the reaction pathways in pyrolysis1,2 are essential for enhancing lignocellulosic biomass utilization efficiency. Extensive experimental3–6 and theoretical7 investigations, including studies on catalytic effects,8,9 have been conducted to elucidate the kinetics of these processes.
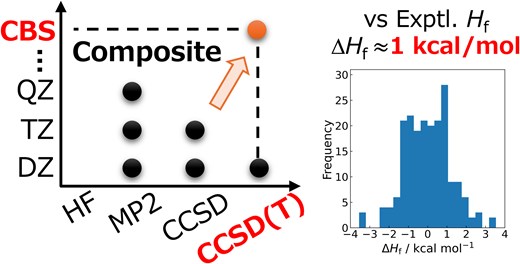
Quantum chemical calculations offer a powerful approach for evaluating the thermodynamic properties of molecules. To achieve a quantitatively reliable description of chemical phenomena, an accuracy of approximately 1 kcal/mol—often referred to as chemical accuracy—is required. Among quantum chemical methods, coupled cluster theory with singles, doubles, and perturbative triples in the complete basis set limit (CCSD(T)/CBS) is widely regarded as the gold standard due to its exceptional accuracy in describing electron correlation effects. However, the prohibitively high computational cost of CCSD(T)/CBS significantly limits its applicability to the large number of chemical species involved in lignocellulosic biomass pyrolysis.
To address this challenge, we have developed a composite method that accurately predicts CCSD(T)/CBS energies by combining lower-cost electron correlation methods.10 In this study, we applied our composite method to estimate the thermodynamic properties of lignocellulosic biomass-derived molecules with high accuracy. Specifically, we re-optimized the method's parameters for lignocellulosic biomass-related species and evaluated both its accuracy and computational efficiency in calculating enthalpies of formation.
First, we describe the procedure for calculating correlation energies using the composite method and the determination of its parameters. In the following discussion, the double-, triple-, and quadruple-zeta basis sets (DZ, TZ, and QZ) correspond to the Dunning cc-pVXZ series. The electronic energy (Eelec) at the CCSD(T)/CBS level is expressed by Eq. (1):
where represents the Hartree–Fock energy extrapolated to the complete basis set (CBS) limit using DZ, TZ, and QZ basis sets.11 The term denotes the CCSD(T)/CBS correlation energy, which is predicted by the composite method through a linear combination of correlation energies obtained from several electron correlation methods and basis sets,10 as given by Eq. (2):
In Eq. (2), E represents correlation energies computed at the MP2/XZ (X = D, T, Q), CCSD/YZ (Y = D, T), and CCSD(T)/DZ levels, while c denotes the corresponding coefficients. The reference CCSD(T)/CBS correlation energies, required for parameterizing the composite method, were obtained using an extrapolation method12 described by Eq. (3):
In this study, CCSD(T)/TZ and CCSD(T)/QZ calculations were employed to estimate the reference CCSD(T)/CBS energy. The coefficients of the composite method were determined using classical linear regression.
Experimental enthalpies of formation were compiled for 200 organic molecules composed of carbon, oxygen, and hydrogen, containing up to 8 carbon or oxygen atoms. Compared with the sets applied in the original development of the composite method, the present set contains a wider range of functional groups and larger molecules. The experimental values were sourced from a reference13 or the NIST Chemistry WebBook.14,15 A complete list of experimental values is provided in Supplementary material. Among these, reference CCSD(T)/CBS energies were calculated for 179 relatively small molecules and used to parameterize the composite method, while the remaining 21 larger molecules were designated as an untrained set.
The initial 3-dimensional molecular structures were generated using CORINA Classic software.16 Structural optimizations and single-point calculations were performed with the Gaussian16 program.17 Optimization and vibrational frequency calculations were conducted using density functional theory (DFT) with the ωB97X-D exchange-correlation functional and the aug-cc-pVTZ basis set. Computations were carried out on an AMD EPYC 7763 CPU. For enthalpy calculations, standard thermodynamic corrections, including vibrational contributions from DFT, were applied at 298.15 K. In the enthalpy of formation calculations, reference standard enthalpies for H2, O2, and graphite were required. The values for H2 and O2 were derived from computed standard enthalpies, while the standard enthalpy of graphite was determined by combining the experimental enthalpy of formation of CH4 with the computed standard enthalpies of CH4 and H2.
Table 1 presents the re-optimized parameters of the composite method, compared with those previously proposed. The coefficients corresponding to each combination of electron correlation method and basis set are listed for both the original parameters (“Original”) and the newly optimized ones (“Biomass”). The signs of the coefficients remain consistent between the 2 sets, indicating that the optimized parameters retain similar properties to the original ones. Additionally, the absolute values of the Biomass coefficients tend to be smaller, likely due to the high structural similarity among the lignocellulosic biomass molecules used for parameterization.
Coefficients of composite methods.
| Method | Basis set | Original | Biomass |
|---|---|---|---|
| MP2 | DZ | 0.4236 | 0.2956 |
| MP2 | TZ | −1.9340 | −1.7296 |
| MP2 | QZ | 1.5360 | 1.4851 |
| CCSD | DZ | −1.9603 | −1.7602 |
| CCSD | TZ | 1.6230 | 1.4909 |
| CCSD(T) | DZ | 1.2853 | 1.1935 |
| Method | Basis set | Original | Biomass |
|---|---|---|---|
| MP2 | DZ | 0.4236 | 0.2956 |
| MP2 | TZ | −1.9340 | −1.7296 |
| MP2 | QZ | 1.5360 | 1.4851 |
| CCSD | DZ | −1.9603 | −1.7602 |
| CCSD | TZ | 1.6230 | 1.4909 |
| CCSD(T) | DZ | 1.2853 | 1.1935 |
Table 2 reports the mean absolute deviations (MAD) between the calculated and reference CCSD(T)/CBS correlation energies for the 179 molecules in the training set. For comparison, the correlation energies applied to composite method and reference calculations are listed. The composite methods exhibited significantly low MAD values of 0.2 kcal/mol and 0.075 kcal/mol for the Original and Biomass parameters, respectively. In contrast, even CCSD(T)/QZ yielded a MAD exceeding 25 kcal/mol. The Biomass composite method further improved accuracy, although the Original composite method had already achieved a high level of precision, highlighting the robustness and general applicability of the approach.
Deviation of calculated correlation energies from reference CCSD(T)/CBS values.
| Method | Basis set | MAD/kcal mol−1 |
|---|---|---|
| MP2 | DZ | 223.311 |
| MP2 | TZ | 111.673 |
| MP2 | QZ | 72.914 |
| CCSD | DZ | 188.101 |
| CCSD | TZ | 85.298 |
| CCSD(T) | DZ | 172.083 |
| CCSD(T) | TZ | 59.760 |
| CCSD(T) | QZ | 25.211 |
| Original composite | 0.200 | |
| Biomass composite | 0.075 | |
The enthalpies of formation (Hf) of 200 molecules were computed using various methods and compared with experimental values. Table 3 summarizes the resulting errors, including mean absolute errors (MAE), maximum errors (MaxE), and computational times. The computational time is reported as the average per molecule. For the composite method, the time corresponds to the sum of the computation times for the electron correlation energies used in Eq. (2). For the reference CCSD(T)/CBS values, the total time includes the combined CCSD(T)/TZ and CCSD(T)/QZ calculations.
Errors in enthalpies of formation relative to experimental values and computational times.
| Method | Basis set | Trained set | Untrained set | ||||
|---|---|---|---|---|---|---|---|
| ΔHf/kcal mol−1 | CPU time/min | ΔHf/kcal mol−1 | CPU time/min | ||||
| MAE | MaxE | MAE | MaxE | ||||
| MP2 | DZ | 3.81 | 17.74 | 0.3 | 3.02 | 11.06 | 0.7 |
| MP2 | TZ | 1.78 | 7.03 | 6.1 | 2.81 | 6.83 | 16.2 |
| MP2 | QZ | 3.24 | 9.52 | 79.3 | 5.51 | 10.74 | 195.5 |
| CCSD | DZ | 6.06 | 25.77 | 2.4 | 11.33 | 18.78 | 8.1 |
| CCSD | TZ | 6.03 | 15.41 | 81.5 | 9.50 | 16.95 | 334.7 |
| CCSD(T) | DZ | 3.99 | 24.39 | 10.7 | 6.48 | 14.84 | 46.4 |
| CCSD(T) | TZ | 2.24 | 8.74 | 319.9 | … | … | … |
| CCSD(T) | QZ | 1.05 | 4.82 | 19022.6 | … | … | … |
| Original composite | 0.83 | 3.62 | 180.3 | 0.90 | 2.06 | 601.6 | |
| Biomass composite | 0.96 | 3.55 | 180.3 | 0.96 | 2.37 | 601.6 | |
| CCSD(T) | CBS | 0.94 | 3.49 | 19342.6 | … | … | … |
For the trained set, only the composite methods and CCSD(T)/CBS reproduced the experimental enthalpies of formation with MAEs below 1 kcal/mol. Their maximum errors were 3.62, 3.55, and 3.49 kcal/mol for the Original composite, Biomass composite, and CCSD(T)/CBS, respectively, showing comparable accuracy. The slightly lower MAE of the Original composite might be due to error cancellation between correlation and vibrational contributions. As shown in Table 2, the Biomass composite reproduces CCSD(T)/CBS correlation energies more faithfully, indicating that its agreement with MAE of CCSD(T)/CBS is founded on a more robust physical description. Notably, the composite method estimated energies approximately 107 times faster than the reference CCSD(T)/CBS calculations while also surpassing CCSD(T)/TZ in both speed and accuracy. For the untrained set of larger molecules, the composite method maintained a similar level of accuracy, demonstrating minimal size dependency and strong generalizability. The average computation time for a single large molecule using the composite method was approximately 10 h, whereas direct CCSD(T)/CBS calculations would require nearly 100 times longer, making them impractical for large-scale applications.
Finally, Fig. 1 illustrates the distribution of ΔHf values obtained using the composite method for all 200 molecules. The majority of values lie within ±1 kcal/mol, confirming that chemical accuracy was achieved across a broad range of molecular species. No systematic bias toward overestimation or underestimation was observed. Overall, these results highlight the suitability of the composite method for practical applications involving diverse lignocellulosic biomass-derived molecules.
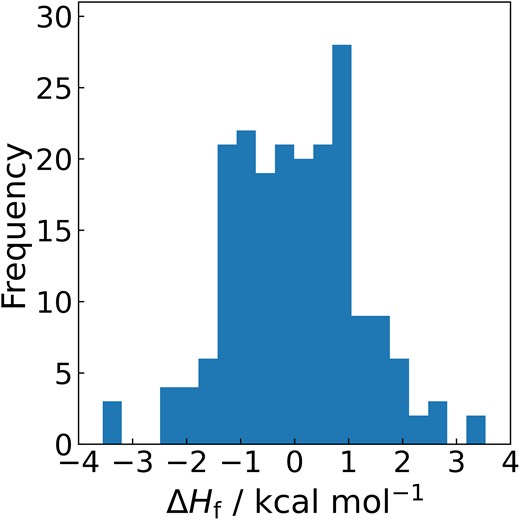
Distribution of enthalpy of formation errors between experimental data and values predicted by the composite method.
In summary, we have re-optimized the parameters of a composite method specifically for lignocellulosic biomass-derived molecules and applied it to evaluate CCSD(T)/CBS correlation energies and enthalpies of formation for 200 compounds. The composite method achieves an average error of less than 0.1 kcal/mol for CCSD(T)/CBS correlation energies and reproduces experimental enthalpies of formation with an average error below 1 kcal/mol, all while being more than 100 times faster than direct CCSD(T)/CBS calculations. These results confirm that the composite method meets chemical accuracy and enables reliable quantitative analysis of chemical phenomena at a significantly reduced computational cost.
While this study has focused on gas-phase molecules, the computed energies can be extended to liquid-phase systems and catalytic surfaces by incorporating independently obtained solvation and adsorption energies. This extension will further enhance the applicability of the method, allowing for the thermodynamic evaluation of lignocellulosic biomass conversion processes in more complex reaction environments.
Acknowledgments
The computation was performed using the Research Center for Computational Science, Okazaki, Japan (Project: 24-IMS-C039).
Supplementary data
Supplementary material is available at Chemistry Letters online.
Funding
This work was supported by Demonstration Project of Innovative Catalyst Technology for Decarbonization through Regional Resource Recycling, the Ministry of the Environment, Government of Japan. M. F. is grateful to the financial support by the Grant-in-Aid for Transformative Research Areas (A) Digitalization-driven Transformative Organic Synthesis (Digi-TOS) (KAKENHI Grant Number JP24H01096) from the Japan Society for the Promotion of Science.
References
[accessed 2025 Mar]. https://webbook.nist.gov/chemistry/.
[accessed 2025 Mar]. https://mn-am.com/products/corina/.
Author notes
Conflict of interest statement. None declared.
