


Abstract
Evidence has linked head trauma to increased risk factors for neuropathology, including mechanical deformation of the sulcal fundus and, later, perivascular accumulation of hyperphosphorylated tau adjacent to these spaces related to chronic traumatic encephalopathy. However, little is known about microstructural abnormalities and cellular dyshomeostasis in acute mild traumatic brain injury in humans, particularly in the cortex. To address this gap, we designed the first architectonically motivated quantitative susceptibility mapping study to assess regional patterns of net positive (iron-related) and net negative (myelin-, calcium-, and protein-related) magnetic susceptibility across 34 cortical regions of interest following mild traumatic brain injury. Bilateral, between-group analyses sensitive to cortical depth and curvature were conducted between 25 males with acute (<14 d) sports-related mild traumatic brain injury and 25 age-matched male controls. Results suggest a trauma-induced increase in net positive susceptibility focal to superficial, perivascular-adjacent spaces in the parahippocampal sulcus. Decreases in net negative susceptibility values in distinct voxel populations within the same region indicate a potential dual pathology of neural substrates. These mild traumatic brain injury–related patterns were distinct from age-related processes revealed by correlation analyses. Our findings suggest depth- and curvature-specific deposition of biological substrates in cortical tissue convergent with features of misfolded proteins in trauma-related neurodegeneration.
Introduction
Mild traumatic brain injury (mTBI) is responsible for up to 90% of the estimated 50 to 60 million annual incidents of traumatic brain injury worldwide, which represents a ∼$400 USD billion global economic burden (Howe et al. 2022; Maas et al. 2022). In addition to economic impacts, exposure to mild head trauma is a major public health concern. mTBI is associated with adverse mental health effects, cognitive decline, increased risk of neurodegenerative disease (Guskiewicz et al. 2007; McInnes et al. 2017), and premature mortality (Mackay et al. 2019). Repeated instances of brain trauma are a well-documented risk factor for the progressive tauopathy known as chronic traumatic encephalopathy (CTE), most often observed in athletes as a result of participation in contact sports, or in military veterans from exposure to blast impacts (McKee et al. 2013, 2023; Bieniek et al. 2015; Ling et al. 2017; Mez et al. 2017, 2020; Bieniek et al. 2020). mTBI is characterized by a primary insult to the brain, affecting tissue microstructure and inducing a cascade of secondary cellular processes, transient states of metabolic distress, and cellular dyshomeostasis (Giza and Hovda 2014). The absence of discernible focal lesions or other macroscopic morphological abnormalities means standard neuroimaging approaches are often insufficiently sensitive to detect mTBI pathology. Advanced neuroimaging methods extending beyond the scope of conventional medical practices may be used to identify the subtle, diffuse (Hier et al. 2021; Lunkova et al. 2021), and heterogeneous changes in brain structure (Cook and Hawley 2014; Wintermark et al. 2015). Despite promising advances toward discovery of mTBI biomarkers, to date, no specific markers of structural brain injury have been identified and assessments are thus restricted to clinical evaluations and self-reported impairments in cognitive and physiological function (McCrea et al. 2017; Lunkova et al. 2021). These assessments may not accurately reflect objective measures of brain injury or recovery status, which can constrain intervention efficacy (Shenton et al. 2012; McCrea et al. 2017).
Investigating the role of biomaterials involved in preserving neuronal homeostasis, including trace elements such as brain iron, represents a promising direction for biomarker research. Iron is essential for proper brain function and is a cofactor in various neuronal processes including neurotransmitter-, myelin-, and DNA synthesis, energy metabolism, and oxidative phosphorylation (Ward et al. 2014b). Cellular concentrations are tightly regulated within neural tissue, and dyshomeostasis has been linked to oxidative stress, DNA and protein damage, inflammation, and ferroptosis (a form of iron-regulated cell death) (Mackenzie et al. 2008; Nisenbaum et al. 2014; Ma et al. 2022). Evidence suggests that iron overload is implicated in both secondary injury and the emergence of pathology downstream (Gozt et al. 2021) including hyperphosphorylation of tau (p-tau) (Yamamoto et al. 2002), highlighting the direct interplay between elevated levels of iron and CTE-like processes. Histologically validated colocalization of iron with abnormal protein accumulations in progressive tauopathies has distinguished brain iron as a hallmark feature of degenerative disorders such as Alzheimer’s and Parkinson’s diseases (AD and PD, respectively) (Zecca et al. 2004; Stankiewicz et al. 2007) and has been cited within neurofibrillary tangles in CTE (Bouras et al. 1997). Despite evidence linking head trauma to increased risk factors for premature iron-related neuropathology (Daglas and Adlard 2018) and increased levels of brain iron in humans following mTBI (Nisenbaum et al. 2014), the association between brain iron accumulation and the pathophysiology of acute sports-related mild traumatic brain injury (sr-mTBI) remains unclear.
Quantitative susceptibility mapping (QSM), an advanced magnetic resonance imaging (MRI) method, measures intrinsic magnetic properties and spatial distributions of biomaterials and molecules (including iron, calcium, protein, and myelin) that are related to brain tissue composition (Duyn and Schenck 2017; Wang et al. 2017; Gong et al. 2019; Kim et al. 2020; Jang et al. 2021; Zhao et al. 2021). The magnetic susceptibility of these materials is proportional to the degree of magnetization exhibited in response to an external magnetic field, such as the main magnetic field of an MRI scanner (B0) (Schweser et al. 2016). Differences in magnetic field perturbation from dia- and para-magnetic compounds in brain tissue create inhomogeneities in the phase maps of gradient-recalled echo (GRE) MRI sequences (Marques and Bowtell 2005; De Rochefort et al. 2010; Langkammer et al. 2015). This mechanism generates contrast in QSM, thereby providing insights into the architecture of the brain and enabling more accurate delineation of many structural boundaries than the corresponding GRE magnitude images (Liu et al. 2015b). Unlike traditional susceptibility-weighted imaging (SWI) from which QSM is derived, this approach can be used to directly quantify the susceptibility of tissue within regions of interest (ROIs), serving as a close approximation of the constituent elements (Liu et al. 2015a; Deistung et al. 2017). Already integral to dementia research (Ravanfar et al. 2021; Nikparast et al. 2022; Uchida et al. 2022; Ghaderi et al. 2024; Mohammadi et al. 2024; Paul et al. 2024), QSM can be extended to investigate potential susceptibility-related pathology resulting from acute sr-mTBI.
A limited number of studies have used QSM to quantify magnetic susceptibility in white matter (WM) and/or subcortical or global gray matter (GM) (Gong et al. 2018; Koch et al. 2018, 2021; Weber et al. 2018; Zivadinov et al. 2018; Brett et al. 2021; Pinky et al. 2022; Wright et al. 2022; Bell et al. 2025) or as a marker of cerebral venous oxygen saturation (Sv02) (Chai et al. 2017; Wright et al. 2022; To et al. 2024). QSM investigations of mTBI-related GM alterations have focused almost exclusively on deep gray nuclei as a proxy for injury effects and cellular degeneration. This is due to the high density of iron in these nuclei related to elevated metabolic demand (Gozt et al. 2021), particularly in the globus pallidus, red nucleus, substantia nigra, putamen, dentate, caudate, and thalamus, relative to the cortical GM (Hallgren and Sourander 1958). These deep GM sites are vulnerable to not only iron-mediated disorders (Haacke et al. 2005) but also damage in mTBI (Raz et al. 2011). However, studies using QSM to investigate mTBI effects have largely overlooked the cortex. This complex structure is characterized by ridges (gyri) and grooves (sulci); curvatures corresponding to the base (fundus) of these sulci are exposed to the greatest force during mTBI, including shear stress (Bakhtiarydavijani et al. 2021) and movement of noncompressible CSF in a phenomenon referred to as the “water hammer effect” (Kornguth et al. 2017).
These cortical, microvascular-adjacent, regions most susceptible to mechanical deformation and injury in mTBI are also the primary loci of degeneration and tauopathy in CTE (Smith et al. 2013; Bieniek et al. 2021; McKee et al. 2023) and warrant careful investigation. The two mTBI-QSM studies to include cortical GM ROIs were either constrained by a macroscopic voxel-wise approach (Gong et al. 2018) or limited to gross segmentations of a small number of cortical ROIs (Pinky et al. 2022). Significantly more anatomical precision is needed to detect depth- or curvature-specific differences in magnetic susceptibility within the cortical mantle after mTBI. The cortex is likely excluded from investigation due to several methodological challenges primarily related to complex cortical architectonics. Firstly, differentiating myeloarchitecture, cytoarchitecture, and cortical laminae using ultrahigh-field, ultrahigh-resolution MRI (such as that acquired at 7T or higher) is a developing area in neuroimaging research (Waehnert et al. 2016). Currently, however, ultrahigh-field MRI is not as widely available, and clinical MRI data are more typically acquired on scanners of lower field strengths such as 3T or 1.5T (Straub et al. 2019). Secondly, standard voxel-wise comparisons and gross segmentations are naïve to the architectonics and distribution of cellular elements within the cortical layers; here, advanced analytic techniques are essential. At magnetic field strengths of 3T or lower, and supra-millimeter voxel resolutions, analysis of specific cortical laminae is inhibited; however, column-based analytic techniques (Waehnert et al. 2014; Ma et al. 2023; Northall et al. 2023; Merenstein et al. 2024) enable depth-wise investigations of magnetic susceptibility in the cerebral cortex and are already producing promising results in AD research (Merenstein et al. 2024).
To address these research gaps, we conducted the first architectonically motivated QSM analysis of cortical mTBI effects. This study aimed to: (i) assess regional patterns of positive (iron-related) and negative (myelin-, protein-, and calcium-related) net magnetic susceptibility as a marker of acute cortical pathology after sr-mTBI and (ii) understand the relationship between magnetic susceptibility in the cerebral cortex and variables such as age, injury latency, and severity. Based on prior literature, we hypothesized that differences in susceptibility would likely be evident in the frontal and temporal cortices, which are reported to be vulnerable to injury in mTBI and are among the first to show degenerative effects of brain injury. We expected this distribution to be most prominent in the sulcal fundus due to increased vulnerability to trauma-induced deformation. Based on known effects of age on cortical iron deposition in this age range (Hallgren and Sourander 1958), net positive susceptibility values were hypothesized to show a positive relationship with age; however, correlation analyses remained largely exploratory and without specific a priori hypotheses.
Materials and methods
Approval for this study was granted by both The Auckland University of Technology Ethics Committee ([AUTEC] Date: 2022 February 18, Ref: 22/12) and the Health and Disabilities Ethics Committee ([HDEC] Date: 2022 February 18, Ref: 2022 EXP 11078). The study was conducted following the Declaration of Helsinki, and all participants provided written informed consent prior to data collection. All participants were provisioned a $50NZD food voucher to acknowledge their contribution as well as a $20NZD fuel voucher or taxi chit to cover travel expenses related to MRI scan attendance.
Participants
Data from 25 male contact sports players (M = 21.10 years old [16 to 32], SD = 4.59) with acute sr-mTBI (<14 d; M = 10.40 d, SD = 3.03) and 25 age-matched male controls (M = 21.10 years old [16 to 32], SD = 4.35) were used for this observational, case–control study (see Table 1). Ages were not significantly different between groups (t (48) = 0.00, P = 1.00). Clinical (sr-mTBI) participants were recruited through three Axis Sports Medicine clinics (Auckland, New Zealand) and through community-based pathways including referrals from healthcare professionals and sports team management. All clinical participants received a confirmed diagnosis of sr-mTBI by a licensed physician as a prerequisite for study inclusion and symptom severity was assessed with the Brain Injury Screening Tool (BIST) (Theadom et al. 2021) upon presentation to Axis clinics or electronically after recruitment. Healthy controls were recruited through print and social media advertisements and word-of-mouth. A history of significant medical or neurological conditions unrelated to the scope of this study or contraindication for MRI precluded study participation. Additionally, controls were excluded if they had any recent history of mTBI events (<12 months) or were living with any long-term effects of previous mTBI. All participants completed a 1-h MRI scan and a short demographic questionnaire. All MRI testing was conducted at the Centre for Advanced MRI (CAMRI), Auckland, New Zealand, and relevant scans were reviewed for clinically significant findings by a certified radiologist to ensure participant safety.
Summary of sr-mTBI participant clinical characteristics with reference to healthy controls.
| ID | Age | DSI (days) | BIST score | MOI | MRI findings |
|---|---|---|---|---|---|
| mTBI-01 | <20 | 5 | 140 | Rugby | None |
| mTBI-02 | <20 | 5 | 12 | Rugby | None |
| mTBI-03 | 20s | 6 | 78 | Rugby | None |
| mTBI-04 | <20 | 13 | 18 | Rugby | Small fluid signal spaces in R peritrigonal WM—normal. R caudate cleft along ventricular surface—possibly developmental or from old ischaemic insult |
| mTBI-05 | <20 | 12 | 61 | Rugby | None |
| mTBI-06 | 20s | 13 | 42 | Rugby | None |
| mTBI-07 | 20s | 13 | 13 | Football | Minor artifactual T1 signal in pons |
| mTBI-08 | 20s | 12 | 6 | Hockey | None |
| mTBI-09 | 20s | 6 | 56 | Rugby | Minor R orbital fracture (old) |
| mTBI-10 | <20 | 12 | 54 | Rugby | None |
| mTBI-11 | 20s | 10 | 52 | Rugby | None |
| mTBI-12 | 30s | 13 | 13 | Football | None |
| mTBI-13 | <20 | 5 | 79 | Rugby | None |
| mTBI-14 | 20s | 13 | 2 | Rugby | Small focus of susceptibility in L superior frontal gyrus, possibly vascular or nonspecific hemosiderin |
| mTBI-15 | <20 | 13 | 22 | Rugby | None |
| mTBI-16 | <20 | 8 | 117 | Futsal | Tiny cleft of fluid signal in R cingulate gyrus—minor developmental anomaly or mature gliosis |
| mTBI-17 | 20s | 13 | * | Rugby | None |
| mTBI-18 | 20s | 10 | 34 | Gymnastics | None |
| mTBI-19 | 20s | 13 | 28 | Jiu-jitsu | Some artifactual DWI signal in pons |
| mTBI-20 | 20s | 11 | 69 | Surfing | Tiny susceptibility site in R temporal lobe—may be vascular |
| mTBI-21 | <20 | 7 | 14 | Rugby | Minor susceptibility in transverse sulcus in R mid temporal lobe—nonspecific, may be vascular or reflect hemosiderin deposition from prior small volume hemorrhage |
| mTBI-22 | <20 | 13 | 39 | Judo | None |
| mTBI-23 | <20 | 9 | 34 | Rugby | None |
| mTBI-24 | <20 | 12 | 68 | Rugby | None |
| mTBI-25 | 20s | 12 | 17 | Rugby | 7 mm pineal cyst—normal limits. Some T1 hyperintensity in R cerebellum—artifact compatible |
| Mean | 21.10 | 10.4 | 44.5 | No findings considered clinically relevant | |
| years | /160 | ||||
| Mean HC | 21.10 years | No findings considered clinically relevant |
Note. Diagnostic assessment is limited to the volume T1, SWI, and DWI sequences with only limited interpretation of the multi-echo T2 stack. Clinical assessments are relevant to identification of micro-hemorrhages, areas of siderosis, T1 appearance, gliosis, volume, ventricular volumes, and non-neurological findings. Age is given in a range to prevent re-identification of participants. Possible range of BIST scores is 0 (min) to 160 (max). Clinical group data correspondent to date at MRI only with the exception of the BIST acquired >24 h postinjury prior to MRI scanning (<14 days post). Abbreviations are as follows: ID, unique identifier; DSI, days since injury; BIST, Brain Injury Screening Tool; MOI, mechanism of injury; MRI, magnetic resonance imaging; L, left; R, right; *, missing data.
Neuroimaging
Acquisition
Advanced MRI data were acquired on a 3T Siemens MAGNETOM Vida Fit scanner (Siemens Healthcare, Erlangen, Germany) equipped with a 20-channel head coil. A 3D flow-compensated single-echo GRE sequence was used to obtain magnitude and phase images for QSM reconstruction at 1 mm isotropic resolution (TR = 30 ms; TE = 20 ms; flip angle (FA) = 15°; slice thickness = 1.0 mm; field of view (FoV) = 180 mm [LR] × 224 mm [AP]; matrix size = 180 × 224 × 160; bandwidth = 101 Hz/px) for a total acquisition time of ∼3.43 min. Additional acquisition parameters included a transversal orientation with right-to-left phase encoding. Wave-CAIPI acceleration was applied (in-plane = 2, 3D = 2) with 30 calibration reference lines in both phase-encode and 3D directions. For each participant, a high-resolution 3D T1-weighted (T1w) anatomical image volume was acquired for coregistration, parcellation and segmentation using a Magnetization-Prepared Rapid Acquisition Gradient Echo (MPRAGE) sequence (TR = 1,940.0 ms; TE = 2.49 ms, FA = 9°; slice thickness = 0.9 mm; FoV = 230 mm; matrix size = 192 × 512 × 512 mm; GRAPPA = 2; voxel size 0.45 × 0.45 × 0.90 mm) for a total acquisition time of ∼4.31 min. T2 maps, resting-state functional MRI data, diffusion-weighted images, and susceptibility-weighted images were also acquired as part of a larger study and analyzed separately. Participant Digital Imaging and Communications in Medicine (DICOM) images were converted to Neuroimaging Informatics Technology Initiative (NIfTI) files and transformed into brain imaging data structure (BIDS) (Gorgolewski et al. 2016) for further processing using Dcm2Bids (Boré et al. 2023) version 3.1.1, which is a wrapper for dcm2niix (Li et al. 2016) (v1.0.20230411).
Anatomical image processing
First, bias field correction was performed on the T1w images for each subject using the N4 algorithm (Tustison et al. 2010) from ANTs (Avants et al. 2011). The bias field–corrected T1w images were processed in FreeSurfer (Fischl 2012) to (i) delineate pial and GM/WM boundary meshes and (ii) generate estimates of cortical thickness and curvature for each vertex (Merenstein et al. 2024). Skull stripping was rerun with additional arguments, including -gcut and adjustments to the watershed threshold as needed, to improve the accuracy of the original FreeSurfer (Fischl 2012) pial surface mesh. The pipeline for T1w and QSM image processing is summarized in Fig. 1.
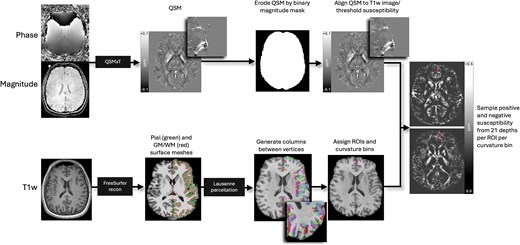
Image processing pipeline. Steps are performed independently and in parallel for each participant. Quantitative susceptibility maps were reconstructed from magnitude and phase images using QSMxT, and eroded by the skull-stripped, binarized magnitude image mask to remove nonbrain sources of susceptibility. QSM images were then aligned to T1w images and thresholded into net positive and net negative susceptibility maps. FreeSurfer recon was used on bias field–corrected T1w images to produce pial and GM/WM boundary surface meshes, and vertex pairs were then joined to create cortical columns. Parcellations of the cortical GM were estimated by feeding the T1w FreeSurfer recon into easy_lausanne. Columns were then assigned specific ROIs and curvature bins and used to sample susceptibility from thresholded QSM maps.
QSM processing
QSM images were reconstructed using QSMxT (Stewart et al. 2022) v6.4.2 (https://qsmxt.github.io/QSMxT/) available as a container via NeuroDesk (Renton et al. 2024) (v2024-03-27), a lightweight virtual environment. QSMxT integrates and automates phase unwrapping using a rapid open-source minimum spanning tree algorithm (Dymerska et al. 2021), background field removal with projection onto dipole fields (Liu et al. 2011), and sparsity-based rapid two-step dipole inversion (Kames et al. 2018); a pipeline congruent with recent consensus statement recommendations for best-practice QSM reconstruction (Bilgic et al. 2023). In this study, QSM was quantified using the average whole-brain susceptibility as the reference. While the selection of an appropriate reference region in QSM remains a topic of ongoing debate (Straub et al. 2017), with each approach involving inherent trade-offs, consensus guidelines support the use of whole-brain susceptibility as a stable and reproducible reference (Bilgic et al. 2023). QSMxT also enables a two-pass combination method for hole filling and artifact reduction (Stewart et al. 2022) which performs parallel QSM masking and reconstruction on susceptibility sources identified as reliable and less reliable. Dual QSM images are then combined into a final integrated image more robust to reconstruction errors and streaking artifacts than those produced using a single-pass approach (Stewart et al. 2022). A brain mask was also generated using FSL’s BET (Smith 2002) to improve masking and hole-filling of the threshold-based selection algorithm (Otsu 1979) used for two-pass QSM.
Subsequent processing was performed locally using FSL (Smith et al. 2004; Woolrich et al. 2009; Jenkinson et al. 2012). For each subject, the raw magnitude image was skull-stripped using FSL’s BET (Smith 2002) with robust brain center estimation and a fractional intensity threshold of between 0.3 and 0.6. Binary masks were derived from the skull-stripped magnitude image and applied to the susceptibility maps to erode non-brain noise around the brain perimeter using fslmaths. Skull-stripped T1w images were used for the linear coregistration of the magnitude image using FMRIB’s Linear Image Registration Tool (FLIRT) (Jenkinson and Smith 2001; Jenkinson et al. 2002; Greve and Fischl 2009) with 12 degrees of freedom (DoF). Due to variability in acquisition parameters, FoV, and matrix size between subject images, the 12 DoF linear registration provided more accurate alignment compared to the 6 DoF alternative, allowing for better compensation of nonrigid anatomical variations upon visual inspection. The resulting transformation matrix was used for spatial normalization of the QSM images to T1w space, effectively upsampling the QSM images. As the analyses are based on cortical depth rather than voxel-wise comparisons, upsampling was not considered a concern. In line with prior research that has used a binary intervoxel thresholding approach (Merenstein et al. 2024), net QSM maps were then thresholded into separate maps of dominant voxel-wise sign with fslmaths. This approach separates values across voxel boundaries above (QSM +) and below (QSM−) zero, thereby isolating predominantly positive (iron-related) voxels from predominantly negative (myelin-, calcium-, and protein-related) voxels (Duyn and Schenck 2017; O’Callaghan et al. 2017; Wang et al. 2017; Gong et al. 2019; Kim et al. 2020; Jang et al. 2021; Zhao et al. 2021) prior to ROI-wise analysis. Traditional QSM maps represent an aggregate of the susceptibility within voxels (Reichenbach 2012), and this intra-voxel averaging can obscure individual susceptibility sources within a voxel. While intra-voxel susceptibility source separation necessitates the acquisition of multi-echo data (Chen et al. 2021; Emmerich et al. 2021; Shin et al. 2021; Ahmed et al. 2023; Li et al. 2023; Lee et al. 2024), a more rudimentary intervoxel thresholding approach can be applied with single-echo data to separate voxels of dominant sign.
Cortical column generation
To generate cortical columns and sample signed susceptibility values, we used a pipeline previously applied to DWI data analysis (Ma et al. 2023) and recently adapted for use with QSM (Merenstein et al. 2024). First, the T1w FreeSurfer (Fischl 2012) recon served as an input into the easy_lausanne tool (https://github.com/mattcieslak/easy_lausanne.git). This stripped-down fork of the open-source Connectome Mapper (Daducci et al. 2012) separates the cortex into five atlases, ranging from 34 to 250 ROIs per hemisphere, according to the Lausanne multiscale atlas (Cammoun et al. 2012). For subsequent analyses, we focused on the atlas with 34 ROIs per hemisphere, which is equivalent to the Desikan–Killiany atlas (Desikan et al. 2006) native to FreeSurfer (Fischl 2012).
Cortical columns were created for each hemisphere in T1w space with write_mrtrix_tracks (Tournier et al. 2019) in MATLAB (version R2024a), which was used to connect vertex pairs between the pial and GM/WM boundary surface meshes. As such, use of the term “column” in this context denotes a straight line orthogonal to the cortical surface (Merenstein et al. 2024), extending from the pial surface to the GM/WM boundary, rather than implying distinct cortical cytoarchitecture (Brodmann 1909). Each cortical column was segmented into 21 equidistant depths, each with a step size of 5% of the cortical thickness (Waehnert et al. 2014, 2016), from the pial surface to the GM/WM boundary using MRtrix3 tckresample (Tournier et al. 2019). Here, the step-wise depths represent the 21 equidistant segmentations rather than specific cellular laminae (LI to LVI) of the cortex. It is important to distinguish results produced using this approach from ultrahigh field investigations of cyto- and myelo-architecture in the cerebral cortex; results described herein are related to cortical “depth” rather than “layer.” The columns were categorized based on cortical curvature, derived from FreeSurfer’s (Fischl 2012) Gaussian curvature values at each GM/WM boundary vertex (Pienaar et al. 2008) and quantified in units of 1/mm2. The categories included the gyral crown (curvature values: −0.6 to −0.1), sulcal bank (−0.1 to 0.1), and sulcal fundus (0.1 to 0.6) (Merenstein et al. 2024). Positive curvature values indicated sulci, while negative values indicated gyri, with higher values corresponding to deeper curvatures (Merenstein et al. 2024). Only columns ranging from 0.5 to 6 mm in length were included in the analysis to capture plausible cortical morphology (Fischl and Dale 2000). Depth was measured in percentage of cortical thickness rather than absolute metrics (mm) to mitigate any variability between control and clinical participants.
Statistical analyses
To provide a detailed analysis of microstructural differences associated with sr-mTBI while maintaining result granularity, we performed analyses at the bilateral regional level using MATLAB (2024a). Average net positive and net negative susceptibility values were extracted from 21 cortical depths for all 34 ROIs. Each ROI was analyzed by an independent curvature bin (gyral crown, sulcal bank, and sulcal fundus) as well as combined curvature as a whole-ROI measure. Between-group analyses were conducted using two-tailed independent-sample t-tests. To control for multiple comparisons and align with prior research (Merenstein et al. 2024), we applied a false discovery rate (FDR) correction (Benjamini and Hochberg 1995) to the P-values for 21 comparisons (one for each depth) for each ROI/curvature profile. Due to precise age-matching of participants, age was not considered a covariate or confounding variable of interest for between-group comparisons. However, to explore the relationship between QSM values and age in the entire sample, two-tailed partial Pearson correlation coefficients were calculated between age and both net positive and net negative susceptibility values independently for all 34 curvature-combined ROIs, at each depth, while controlling for group effects. To explore the relationship between susceptibility values and other sr-mTBI-related variables, two-tailed Pearson correlation coefficients were also calculated between BIST scores and injury latency (days since injury [DSI]) and both net positive and net negative susceptibility values independently for the sr-mTBI sample only. Net negative susceptibility values were multiplied by −1 to convert them to absolute values, ensuring a consistent directional interpretation in all correlational analyses and more intuitive visualization. mTBI-17 was excluded from correlations between BIST and both net susceptibility signs due to missing data. Correlations were also corrected for 21 depth-wise comparisons using FDR procedures (Benjamini and Hochberg 1995). Given the limited sample size and the need to conserve degrees of freedom in this exploratory study, regression analyses were deliberately omitted.
Results
Regional depth and curvature
Net positive susceptibility
Across bilateral depth profiles, participants with sr-mTBI exhibited significantly higher net positive susceptibility than controls in the temporal lobe only (see Fig. 2A), specifically in superficial depths of the sulcal bank and fundus of the parahippocampal gyrus, a finding that was conserved when curvature was combined as a whole-ROI measure (see also Fig. 3.1A and Fig. 3.2A). Susceptibility was decreased following sr-mTBI in the superficial gyral crown of the rostral medial prefrontal cortex (mPFC) and superficially in the frontal pole when curvature was combined. No significant differences between groups were found in bilateral susceptibility values in parietal, occipital, or insular lobes.
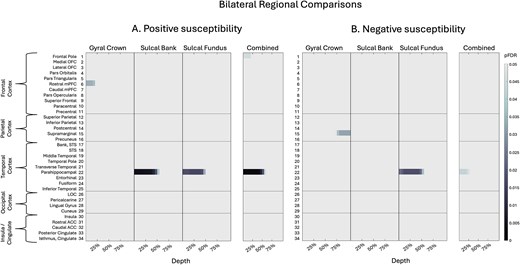
Bilateral regional curvature and depth results. Color maps demonstrate differences in magnetic susceptibility at each cortical depth (where 0% depth is proximal to the pial surface and increases toward the GM/WM boundary at 100% depth), separately for each curvature bin (crown, bank, fundus) as well as combined curvature as a whole-ROI measure. Two-tailed independent-sample t-tests examined group differences in net susceptibility at each depth, for each curvature, at each ROI. P-values were corrected for multiple comparisons across 21 cortical depths using FDR. A) Net positive susceptibility values were significantly more positive for participants with sr-mTBI than healthy controls in temporal ROIs and significantly less positive in frontal regions only. B) Net negative susceptibility values were significantly less negative for sr-mTBI participants than controls in temporal ROIs and significantly more negative in parietal ROIs. OFC = orbitofrontal cortex; mPFC = middle prefrontal cortex; STS = superior temporal sulcus; LOC = lateral occipital cortex; ACC = anterior cingulate cortex. Figure based on Merenstein et al. (2024).
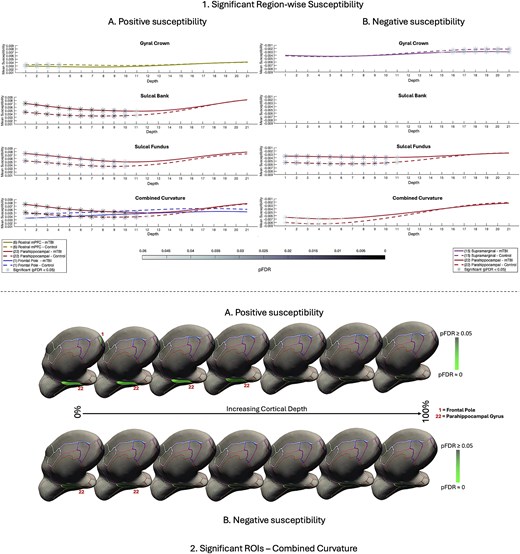
Significant region-wise susceptibility values. 1) Differences in net sign-wise susceptibility values between mTBI participants and controls for significant regions of interest only. A) Net positive susceptibility values were significantly higher for participants with mTBI than healthy controls in superficial depths of the sulcal bank and fundus of the parahippocampal gyrus, as well as when curvature was combined. Values were significantly less positive for mTBI participants superficially in the gyral crown of the rostral mPFC and the superficial frontal pole when curvature was combined. B) Net negative susceptibility values were significantly less negative for mTBI participants than controls in the superficial depths of sulcal fundus in the parahippocampal gyrus, as well as when curvature was combined. Values were significantly more negative after mTBI deep in the supramarginal gyral crown. Susceptibility is measured in parts per million (ppm). mPFC = middle prefrontal cortex. 2) Medial visualization of significant ROIs after mTBI for both net positive A) and net negative B) susceptibility maps when curvature was combined as a whole-ROI measure. Surface lines demarcate borders between ROIs, projected onto an inflated surface. Significant ROIs are filled; intensity values relate directly to pFDR significance level. For visualization purposes, depth was reduced from 21 to 7 by averaging pFDR values every 3 consecutive depths where 0% is proximal to the pial surface and 100% to the GM/WM interface.
Net negative susceptibility
Across bilateral depth profiles, participants with sr-mTBI exhibited significantly less net negative susceptibility than controls in the temporal lobe only (see Fig. 2B). This finding was focal to the superficial depths of the fundus in the parahippocampal gyrus, as well as when curvature was combined (see also Fig. 3.1B and Fig. 3.2B). Net negative susceptibility was more negative for participants with sr-mTBI deep in the supramarginal gyral crown of the parietal cortex only. No significant differences between groups for curvature were found in the sulcal bank (see Fig. 3B). No significant differences were found in bilateral frontal, occipital, or insular lobes.
Age and bilateral regional net susceptibility
Net positive susceptibility
We observed significant positive correlations between age and iron-related net positive susceptibility distributions exclusively at deeper cortical depths near the GM/WM interface (see Fig. 4A(i)). In the frontal cortex, regions with statistically significant age-related increases in net positive susceptibility values included the pars orbitalis, pars triangularis, superior frontal gyrus, paracentral lobule, and precentral gyrus. In the parietal cortex, significant regions were the superior and inferior parietal lobules, supramarginal gyrus, and precuneus. In the temporal lobe, significant positive correlations were found in the parahippocampal gyrus and inferior temporal gyrus. The only cingulate region to exhibit a positive age-related correlation was the isthmus. No significant positive correlations with age were identified in any ROIs within the occipital cortex. Conversely, we identified significant negative correlations between age and net positive susceptibility exclusively at superficial cortical depths near the pial surface, demonstrating an inverse pattern to the positive correlations. In the frontal cortex, the areas showing significant negative correlations were the pars orbitalis, pars triangularis, superior frontal gyrus, paracentral lobule, and precentral gyrus. In the parietal cortex, the postcentral region exhibited significant negative correlations. No significant negative correlations between net positive susceptibility and age were apparent in temporal, occipital, or insular ROIs.
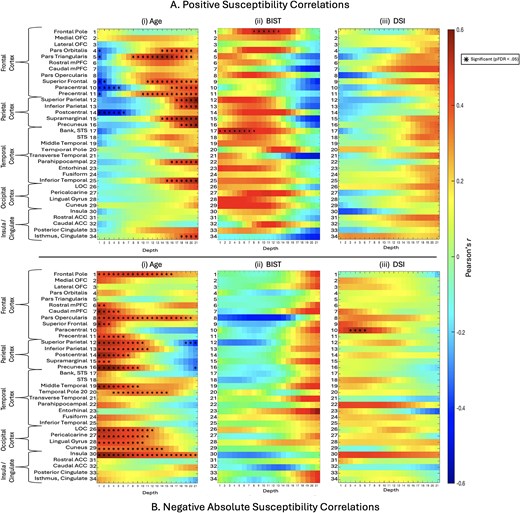
Correlations between positive or negative net susceptibilities and variables of interest. i) The relationship between age and net positive A) and net negative B) susceptibility values was assessed for each depth for combined curvature as a whole-ROI measure using partial correlations to control for the effects of group status. ii) The relationship between BIST scores as a marker for injury severity and net susceptibility sign values was explored, along with. iii) The relationship between net susceptibility sign values and DSI at the time of MRI scan as a marker of injury latency. Net negative B) susceptibility was transformed into absolute values to better represent the relationship between variables. BIST = brain injury screening tool; DSI = days since injury (at time of MRI scan).
Net negative susceptibility
Significant positive relationships were observed between absolute net negative susceptibility values and age, primarily in the superficial depths of ROIs across all lobes, which at times extended to the GM/WM border (see Fig. 4B(i)). In the frontal lobe, ROIs exhibiting significant positive correlations between age and net negative susceptibility included the frontal pole, rostral mPFC, caudal mPFC, pars opercularis, superior frontal gyrus, and precentral gyrus. All examined ROIs in the parietal cortex exhibited significant positive relationships, namely, in the superior parietal lobule, inferior parietal lobule, postcentral gyrus, supramarginal gyrus, and precuneus. In the temporal cortex, significant positive correlations were found in the middle temporal gyrus and temporal pole. All occipital ROIs showed significant positive correlations, including the lateral occipital cortex, pericalcarine cortex, lingual gyrus, and cuneus. Within the insular cortex, only net negative susceptibilities in the insula demonstrated a significant positive relationship with age. In contrast, significant negative correlations with age were observed only in the deeper cortical layers closer to the GM/WM junction of parietal regions, specifically in the superior parietal lobule and precuneus.
Injury severity and bilateral regional net susceptibility
We observed significant positive correlations between BIST scores and net positive susceptibility values in the mid-depths of the frontal pole and in superficial depths of the bank of the superior temporal sulcus (see Fig. 4A(ii)). No significant correlations were observed between net negative susceptibility and BIST scores (see Fig. 4B(ii)).
Injury latency and bilateral regional net susceptibility
No significant correlations between DSI at time of MRI and net positive susceptibility values were observed for any ROI (see Fig. 4A(iii)). Net negative susceptibility and DSI were positively correlated in superficial depths of the bilateral paracentral gyrus in the frontal cortex only (see Fig. 4B(iii)).
Discussion
Previous research seeking to understand the role of brain iron following mTBI has focused primarily on susceptibility distributions in subcortical or global GM and/or WM, largely neglecting the vulnerability of cortical regions to microstructural damage following an mTBI. The two investigations inclusive of cortical ROIs were constrained either by macroscopic voxel-wise techniques or a limited number of gross segmentations, which lack the anatomical precision necessary to detect depth- or curvature-specific differences in magnetic susceptibility. To address this gap in the literature, we adapted a new analytic technique already demonstrating efficacy in AD research to perform the first investigation of sr-mTBI-related differences in magnetic susceptibility as a function of cortical depth and curvature. In line with prior QSM research (Merenstein et al. 2024), we thresholded net QSM maps into separate maps of dominant voxel-wise sign to isolate net voxel-wise sign values for analysis.
Our findings revealed increased net positive susceptibility exclusive to the temporal lobe, specifically in the superficial depths at sulcal curvatures in the bilateral parahippocampal gyrus. This pattern was conserved when curvature was aggregated as a whole-ROI measure. In contrast, age-related net positive susceptibility indicative of iron deposition was observed at deep cortical depths, closer to the interface with the white matter, in the overall sample. These findings suggest that increases in net positive susceptibility close to the cortical surface indicate abnormal, injury-related iron accumulation after mTBI. Results corresponded with analyses of net negative susceptibility, which was less negative in the superficial depths of the sulcal parahippocampal gyrus after mild brain trauma. In addition, net negative susceptibility was positively correlated with age in superficial depths only, suggesting possible age-related calcification processes occurring in superficial cortical layers; a pattern opposite to mTBI-related net negative susceptibility effects. Fewer correlations were found between subjective injury status or time elapsed since injury and susceptibility, supporting a body of research demonstrating little relationship between objective injury measures and subjective self-report.
Depth
In vitro histological studies have demonstrated variations in iron distribution relative to specific cortical laminae (e.g., Perls iron staining), where concentrations are lowest at the pial surface and increase progressively through GM toward its junction with WM (Fukunaga et al. 2010). These findings have been corroborated by iron-sensitive R2* mapping of ex vivo tissue samples using ultrahigh-field (7T) MRI (Fukunaga et al. 2010), which also exhibit high congruence with in vivo QSM (Shin et al. 2021). Taken together, these studies suggest that iron density in the cortex reflects distinct cyto- and myelo-architecture, with variance between layers. In healthy populations, iron density should be sparse at the pial surface and increase with depth. Conversely, our findings indicate an abnormal distribution pattern of net positive susceptibility related to iron deposition exclusively in superficial depths of the parahippocampal gyrus in the temporal cortex following injury (see Fig. 2A, Fig. 3.1A, and Fig. 3.2A). This increased net positive susceptibility at the acute stage of mTBI is directly inverted for depth comparative to healthy layer–specific variation (Fukunaga et al. 2010; Shin et al. 2021) and patterns related to normal aging in this range of the lifespan (see Fig. 4A(i)), suggesting an injury-specific model of cortical microstructural trauma (see Fig. 5).
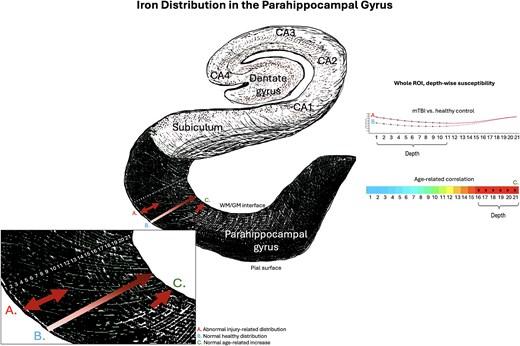
Iron and net positive susceptibility distributions in the parahippocampal gyrus. Visualization of depth-specific net positive (iron-related) susceptibility distributions. A) Depicts increased net positive susceptibility following mTBI relative to healthy controls restricted to superficial depths of the parahippocampal gyrus. This pattern does not overlap with B) validated patterns of lower iron concentration proximal to the pial surface and increasing toward the GM/WM interface as a pattern of normal layer-specific distributions, or C) normal age-related increases in net positive susceptibility in this population (16 to 32 years) restricted to the deeper cortical depths closer to the GM/WM boundary. Depiction of the hippocampal formation inspired by the illustration in Ranson and Clark (1959).
The focal nature of increased net positive susceptibility in superficial depths suggests iron accumulation near small blood vessels (McKee et al. 2013). Concordantly, microhemorrhage and aggregation of activated microglia around perivascular sites are well documented after mTBI (Nisenbaum et al. 2014; Mckee and Daneshvar 2015; Huang et al. 2021). Here, it is tempting to speculate about potential mechanisms of iron overload following mTBI. Nonheme iron (i.e., bound to proteins such as ferritin and transferrin) generally enters the brain through active transport across the blood–brain barrier (BBB) via vascular endothelial cells; a constant process that is closely regulated within the central nervous system to ensure homeostasis (Gozt et al. 2021). Injury-induced acute cerebral microvascular dysfunction and increased permeability of the BBB (Sandsmark et al. 2019; Wu et al. 2020) likely increase iron transport into these superficial cortical layers (Ward et al. 2014b; Levi et al. 2024), which could result in a perivascular accumulation of iron. Notably, redox reactions involving nonheme iron are a significant source of reactive oxygen species (ROS) (Nisenbaum et al. 2014); when labile iron accumulates to pathological levels, it can exceed the capacity of storage proteins inducing oxidative stress, protein and DNA damage, and ferroptosis (Kruszewski 2003; Nisenbaum et al. 2014; Ward et al. 2014b). This labile iron is frequently considered a critical contributor to secondary injury mechanisms (Nisenbaum et al. 2014; Gozt et al. 2021; Huang et al. 2021) and represents the primary source of paramagnetic susceptibility in the brain on QSM (Langkammer et al. 2012). As such, iron accumulation acting as a catalyst for auto-toxic circuits (Levi et al. 2024) is a candidate hypothesis by which iron dyshomeostasis after mTBI could account for the increased net positive magnetic susceptibility of these compromised perivascular regions on QSM. Iron overload may represent a promising early marker of acute cell damage and mTBI-related neuropathology as well as degeneration of neural tissue downstream. However, as the precise mechanisms by which iron is released in the brain are still under investigation (Zecca et al. 2004; Gozt et al. 2021), these mechanisms cannot yet be disambiguated.
While the relationship between positive susceptibility and paramagnetic iron is well established, the mechanisms underlying diamagnetic sources of contrast are less well understood and more challenging to elucidate (Madden and Merenstein 2023; Northall et al. 2023; Merenstein et al. 2024). Recent research indicates that the primary source of diamagnetic contrast is myelin (Deh et al. 2018), but contributions are also made by calcium (Wang et al. 2017; Kim et al. 2020; Jang et al. 2021) and the deposition of proteins such as amyloid-beta (Aβ) and tau (Gong et al. 2019; Zhao et al. 2021). Our results suggest that net negative susceptibility is decreased in the parahippocampal gyrus at superficial depths following mTBI. Myeloarchitecture studies indicate that Layer I of the cerebral cortex consists primarily of axons, dendrites, and axon terminals, the cell bodies of which are located in deeper layers (Miyashita 2022). Although the cerebral cortex is not well known for high myelin content (Northall et al. 2023), decreased net negative susceptibility at these superficial depths could indicate changes to surface axons. This pattern coincided with increased net positive susceptibility in the superficial parahippocampal gyrus, suggesting a dual model of perivascular microstructural trauma focal to this region. The majority of iron present in the human brain parenchyma is stored as nonheme iron within myelin-maintaining oligodendroglia and in myelin itself (Connor and Menzies 1995); pathological iron levels have been known to damage both (Bradl and Lassmann 2010; Lassmann et al. 2012; Hametner et al. 2013). Mechanisms leading to concurrent increases in net positive susceptibility and decreases in net negative susceptibility in distinct voxel populations within the same ROI, as observed in this study, are further supported by research into pathogenesis of multiple sclerosis, which indicates that neuroinflammation and altered BBB permeability can result in iron accumulation in macrophages and other iron-related cytotoxic events, such as oxidative stress, causing degradation of oligodendrocytes and axons (Bradl and Lassmann 2010; Lassmann et al. 2012; Ward et al. 2014b). Research leveraging multi-echo QSM and contemporary magnetic source separation to investigate cortical pathology in MS has also linked decreased negative susceptibility to demyelination, reinforcing the potential role in disease pathology (Straub et al. 2023). Conversely, increased net negative susceptibility was mostly observed at deeper cortical depths closer to the GM/WM junction, which might reflect aggregation of Aβ or tau inherent to AD (Braak and Braak 1991) and CTE (McKee et al. 2023), or calcifications known to negatively affect cognition (Thibault et al. 2007). Notably, the injury-related accumulation patterns did not overlap with age-related changes in net negative susceptibility, which increased at superficial depths (see Fig. 4B(i)). This suggests that both decreased net negative susceptibility in superficial depths and increased net negative susceptibility at deeper cortical depths may result from abnormal, injury-related, neuropathological processes.
Curvature and ROI
Prior research has noted that the sulcal fundus is particularly vulnerable to injury in mTBI due to increased susceptibility to mechanical deformation (Smith et al. 2013; Bakhtiarydavijani et al. 2021; McKee et al. 2023) and the “water hammer effect” (Kornguth et al. 2017). The current study supports a fundus-specific model of damage in mTBI; the only persistent differences between groups in both net positive and net negative susceptibility were observed in sulcal regions of the bilateral parahippocampal gyrus (net positive susceptibility: sulcal bank and fundus; net negative susceptibility: sulcal fundus [see Figs. 2 and 3]). The focal nature of injury to these concave regions extends prior work noting increased mean cortical curvature in the sulcus (King et al. 2016) and sulcal widening (Kornguth et al. 2017) after mTBI. Results are also consistent with observations of mTBI-related vascular injury and microhemorrhage in the sulcal fundus on SWI (Kornguth et al. 2017). Additionally, the inferior medial temporal lobe is a notable site of injury in sr-mTBI (Mckee and Daneshvar 2015) and the parahippocampal gyrus proximal to the sphenoid ridge in TBI (Bigler 2007). Impact with this uneven portion of the skull base combined with reduced protection from dura where this region overlaps with the free edge of the tentorium cerebelli (Bigler 2007), could plausibly explain the differences in net susceptibility values focal to the parahippocampal gyrus. Previous research has also highlighted associations between sr-mTBI and loss of cortical thickness in the parahippocampal gyrus along with reductions in parahippocampal volume (Arciniega et al. 2024).
Contextually, the parahippocampal cortex acts as a hub region in a network connecting areas of the frontal, parietal, and temporal lobes (Raslau et al. 2015) and represents a vital link between the default-mode network and the medial temporal lobe memory system, as evidenced by resting-state fMRI studies (Ward et al. 2014a). As such, it is integral to various cognitive processes including visuospatial processing and episodic memory (Aminoff et al. 2013) and the facilitation of contextual associations fundamental to higher-order cognitive performance (Raslau et al. 2015). The co-occurrence of iron-related net positive susceptibility values and net negative susceptibility values in different voxels within the same ROI, indicating potential myelin changes, particularly in the integrative superficial depths of the temporal parahippocampal gyrus, is consistent with the memory impairments symptomatic of sr-mTBI (Mckee and Daneshvar 2015).
Age and clinical correlates
Increasing iron in deep GM nuclei and some regions of the cortex is a hallmark of normal aging (Hallgren and Sourander 1958; Zecca et al. 2004). Research indicates that age-related iron increases occur primarily in the motor and premotor cortices, as well as the superior prefrontal and parietal cortices (Hallgren and Sourander 1958; Acosta-Cabronero et al. 2016). Additionally, these increases have been reported in the insula (Acosta-Cabronero et al. 2016) and hippocampus (Hagemeier et al. 2012). Histological evidence suggests that normal increases in cortical nonheme iron may be especially pronounced in younger individuals, sharply increasing during childhood and plateauing at around 30 years of age, depending on region (Hallgren and Sourander 1958; Schenck and Zimmerman 2004). These observations are supported by some (Callaghan et al. 2014; Acosta-Cabronero et al. 2016) but not other (Rodrigue et al. 2011) cross-sectional iron-sensitive MRI findings in adjacent age groups. Our findings support age-related cortical iron increases in a youthful population. In line with prior research, ROIs with age-related increases in likely iron content were most dense in frontal and parietal lobes, in addition to two loci in the temporal lobe and one in the insular cortex (see Fig. 4A(i)). Of all cortical regions, the motor system is particularly affected by age-related iron deposition (Acosta-Cabronero et al. 2016), a pattern mirrored in our findings that shows a notable density in the primary motor cortex. Our results suggest that age-related increases are restricted to deeper cortical depths closer to the GM/WM junction, which is known to naturally express higher iron levels in the healthy population (Fukunaga et al. 2010; Shin et al. 2021). These deeper layers contain large pyramidal cells (Miyashita 2022), which could speculatively accumulate iron differently. Indeed, previous research (Merenstein et al. 2024) has suggested that because age is more predictive of delayed response time rather than difficulties in decision-making (Ratcliff 2008; Madden et al. 2020; Merenstein et al. 2023), age-related iron accumulation should show a preference for deeper layers responsible for output rather than more integrative superficial regions (Rolls and Mills 2017).
In addition, we observed age-related increases in net negative magnetic susceptibility exclusively close to the pial surface. Previous studies utilizing negative QSM have shown similar distributions at superficial depths (Northall et al. 2023). This pattern aligns well with research indicating more common occurrences of calcifications in areas with high vascularization and metabolic activity (Jang et al. 2021), such as the cortical surface serviced by the pial arterial vasculature (Bollmann et al. 2022). Taken together, our findings indicate that age-related increases in iron are likely restricted to deep cortical depths, while diamagnetic calcifications are likely to occur at superficial depths. Both observations are supported by strong biological plausibility and well-documented scientific evidence. This reinforces the conclusion that observed differences in both net positive and net negative susceptibility following sr-mTBI reflect pathological processes distinct from those associated with normal aging.
The general lack of correlation between net positive or net negative susceptibilities and BIST scores may be attributed to the under-reporting of symptoms notorious in sr-mTBI (Meier et al. 2015), which would preclude accurate correlations. While iron negatively correlates with cognitive symptoms in mTBI (Lu et al. 2015), it is well documented that subjective assessments of injury severity do not reliably reflect objective brain injury or recovery status (McCrea et al. 2017) and cognitive/clinical symptoms do not align with neuroimaging findings (Shenton et al. 2012). However, the use of an intervoxel thresholding approach applied to traditional QSM maps may still be insensitive to the more subtle changes in tissue composition, which are better estimated using contemporary susceptibility source separation techniques (see, for example, Emmerich et al. 2021 and Shin et al. 2021). Additionally, the lack of correlation between net positive or net negative susceptibilities and injury latency suggests that acute neuropathology may persist into the subacute and chronic stages, necessitating further research to elucidate the time course of secondary injury in sr-mTBI.
Implications
The role of iron in acute responses following cytotrauma, as well as its colocalization with, and involvement in, misfolded proteins in neurodegenerative diseases, including CTE, identifies it as a potential marker of early degenerative processes (Bouras et al. 1997; Zecca et al. 2004). Interestingly, the temporal lobe and hippocampus are primary loci of atrophy and tau deposition in CTE (Murray et al. 2022; McKee et al. 2023), and iron has been found in neurofibrillary tangles within these regions (Bouras et al. 1997). A pathognomonic CTE lesion is characterized by the presence of p-tau in the cortical sulcus and, while this is not restricted to the subpial regions, supportive features of CTE include the presence of neurofibrillary tangles in superficial cortical layers (II/III), primarily in the temporal lobe (Bieniek et al. 2021; McKee et al. 2023). This laminar predilection is not seen in other tauopathies, like AD, where tau phosphorylation generally occurs in deeper layers (V/VI) (Pearson et al. 1985). Notwithstanding the short-term effects of iron overload, which have been linked to secondary injury in mTBI (Nisenbaum et al. 2014; Huang et al. 2021), the association between iron-mediated oxidative stress and hyperphosphorylation of tau (Yamamoto et al. 2002) coupled with the similarity of iron distributions observed in this study to hallmark distributions of tauopathy and degeneration in CTE raises important questions about the disease path from acute injury to eventual tissue degeneration. The precise mechanisms underlying CTE remain an active area of research, but these findings allude to the potential involvement of acute iron dyshomeostasis in degenerative cascades, warranting further investigation. Until such a time, any parallels drawn between the pattern of iron distribution in this study and the features of CTE tauopathy can, at this stage, only be speculative.
Here, follow-up investigations will be of paramount importance. A better understanding of iron and other neurobiological correlates, such as myelin damage or protein aggregation, may be essential for developing effective care and targeted treatments at the acute stage of mTBI, which could protect against adverse consequences later in life. Recent research has explored the possibility of using heavy metal chelation as a therapeutic target for iron in AD (Mazur et al. 2024) and TBI (Daglas and Adlard 2018). In AD, this approach has had limited success, perhaps due to the accumulation of iron over a long time course; once iron overload becomes apparent, cell death has already occurred (Levi et al. 2024). However, mechanisms of acute injury-related iron overload may be distinct from long-term aggregation. Murine models using iron chelators such as deferoxamine (Panter et al. 1992; Long et al. 1996; Zhao et al. 2014; Jia et al. 2023) and N,N-Di(2-hydroxybenzyl)ethylenediamine-N,N-diacetic acid monohydrochloride (HBED) (Khalaf et al. 2019) have shown promise in reducing TBI symptomatology, likely through inhibition of ferroptosis and reductions in neuroinflammation, ROS, and gliosis. More research is needed to understand efficacy in humans, but this remains a possible avenue for limiting the effects of acute iron dyshomeostasis, which may contribute to degenerative effects evident in later life.
Limitations and future research
While QSM offers valuable insights into iron content and distribution, at lower field strengths (i.e., 3T), voxel resolution is restricted and does not reflect specific architectonics of cortical tissue. Cortical column analyses were thus constrained to investigations of depth rather than susceptibility distribution specific to cortical laminae. Future research could benefit from applying cortical column analysis to images with higher resolutions, for example, those collected on high field scanners, or by pushing images to sub-1 mm resolutions insofar as signal-to-noise ratios and acquisition times correspondent to increased participant burden are not overly compromised (for a comparison of data acquired at 3T and 7T, see Straub et al. 2019). The present study utilized a single-echo QSM sequence, limiting thresholding of susceptibility sources to a more rudimentary “between” (versus “within”) voxels approach. It should be noted that this approach can introduce ambiguity regarding the interpretation of the underlying biological substrates. For instance, if a voxel exhibits a net negative susceptibility (indicating diamagnetic dominance), a reduction in the magnitude of this negativity could result either from a loss of diamagnetic material (such as myelin) or from an increase in paramagnetic material (such as iron deposition) that is insufficient to shift the net value to positive but would nonetheless contribute to an overall increase in positive susceptibility when analyzed as part of a raw, continuous map. To address this limitation, we suggest that future studies use multi-echo sequences to enable magnetic source separation “within” individual voxels (Chen et al. 2021; Emmerich et al. 2021; Shin et al. 2021; Ahmed et al. 2023; Li et al. 2023; Lee et al. 2024), thereby enhancing the biological interpretation of the findings and ensuring better alignment with guidelines for best-practice data acquisition (Bilgic et al. 2023).
Incorporating complementary modalities, such as positron emission tomography, would provide a more comprehensive understanding of cellular metabolism and neurobiological processes, potentially linking these to the observed mTBI-related differences and enabling more biologically informed inferences. Inclusion of protein assays, such as blood-based biomarkers, would also aid in creating a more comprehensive picture of the biological consequences of sr-mTBI. A range of potential confounds were not controlled for in this study including prior injuries, genetic predispositions, and environmental influences, which may affect injury severity and presentation (Rosenbaum and Lipton 2012), and future research should consider including additional measures to control for these variables. Given that this study was conducted exclusively in a male cohort that captures data from adolescence and early adulthood (i.e., ages 16 to 32), the generalizability of the findings to older or younger athletes and females may be limited. Sex differences in injury effects are reportedly influenced by a range of factors, including hormonal variations (Wunderle et al. 2014), the use of oral contraceptives (Gallagher et al. 2018), and differences in neck musculature (Tierney et al. 2005). Future research should extend investigations to female athletes and consider comparisons by sex. Future studies should also aim to include a broader age spectrum to further explore the interaction between age and susceptibility in mTBI. Here, it should be noted that age-related regional cortical iron accumulation is generally most pronounced up until the third decade of life (Hallgren and Sourander 1958) and research using cohorts with a broader age range should incorporate statistical modeling that accounts for differential iron deposition with age. Finally, given the limitations of inferring long-term consequences of sr-mTBI from data collected at the acute stage, future research should prioritize longitudinal studies tracking athletes over time. This prospective approach would yield more precise information compared to retrospective studies, providing valuable insights into the relationships between the number of mTBIs sustained, iron accumulation, recovery trajectories, and long-term outcomes. In lieu of longitudinal research, planned upcoming studies will utilize comparison of individual z-scores relative to healthy population norms to better clarify the prevalence of adverse outcomes following sr-mTBI. This approach will aim to enhance our understanding of the impact of sr-mTBI at the individual level, which may be obscured by group-level analyses (Bedggood et al. 2024; Domínguez et al. 2024).
Conclusions
To better characterize the mechanisms of mild traumatic brain injury at the acute stage, we conducted the first QSM study to assess depth- and curvature-specific regional patterns of positive (iron-related) and negative (myelin-, calcium-, and protein-related) magnetic susceptibility in the cerebral cortex following injury. We observed concurrent instances of increased positive susceptibility with decreased negative susceptibility in discrete voxel populations within the parahippocampal gyrus, indicating a possible accumulation of iron concomitant with myelin changes after injury. This distribution pattern was observed in the superficial depths of the sulcus, suggesting perivascular trauma due to mechanical forces. The pattern appeared distinct from age-related differences in positive and negative susceptibility and was reminiscent of supporting features of tau pathology in CTE, which is known to colocalize with iron. These results support a complex, dual-pathology model of trauma after mild head injury and have implications for understanding microstructural brain tissue damage following mTBI.
Acknowledgments
We extend thanks to Aria Courtney, Amabelle Voice-Powell, and Cassandra McGregor for their contribution to the data collection and Tania Ka’ai for bringing her perspective to cultural considerations in this study. In addition, we thank Axis Sports Concussion Clinics, particularly Dr Stephen Kara, for their assistance with recruiting sr-mTBI participants and personnel at the Centre for Advanced Magnetic Resonance Imaging (CAMRI) for their assistance in collecting MRI data. We also acknowledge Dr Tim Elliot for radiological reporting of all participants and Siemens Healthcare/Siemens Healthineers for the use of a work-in-progress (WIP) sequence for the acquisition of magnitude and phase images.
Author contributions
Christi A. Essex (Conceptualization, Methodology, Project Administration, Validation, Software, Formal Analysis, Investigation, Resources, Data Curation, Writing—Original Draft, Writing—Review & Editing, Visualization), Jenna L. Merenstein (Methodology, Writing—Review & Editing, Visualization), Devon K. Overson (Methodology, Software, Visualization, Validation, Writing—Review & Editing), Trong-Kha Truong (Methodology, Software, Writing—Review & Editing), David J. Madden (Methodology, Software, Writing—Review & Editing), Mayan J. Bedggood (Writing—Review & Editing, Project administration, Investigation), Helen Murray (Writing—Review & Editing), Samantha J. Holdsworth (Writing—Review & Editing), Ashley W. Stewart (Writing—Review & Editing), Catherine Morgan (Writing—Review & Editing), Richard L.M. Faull (Writing—Review & Editing), Patria Hume (Writing—Review & Editing), Alice Theadom (Conceptualization, Methodology, Writing—Review & Editing, Funding acquisition, Supervision), and Mangor Pedersen (Conceptualization, Methodology, Writing—Review & Editing, Funding acquisition, Supervision).
Funding
This work was supported by a grant from the Health Research Council of New Zealand (grant number 21/622).
Conflict of interest statement: None declared.
Data availability
De-identified MRI data and code used for image processing and statistical analysis can be made available upon request to the corresponding author. Parent codes for cortical column generation can be made available upon request from co-authors (J.L.M., T.K.T.) based at the Brain Imaging and Analysis Center at Duke University Medical Center.