


Abstract
While the auditory and visual systems each provide distinct information to our brain, they also work together to process and prioritize input to address ever-changing conditions. Previous studies highlighted the trade-off between auditory change detection and visual selective attention; however, the relationship between them is still unclear. Here, we recorded electroencephalography signals from 106 healthy adults in three experiments. Our findings revealed a positive correlation at the population level between the amplitudes of event-related potential indices associated with auditory change detection (mismatch negativity) and visual selective attention (posterior contralateral N2) when elicited in separate tasks. This correlation persisted even when participants performed a visual task while disregarding simultaneous auditory stimuli. Interestingly, as visual attention demand increased, participants whose posterior contralateral N2 amplitude increased the most exhibited the largest reduction in mismatch negativity, suggesting a within-subject trade-off between the two processes. Taken together, our results suggest an intimate relationship and potential shared mechanism between auditory change detection and visual selective attention. We liken this to a total capacity limit that varies between individuals, which could drive correlated individual differences in auditory change detection and visual selective attention, and also within-subject competition between the two, with task-based modulation of visual attention causing within-participant decrease in auditory change detection sensitivity.
Introduction
Imagine crossing the road in a crowded area. The sidewalks are crowded, many people are talking, and you have to focus on the oncoming vehicles to ensure your safety. Suddenly, the loud honking of a turning vehicle attracts your attention, causing you to stop. Similarly, when you are reading a paper in your room, it may be hard to stay focused on the specific lines of the paper if the sound of loud honking outside grasps your attention. These situations illustrate visual selective attention (i.e. to the oncoming vehicles, the specific lines in the paper) and auditory change detection (i.e. sudden honking) in daily life. In many cases, people have to process large amounts of information from different sensory modalities. To act efficiently, we often selectively deploy our attention to the visual objects most relevant to our current goals. Meanwhile, survival also requires that the auditory system continuously monitor other inputs and detect changes to enable attentional shifts toward unexpected events, which can sometimes save our life but sometimes distract us.
Audition and vision are both important ways for humans to receive external information. In general, vision has a higher spatial resolution than audition, whereas audition has a higher temporal resolution than vision (Talsma et al. 2010). According to the different characteristics of auditory and visual systems, many studies have focused on the neural mechanisms of auditory change detection and visual selective attention separately. While the auditory and visual systems can independently control the processing of information in respective modalities, there are also certain connections between the two modals (Koelewijn et al. 2010; Talsma et al. 2010; Murray et al. 2016). For example, noninformative auditory stimuli can improve visual perception and activate visual cortex in some instances (Van der Burg et al. 2008; McDonald et al. 2013; Feng et al. 2014) but have a distracting effect in others (SanMiguel et al. 2010; Parmentier 2014). These findings emphasize the complicated and interconnected nature of auditory and visual modalities, which is still not fully understood.
Of particular interest is the relationship between auditory change detection and visual selective attention, which has been argued to play an essential role in the evolution of our cognitive system (Parmentier 2014). In event-related potential (ERP) studies, a robust neural marker of auditory change detection is the mismatch negativity (MMN) (Näätänen 1990, 1992). The MMN is elicited when a series of repetitive sounds (standard stimuli) change to an infrequent sound (deviant stimulus). It is isolated by subtracting the ERP waveform for the standard stimuli from those for the deviant stimuli and is usually observed as a frontal-distributed negative peak between 100 and 250 ms after stimulus onset. Because MMN amplitude increases and latency decreases as the discriminability of standard and deviant sounds increases (Näätänen et al. 2007), the MMN is considered to be a valuable neural marker for evaluating auditory discrimination. Although MMN can be elicited for asleep or even comatose individuals without conscious attention (Garrido et al. 2009; Sculthorpe et al. 2009; Fischer et al. 1999), many studies have found that the MMN is modulated by attentional modulation, with changes in MMN amplitude under different conditions of auditory selective attention (Woldorff et al. 1991, 1993, 1998; Näätänen et al. 1993) or different visual attention demands (Kramer et al. 1995; Singhal et al. 2002; Muller-Gass et al. 2005; Yucel et al. 2005; Zhang et al. 2006; Haroush et al. 2010, 2011).
Posterior contralateral N2 (N2pc) is a well-characterized index of visual selective attention (Luck and Hillyard 1994; Eimer 1996; Girelli and Luck 1997; Hickey et al. 2006, 2009). It is a lateralized negative ERP component isolated by subtracting the ipsilateral ERP waveform from the contralateral ERP waveform to the location of visual targets. The N2pc has been generally interpreted as the distribution of attention to the visual target (Brisson et al. 2007; Luck 2014) and is modulated by top-down control of visual attention such as voluntary feature selection (Su et al. 2020). N2pc has also been used as an indicator of the level of visual attention or the degree of inattentive symptoms in cognitive studies (Wang et al. 2016; Guo et al. 2023; Kojouharova et al. 2023).
In the current study, we sought to better understand the relationship between auditory change detection and visual selective attention by exploring the correlation between individual differences in MMN and N2pc. Rather than focusing on audio-visual relationships within subjects (e.g. Van der Burg et al. 2008; McDonald et al. 2013), we asked whether individual differences in auditory change detection and visual selective attention are related at the population level. We predicted that the two abilities share, at least in part, a common underlying mechanism or resource, then individuals with larger MMN that are more sensitive to auditory changes may also be better at allocating visual selective attention and have larger N2pc. However, if this underlying mechanism reflects a finite resource, then increasing the demand for visual attention could reduce an individual’s capacity for auditory change detection (i.e. a trade-off). This again would be reflected in individual differences, with those individuals who allocate more visual attention (when task demands change) tending to have less capacity remaining for auditory change detection. Indeed, we found evidence for both. First, we found that individual differences in the magnitude of MMN and N2pc ERPs were correlated at the population level, while other, concurrently recorded, evoked responses were not. Then, when we manipulated task demand, we found that those individuals who increased their N2pc more were also those who showed the greatest concurrent drop in MMN. The data align with the proposal that the two processes are linked by a shared, limited capacity resource, itself an individual difference between participants, which can be flexibly allocated between visual selective attention and auditory change detection.
Experiment 1
In experiment 1, we investigated whether there was a relationship between neural correlates of auditory change detection and visual selective attention at the population level. To assess this, we characterized and then compared MMN and N2pc responses recorded in separate testing tasks.
Materials and methods
Participants
Previous studies analyzing N2pc and MMN components in adults reported sample sizes ~20 for N2pc (Kiss et al. 2008; Huang et al. 2015) and 10 for MMN (Zhang et al. 2006; Haroush et al. 2010; Haroush et al. 2011). In the three experiments conducted in this study, we included a minimum of 26 participants in each experiment to ensure a robust dataset for analyzing both components with a reliable signal-to-noise ratio.
Thirty healthy undergraduate and graduate students participated in experiment 1. All reported right-handed, normal or corrected-to-normal vision, normal hearing, and no history of neurological disorders. Data from four participants were discarded due to the high ratio of noise in the EEG signals (rejected trials > 50% in any task). Therefore, data from the remaining 26 participants (12 males and 14 females; mean age = 22.5 years, SD = 1.77, range = 19–27 years) were used in the analysis. Written informed consent was obtained from each participant before the experiment. The study was approved by the Beijing Normal University Institutional Review Board.
Stimuli and procedure
Experiments were performed in a dimly lit, noise-attenuated room. In all tasks, participants were instructed to sit ~65 cm from a 21-inch gamma linearized CRT monitor (1920 pixels × 1080 pixels, 60-Hz frame rate). An example of the stimuli used in experiment 1 is presented in Fig. 1. Experiment 1 consisted of three tasks (task 1: auditory-embedded fixation task, task 2: visual localization task, task 3: visual detection task; the trial structure of all tasks is illustrated in Supplementary Fig. S1).

Example stimuli and electrophysiology results from the three tasks of experiment 1. Auditory stimuli were presented in only task 1 (i.e. not in tasks 2 and 3). The visual background color in all the experiments was black. (A) In task 1, the auditory series consisted of 80% standard tones and 20% deviant tones, and frequencies of deviant and standard tones were counterbalanced across participants. Each tone was presented for 200 ms at 600-ms intervals. Participants were instructed to report when the fixation cross turned red (10% of trials, randomly distributed) and ignore the task-irrelevant auditory stimuli. (B) In task 2, the visual search array consisted of one circle (target) and 11 diamonds. The target was randomly located at 2, 4, 8, or 10 o’clock with equal probability. Participants were instructed to report the position of the target (upper or lower visual field) in each trial. (C) In task 3, the gray circle of the visual search array in task 2 turned red in 10% of trials (randomly distributed). Participants were instructed to detect and report the presence of the red circle. (D) The grand averaged event-related potentials at the frontal electrode FCz for standard and deviant tones in task 1 (top). Subtraction of these waveforms provides the MMN in task 1 (bottom). Shading represents standard error. The topographic scalp map shows the distribution of the MMN at peak. (E) The grand averaged event-related potentials at contralateral and ipsilateral electrode sites (59 and 91, near the PO7/PO8 locations in the international 10/10 system) relative to the target in task 2 (top). The N2pc difference waveform (bottom) was obtained by subtracting the ipsilateral waveform from the contralateral waveform. Shading represents standard error. The topographic scalp map shows the distribution of the N2pc at the peak. (F) The grand averaged event-related potentials at contralateral and ipsilateral electrode sites (59 and 91) relative to the gray circle in task 3 (top). Subtraction of these waveforms provides the N2pc difference waveform (bottom). Shading represents standard error. The topographic scalp map shows the distribution of the N2pc at the peak.
The visual stimuli in task 1 consisted of a fixation cross presented on a black screen (RGB intensity values 0, 0, 0; 0.5 cd/m2). The gray fixation cross (RGB intensity values 128, 128, 128; 13.5 cd/m2) turned red (RGB intensity values 237, 28, 36; 13.5 cd/m2) in a random subset (10%) of trials and never changed in two successive trials. Participants were instructed to maintain their gaze on the fixation cross and report when it turned red by pressing key “1” on the keypad with their index finger as quickly and accurately as possible. The interstimulus interval (ISI) was 600 ms. However, passive auditory oddball stimuli were added during the visual detection task (task 1). Auditory stimuli (Fig. 1A) were presented binaurally to participants through headphones for 200 ms (including 10 ms rise and fall times) at 600-ms intervals, synchronized with the presentation of each visual stimulus. The series consisted of 80% standard tones and 20% deviants, with their frequencies counterbalanced across participants between 200 and 800 Hz. Frequency deviants were chosen for their proven reliability in eliciting MMN in previous studies (Näätänen et al. 1993, 2007; Zhang et al. 2006; Cooray et al. 2016). In addition, the order of standard and deviant tones was random, with the restrictions that each deviant was preceded by at least one standard, and an equal proportion of standard and deviant tones was ensured to accompany the gray and red fixation crosses. Participants were instructed to disregard auditory inputs and to concentrate on the visual fixation task. Before the recording, the volume of the auditory stimuli was set to a comfortable level (~70 dB SPL) by each participant. task 1 consisted of ten 100-trial blocks and lasted ~20 min. This task helped ensure that participants’ eyes were open and that they were awake throughout the blocks, but it did not place a high demand on processing resources.
In task 2, a fixed-feature singleton paradigm was used (Wang et al. 2016). A singleton in the visual search literature refers to a unique item that differs from all other items in a display. A total of 12 items (3.4° × 3.4°, 13.5 cd/m2) were presented at a visual angle of 9.2° from the fixation cross on a black background (0.5 cd/m2), generating a circular search array (see Fig. 1B). The twelve items consisted of one filled circle (target) and eleven filled diamonds (distractors). The target was randomly located in either the right visual field (2 or 4 o’clock) or the left visual field (8 or 10 o’clock) with equal probability. Each trial started with a centrally presented fixation cross for 900 to 1100 ms, followed by presentation of the stimulus array for 200 ms and then of a blank screen for up to 2800 ms; during the blank screen, participants indicated their responses. During the intertrial interval, a gray fixation cross was presented at the center of the display. Participants were instructed to maintain their gaze on the fixation cross and report the position of the target (upper or lower) by pressing one of two buttons with his or her right hand as quickly and accurately as possible but to ignore other extraneous items. That is, target responses for the lower visual field were made by pressing the “1” key on the keypad with their index finger; target responses for the upper visual field were made by pressing the “2” key with their middle finger. Task 2 consisted of eight 30-trial blocks and lasted ~20 min.
The stimuli in task 3 (Fig. 1C) were identical to those used in task 2, with the following exceptions: the gray circle of the search array turned red (RGB intensity values 237, 28, 36; 13.5 cd/m2) in a random 10% of trials and remained unchanged in the other 90% of trials. The ISI was shortened to 600 ms. Participants were instructed to maintain their gaze on the fixation cross and to report the presence of the red target circle in the visual search array. That is, the participants needed to press a key (the “1” key on the keypad) with their right index finger as quickly and accurately as possible when the visual search array contained a red circle (10% trials). The participants did not need to respond to the gray circle presented in 90% of the trials. Similar to task 1, the red response-target circle never appeared in two successive trials. Task 3 consisted of five 100-trial blocks and lasted ~10 min.
The order of the tasks with (task 1) and without (tasks 2 and 3) sound was counterbalanced across the participants, and then the order of the two purely visual tasks (tasks 2 and 3) was also counterbalanced.
EEG recordings and analysis
When the participants were performing the tasks, continuous EEG data were acquired from a 128-channel system (HydroCel Geodesic Sensor Net; Electrical Geodesics, Inc., Eugene, OR). Electrode impedances were kept <50 kΩ during data acquisition. All scalp channels were referenced to Cz online during recording. The EEG data were amplified with a bandpass filter (range of 0.01–400 Hz) and digitized online at 1000 Hz.
EEG data were processed using the EEGLAB software package in the MATLAB environment (Delorme and Makeig 2004). Data from the 20 outermost electrodes were excluded from the analysis because signals from the boundary electrodes were heavily susceptible to face and head movements (Fig. S4). This method was also used in recent studies (Debnath et al. 2019; Guo et al. 2019, 2020). Offline, the EEG data were downsampled to 250 Hz and then were algebraically rereferenced to the average of the left and right mastoids. The EEG data were bandpass filtered at 0.5 to 30 Hz using a zero-phase finite impulse response filter. The cutoff frequency was set at 0.25 to 30.25 Hz, corresponding to a reduction in signal power to half at −6 dB. Independent component analysis was performed, and components associated with eye movements were identified and removed based on their spatial, spectral, and temporal properties. EEG segments of 500 ms, including 100-ms prestimulus onsets time-locked to the visual search array (the auditory stimulus for both standard and deviant tones), were extracted to obtain the averaged ERP waveforms. The 100-ms prestimulus period served as the baseline.
Epochs in which the EEG data in any channel exceeded ±100 μV were automatically excluded in all experiments. In addition, eye blinks were detected from the vertical electrooculogram signal (average of Fp1 and Fp2) with a window length of 200 ms, step size of 100 ms, and threshold of 75 μV during a time window from −100 to 300 ms around the visual stimulus. Horizontal gaze shifts were detected from the difference waves between F9 and F10 around the visual stimulus (−50 to 400 ms) with a window length of 100 ms, a step size of 50 ms, and a threshold of 50 μV. Epochs contaminated by incorrect responses, response times shorter than 200 ms, or response times longer than 800 ms were also excluded from the ERP averages. Overall, artifacts led to a rejection rate of 24.09 ± 10.26% (mean ± SD, unless otherwise indicated) of trials in task 1, 11.64 ± 10.02% of trials in task 2, and 20.70 ± 7.79% of trials in task 3.
The auditory MMN component was isolated using the difference wave generated by subtracting the average standard response from the average deviant response. The visual N2pc components were isolated by subtracting the ERP waveforms of the ipsilateral hemisphere in response to the gray circle from the corresponding electrodes of the contralateral hemisphere. The auditory MMN component was computed at a frontal electrode site (FCz), and the visual N2pc component was measured by occipital electrodes (59/91, near the PO7/PO8 locations in the international 10/10 system), where these ERP components showed the largest amplitudes. The locations of the electrodes for ERP analysis were all similar to those in previous ERP studies (Wang et al. 2016; Zhao et al. 2019; Koshiyama et al. 2020; Tang et al. 2021). The 2D topographical maps were constructed based on the average amplitude of ERPs across a 40-ms window centered at the group-averaged peak for each task. For the N2pc topography, we plotted left–right maps that combine a left-target N2pc and an inverted right-target N2pc (Tay et al. 2022b). Specifically, for electrodes in the right hemisphere, the difference corresponds to the left-target N2pc, obtained by subtracting the ipsilateral response from the contralateral response. Similarly, for electrodes in the left hemisphere, the difference corresponds to the inverted right-target N2pc, derived by subtracting the contralateral response from the ipsilateral response. We assessed only the no-response trials in task 3, in which the visual search array was the same as that in task 2 to standardize the visual stimuli that elicited the N2pc across the two tasks. Since the ISI in tasks 1 and 3 was short, we did not analyze the trials after each response to exclude the possible effects of key press on the subsequent trial.
We performed one-sample t tests to examine whether the MMN and N2pc components differed from zero. To avoid circularity, data were averaged over the whole a priori time window when comparing to zero. Time windows for one-sample t tests were selected to capture the MMN (100–250 ms) and N2pc (200–300 ms) amplitudes based on previous research on the MMN and N2pc components (Garrido et al. 2009; Luck 2014; Luck and Hillyard 1994; Näätänen et al. 2007) in all experiments. To allow for individual latency differences, the amplitudes of the MMN and N2pc were calculated as the mean value of a 20-ms window centered at the individual peaks in each task for difference tests and correlation analyses. The individual peak was defined as the most negative value for each participant within a 140-ms window centered at the group-averaged peak of the difference wave. The onset latency was the time at which the difference waveform reached 50% of its individual peak amplitude for each participant. Correlations were investigated using the Spearman ρ because it is less affected by the data distributions or outliers. All statistical tests were two-tailed unless otherwise indicated. We also performed Bayesian analyses and reported the Bayes Factors (BF01 or BFexcl) for all nonsignificant test results to evaluate whether there is evidence for the null hypothesis.
We conducted a series of control analyses to rule out the effects of confounding variables, such as the contribution of individual differences in signal-to-noise ratio and age to the key MMN–N2pc correlations. For this, we calculated the amplitude of a number of other ERP components, and assessed their correlation with the MMN and N2pc. We computed the auditory raw ERP (anterior N1) in task 1, using the same time window from the same electrode (FCz) as the MMN for the standard stimuli, and we computed the visual raw ERPs (occipital N2, P2) in tasks 2 and 3 using the same time window and the same electrodes (59/91) as the N2pc for the contralateral and ipsilateral hemispheres to the circle. In addition, like the MMN component, the auditory P3a component was isolated from the midline central electrode (Cz) in the difference wave generated by subtracting the average standard response from the average deviant response in task 1. In all correlation analyses, the amplitudes of these ERPs were calculated as the mean value of a 20-ms window centered at the individual peaks, and the polarity of the positive components (visual P2, auditory P3a) were flipped to make the correlations comparable. Furthermore, we performed partial correlation analyses between MMN and N2pc with age controlled to rule out the possible effect of age on ERPs (Bottger et al. 2002). We also conducted the correlation analysis between auditory MMN and visual MMN, please see Supplementary Materials (Fig. S8 and Table S2) for details.
Results
Behavioral results
The behavioral results indicated that participants were able to perform all three tasks rapidly and accurately. The mean response accuracy was 99.71 ± 0.44% in task 1, 96.97 ± 2.20% in task 2, and 99.73% ± 0.49% in task 3. The mean reaction time was 398 ± 46 ms in task 1, 503 ± 64 ms in task 2, and 423 ± 55 ms in task 3. The trials with incorrect responses were rejected when averaging the individual RTs.
ERP results
Auditory MMN component
In task 1, the ERP waveforms in response to the auditory standard and deviant tones recorded by electrodes over the frontal cortex (FCz) are shown in Fig. 1D. We observed a classic MMN: a clear negative difference between the potentials recorded for the standard and deviant tones. A one-sample t test showed that the difference wave at FCz was significantly different from zero (t(25) = −6.372, P < 0.001, Cohen’s d = −1.320). The topographic map revealed that the distinct extremum of the MMN was focused on the frontal area.
Visual N2pc component
As shown in Fig. 1E and Fig. 1F, an N2pc component was elicited following the presentation of the visual search array both in the localization task (task 2) and in the detection task (task 3) from electrodes over the visual cortex contralateral and ipsilateral to the circle, revealing the existence of a contralateralized effect of the singleton on brain activity. One-sample t tests showed that the difference wave elicited by gray circles was significantly more negative than zero in both task 2 (t(25) = −8.609, P < 0.001, Cohen’s d = −1.688) and task 3 (t(25) = −5.268, P < 0.001, Cohen’s d = −1.033), confirming the statistical significance of the N2pc in both tasks. Topographic maps of the N2pc peak are also provided, which are qualitatively similar to those observed in prior studies (Luck and Hillyard 1994; Hickey et al. 2009; Sawaki et al. 2012). Paired t tests revealed that the amplitude of the N2pc, as measured around the individual N2pc peaks, was significantly increased in task 2 (visual localization task) compared with task 3 (visual detection task; t(25) = −6.233, P < 0.001, Cohen’s d = −1.222). Moreover, the onset latency of the N2pc was significantly shortened in task 2 (233 ± 11 ms) compared with task 3 (257 ± 22 ms; t(25) = −5.823, P < 0.001, Cohen’s d = −1.142). These results further indicated that the N2pc component reflects attentional deployment to a specific singleton in the visual arrays and that more attentional resources were allocated to the target shape in the localization task (task 2) than in the detection task, even though the visual stimulus was the same between tasks 2 and 3. The difference in N2pc amplitudes between tasks 2 and 3 could stem from the different task-relevance of the eliciting stimulus, or the additional attentional processes for localization beyond those required for feature detection (Hyun et al. 2009). In addition, the stimuli that partially match the target template (Eimer and Grubert 2014) or attentional set (Sawaki and Luck 2013) may have elicited a smaller N2pc in task 3. The differences in motor response requirements between task 2 and task 3 could be considered as a potential factor contributing to the observed differences.
Furthermore, we tested whether the N2pc elicited by the localization task in task 2 was correlated with the N2pc elicited by the detection task in task 3. As expected, a strong positive correlation was found between the two N2pc components in tasks 2 and 3 (ρ(26) = 0.809, P < 0.001; Fig. S5), further suggesting that the N2pc component is a reliable neural correlate of visual selective attention.
Correlation between the auditory MMN and the visual N2pc
To address our main question of whether there is a relationship between individual differences in auditory change detection and visual selective attention at the population level, we performed correlation analysis between auditory MMN amplitudes (task 1) and visual N2pc amplitudes (tasks 2 and 3) across all individuals. The results revealed significant positive correlations between the amplitude of the MMN and N2pc. That is, the N2pc measured in the localization task (task 2) (ρ(26) = 0.451, P = 0.021; Fig. 2A) and the N2pc in the detection task (task 3) (ρ(26) = 0.461, P = 0.018; Fig. 2B) were significantly correlated with the MMN in task 1. These correlations remained significant even after the one outlier (value beyond three standard deviations) was removed (Ps < 0.041). These results suggest that the auditory neural correlate of stimulus change detection in each individual, as reflected by the amplitude of the MMN, was closely related to his or her neural correlate of visual selective attention, as reflected by the amplitude of the N2pc. That is, if an individual exhibited a stronger auditory change detection response, then his or her visual selective attention response would also be stronger.
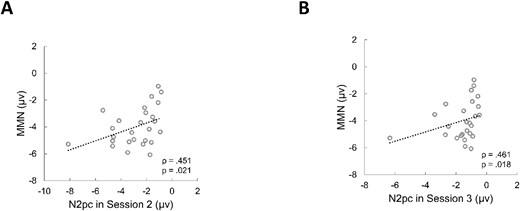
Scatter plot of the correlation between the amplitudes of the auditory MMN and visual N2pc in experiment 1. (A) Correlation between MMN amplitude in task 1 and N2pc amplitude in task 2. (B) Correlation between MMN amplitude in task 1 and N2pc amplitude in task 3.
Control analysis
To check the specificity of the effect and rule out the possibility that the correlations reflected a general property of the recording, we conducted a series of control analyses. First, we checked whether the visual N2pc was correlated with the auditory raw ERP (the anterior N1) evoked by standard tones, and whether the MMN was correlated with the visual raw ERPs (the occipital P2, N2) for both contralateral and ipsilateral hemispheres to the gray circle. Furthermore, we explored correlations between these visual raw ERPs and the auditory raw ERP. None of these 14 correlations were significant (Ps > 0.244, uncorrected, see details in Supplementary Table S1), suggesting that the correlation between the MMN and N2pc was specific. Then we also tested whether the auditory P3a (task 1) was correlated with the visual N2pc in tasks 2 and 3. The correlations were again not significant (task 2: ρ(26) = −0.067, P = 0.744; task 3: ρ(26) = 0.062, P = 0.764). The correlation between MMN and N2pc was significantly larger than that between P3a and N2pc in task 2 (Z = 1.88, P = 0.030, one-tailed), and we also found a similar but marginally significant difference in task 3 (Z = 1.48, P = 0.069, one-tailed).
A further potential source of correlated variance is participant age. For example, Bottger et al. (2002) found significantly larger N170 amplitudes in younger relative to older participants. To alleviate this specific concern, we also performed partial correlation analyses between MMN and N2pc with age controlled. The results still showed that N2pc in task 2 (visual localization task; ρ(26) = 0.460, P = 0.021) and task 3 (visual detection task; ρ(26) = 0.496, P = 0.012) were significantly correlated with the MMN in task 1.
Experiment 2
In experiment 1, when auditory and visual stimuli were presented separately, we demonstrated a close relationship between individual differences in MMN and N2pc. In experiment 2, we sought to replicate and extend this finding to a situation in which auditory and visual stimuli were presented simultaneously, and used a different manipulation of the visual singleton. To that end, participants performed a new visual detection task, while disregarding simultaneously presented auditory stimuli. The dual stimuli could therefore elicit both the visual N2pc and the auditory MMN within the single task.
Materials and methods
Participants
Thirty-two healthy undergraduate and graduate students participated in experiment 2. None of the participants had previously participated in experiment 1. One participant was excluded due to too few trials remaining after artifact rejection (rejected trials > 50%). Data collection for two participants was terminated early due to excessive artifacts. For the remaining 29 participants (15 male and 14 female), ages ranged from 19 to 27 years (mean = 22.1 years, SD = 2.3). All the participants had normal hearing and normal or corrected-to-normal vision and were right-handed. They were unaware of the aims of the study and provided written informed consent for their participation.
Stimuli and procedure
Experiment 2 adopted a visual detection task with an irrelevant stream of auditory stimuli (see the trial design in Fig. S2). The visual stimulus was a search array consisting of a nonhorizontal bar and 11 horizontal bars arranged into a circle with a visual angle of 9.2° from the center of the screen (Fig. 3A). The nonhorizontal bar appeared randomly at 2, 4, 8, or 10 o’clock with equal probability, and the orientations of the corresponding bars at each position were 45°, 135°, 135°, and 45° from the horizontal, respectively. The bars were 2° in length and 0.5° in width. Similar to task 3 of experiment 1, all bars were gray in 90% of trials, while the gray nonhorizontal bar turned yellow (RGB intensity values of 255, 242, 0; 30 cd/m2) in the other 10% of trials. Participants were instructed to maintain their gaze on the central fixation cross and indicate the presence of the yellow target bar in the visual search array by pressing a button with their right index finger. The yellow target bar appeared randomly but never in two successive trials.

Example stimuli and electrophysiology results from experiment 2. (A) The visual search array consisted of a nonhorizontal bar (target) and 11 horizontal bars. The gray bar of the visual search array in task 2 turned yellow in 10% trials, randomly distributed. Each tone of the auditory series was presented for 200 ms and synchronized with each visual search array. Participants were instructed to report the presence of the yellow bar and disregard the task-irrelevant tones. (B) The MMN (top) and N2pc (bottom) difference waves and topographic scalp maps and in experiment 2. Shading represents standard error. Topographic scalp maps show the distribution of the MMN and N2pc at peak. (C) Correlation between MMN amplitude and N2pc amplitude in experiment 2.
The auditory stimuli were the same as those in task 1 of experiment 1, except that the standard tone was 200 Hz and the deviant tone was 800 Hz for all participants. Each tone of the auditory series was presented for 200 ms, which was synchronized with the presentation of each visual search array. Participants were instructed to ignore the auditory stimuli and focus on the visual detection task. The experiment contained ten 100-trial blocks and lasted ~ 20 min.
EEG recordings and analysis
The recording and analysis methods in experiment 2 were identical to those in experiment 1 (see above). Overall, artifacts led to an average rejection rate of 11.60 ± 10.58% of trials in experiment 2. We still included only the no-response trials in the ERP analysis.
Results
Behavioral results
The behavioral results indicated that participants were able to detect the target rapidly and accurately in experiment 2. The mean detection accuracy was 99.72 ± 0.36%, and the mean RT for targets was 448 ± 52 ms. The mean RT was still calculated only for correct trials.
ERP results
Auditory MMN component
Concurrent with the visual task, although the participants were instructed to ignore the auditory stimuli, a clear negative difference between the potentials recorded for the standard and the deviant tones was elicited. The average deviant-minus-standard difference waveform at FCz is shown in Fig. 3B (top), and the topographic map revealed that the MMN was focused in the frontal area. A one-sample t test revealed that the MMN was significantly different from zero (t(28) = −4.684, P < 0.001, Cohen’s d = −0.870). The ERPs elicited by the standard and the deviant tones are shown in Fig. S6.
Visual N2pc component
As shown in Fig. 3B (bottom), following the presentation of the visual search array, an N2pc component was elicited as a negative difference waveform between the contralateral and ipsilateral scalp sites (59 and 91) in response to the nonhorizontal bar in the 90% no-response trials. A one-sample t test showed that the N2pc elicited by gray tilted lines was significant (t(28) = −2.227, P = 0.034, Cohen’s d = −0.414), indicative of attentional allocation to the nonhorizontal bar.
Correlation between the auditory MMN and the visual N2pc
As illustrated in Fig. 3C, the visual N2pc elicited by the gray orientation singleton was again positively correlated with the auditory MMN across participants (ρ(29) = 0.439, P = 0.017). The partial correlation analysis with age controlled also showed a positive correlation between MMN and N2pc (ρ(29) = 0.440, P = 0.019). This result replicates the finding from experiment 1 and extends it to a context in which auditory and visual are presented simultaneously. This finding again suggests that for each individual, auditory change detection, as reflected by the MMN, is closely related to visual selective attention, reflected by the N2pc.
Experiment 3
In experiments 1 and 2, individual differences in the auditory MMN were positively correlated with the visual N2pc across participants, regardless of whether the auditory and visual stimuli were presented separately or simultaneously. This suggests a close relationship between the two, potentially mediated by some general mechanism, which varies between individuals and predicts individual differences in both processes. Next, we asked whether the two processes are causally related, in other words, whether manipulating one of these processes would have an effect on the other. To address this, we again presented the auditory and visual stimuli simultaneously, and now, additionally manipulated visual attention demands by making the target more difficult to detect. We assessed the impact of this manipulation on the correlation between N2pc and MMN across participants, and asked whether those participants who responded to the manipulation by allocating additional visual attention (as indexed by N2pc) would show a concomitant decrease in auditory change detection (as indexed by MMN) indicating a trade-off between the two processes.
Materials and methods
Participants
Forty-four healthy undergraduate and graduate students participated in the experiment, nineteen of whom had previously participated in experiment 1; the interval between the two experiments was >60 days. The remaining 25 participants only participated in experiment 3. All participants reported that they were right-handed, had normal or corrected-to-normal vision, had normal hearing, and had no history of neurological disorders. Two participants were discarded due to excessive EEG artifacts (rejected trials > 50%). Data collection was terminated early for two participants because the data were unusable due to poor task performance. Data from the remaining 40 participants (21 males and 19 females; mean age = 21.5 years, SD = 2.3, range = 18–26 years; 16 participants had previously participated in experiment 1) were used in the analysis.
Stimuli and procedure
The visual detection task was the same as in task 3 of experiment 1, except that it contained two conditions with different visual attention demands (see the trial structure in Fig. S3). Here, we manipulated the visual attention demands by varying the similarity between the visual target and nontargets (Lavie and Cox 1997). For the low visual attention demand condition, the visual stimuli were identical to those in task 3 of experiment 1 (Fig. 4A). That is, the target was a red circle (RGB intensity values 237, 28, 36; 13.5 cd/m2) that differed from the other items in both color and shape and could easily be detected by the participants. For the high visual attention demand condition, the target in the 10% trials was a dark gray circle (RGB intensity values 90, 90, 90; 8.5 cd/m2; see Fig. 4B), with the intention that the participants would have to deploy more attentional resources in the 90% trials to identify targets compared to the low demand condition. Each task presented trials from only one of these conditions, and the order of the two tasks was counterbalanced between participants.
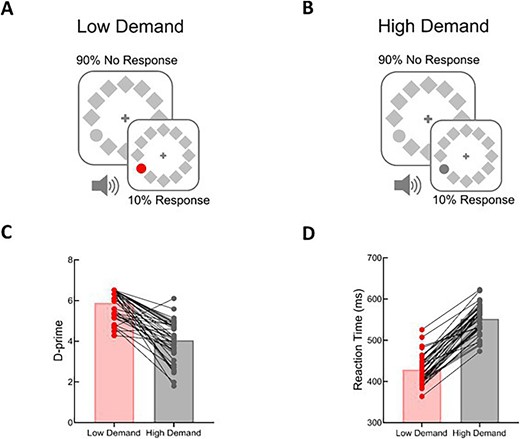
Example stimuli and behavioral results from experiment 3. The visual search task in experiment 3 was the same as in task 3 of experiment 1, except that it contained two visual attention demand conditions. Visual attention demand was manipulated by varying the similarity of the visual target and nontargets. The response-target circle was red in the low demand condition (A) and dark gray in the high demand condition (B). Tones were simultaneously presented with each visual stimulus. Mean values for d-prime (C) and reaction times (D) are plotted for low demand and high demand conditions. Individual data are plotted and connected with lines to illustrate the change in performance for each participant between low and high demand conditions.
The auditory stimuli were the same as those in task 1 of experiment 1, and they were presented simultaneously with visual stimuli. Participants were instructed to focus on the visual detection task and ignore the task-irrelevant auditory tones. Each condition consisted of ten 100-trial blocks; in total, experiment 3 lasted ~40 min.
EEG recordings and analysis
The recording and analysis methods in experiment 3 were identical to those in experiment 1 (see above). In experiment 3, artifacts led to a rejection rate of 19.10 ± 7.18% of trials. The ERP results included only the ERPs elicited by the no-response trials, ensuring that both the auditory stimuli (that elicited the MMN) and the visual stimuli (that elicited the N2pc) were the same under different attention demands, excluding the influence of stimulus-driven factors.
Results
Behavioral results
To compare participant performance in the two conditions, we analyzed d-prime (signal detection theory (Tanner and Swets 1954; Macmillan and Creelman 2004)) and reaction time for correct trials. Paired-sample t tests of the mean d-prime showed that task performance significantly decreased in the high demand condition (5.47 ± 0.43) relative to the low demand condition (4.04 ± 0.96; t(39) = 9.146, P < 0.001, Cohen’s d = 1.446; Fig. 4C). The mean reaction time for targets (low demand: 429 ± 35 ms; high demand: 552 ± 36 ms) also showed a significant effect of attention demand (t(39) = −22.922, P < 0.001, Cohen’s d = −3.624; Fig. 4D).
ERP results
Auditory MMN component
In experiment 3, the same auditory stimuli were presented in two conditions with different visual attention demands. A repeated-measures two-way ANOVA with attention demand (low, high) and sound type (standard, deviant) as factors was conducted on the auditory ERP components. There was a significant main effect of sound type indicating the statistical presence of the MMN component (F(1,39) = 43.323, P < 0.001, η2 = 0.341). There was no significant main effect of attention demand (P = 0.366; BFexcl = 4.333) and no significant interaction between attention demand and sound type (P = 0.813; BFexcl = 4.779), suggesting no significant difference in the amplitude of the MMN between the two conditions at the group level (Fig. 5A). There was also no significant difference in MMN latency (low demand: 163 ± 37 ms; high demand: 166 ± 36 ms; paired-sample t test: t(39) = −0.480, P = 0.635, Cohen’s d = −0.076; BF01 = 5.261) of the MMN between the two conditions. The ERPs elicited by the standard and the deviant tones are shown in Fig. S7.
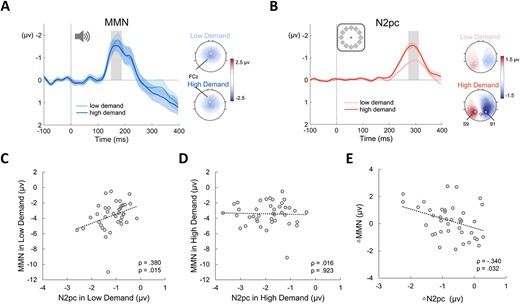
Electrophysiology results from experiment 3. (A) the MMN difference waves and topographic scalp maps for the low demand and high demand conditions. Shading represents standard error. Topographic scalp maps show the distribution of MMN at peak in two conditions (gray bars). (B) N2pc difference waves and topographic scalp maps for the low and high demand conditions. Shading represents standard error. Topographic scalp maps show the distribution of the N2pc at peak in two conditions (gray bars). (C) Correlation between MMN amplitude and N2pc amplitude in the low demand condition. (D) Correlation between MMN amplitude and N2pc amplitude in the high demand condition. (E) Correlation between ∆MMN amplitude (high demand–low demand) and ∆N2pc amplitude (high demand–low demand).
Visual N2pc component
We tested the differences in visual ERP components between the two conditions using a repeated-measures two-way ANOVA with attention demand (low, high) and hemisphere (contralateral, ipsilateral) as factors. A significant main effect of attention demand (F(1,39) = 11.27, P < 0.003, η2 = 0.118) showed a larger visual ERP in the high demand condition, and a significant main effect of hemisphere (F(1,39) = 144.29, P < 0.001, η2 = 0.332) suggested the statistical presence of the N2pc component. A significant interaction between attention demand and hemisphere (F(1,39) = 21.17, P < 0.001, η2 = 0.021) revealed that the amplitude of the N2pc was significantly greater in the high demand condition (Fig. 5B). This indicated that, at the group level, more visual attentional resources were allocated to the gray circle in the high demand condition. This change in the N2pc amplitude occurred even though the responses in the two conditions were elicited by the same visual stimuli and the same response was needed (90% no-response trials). The further simple effect analysis showed that the N2pc component was significant in both conditions (low demand: P < 0.001, Cohen’s d = −2.179; high demand: P < 0.001, Cohen’s d = −2.375). There was no significant difference in N2pc latency between the two conditions (low demand: 260 ± 27 ms; high demand: 256 ± 22 ms; paired-sample t test: t(39) = 1.477, P = 0.148, Cohen’s d = 0.233; BF01 = 2.156).
Correlation between the auditory MMN and the visual N2pc
Next, we asked whether the correlation between individual differences in MMN and N2pc was affected by our manipulation. In the low attention demand condition, the amplitude of the N2pc was significantly and positively correlated with the amplitude of the MMN (ρ(40) = 0.380, P = 0.015; Fig. 5C), consistent with the results of experiments 1 and 2. However, in the high attention demand condition, this correlation was no longer significant (ρ(40) = 0.016, P = 0.923; BF01 = 4.969; Fig. 5D). The correlation coefficient in the low demand condition was significantly larger than that in the high demand condition (Z = 1.65, P = 0.049, one-tailed).
Finally, we conducted a correlation between the difference in amplitude (high demand–low demand) for the MMN and N2pc components. Interestingly, when the visual attention demand changed from low to high, participants with greater gains in visual N2pc amplitude tended to exhibit the largest decreases in auditory MMN amplitude (ρ(40) = −0.340, P = 0.032; Fig. 5E). This negative correlation remained significant when controlling for both the N2pc and the MMN in the low demand condition (ρ(40) = −0.418, P = 0.009). This pattern suggests a trade-off between the auditory MMN and visual N2pc at the individual-participant level as the visual attention demand changed from low to high.
Discussion
In the current study, we recorded EEG data from human adults in three experiments to examine the relationship between auditory change detection and visual selective attention. We first demonstrated that regardless of whether the auditory and visual stimuli were presented simultaneously or separately, whether the visual target was defined by singletons in shape or orientation, and whether the visual task involved localization or detection, the magnitude of the visual-singleton-elicited N2pc was always positively correlated with the magnitude of the auditory-deviant-elicited MMN across participants: participants with larger N2pcs also had larger MMNs. This was resistant to explanations based on individual differences in age, and was specific to these, and not other concurrently recorded, ERPs. It suggests a close relationship between individual differences in auditory change detection and visual selective attention at the population level, indicating a potential common underlying mechanism between them. More interestingly, when we manipulated the demands of the visual task, we observed that the extent to which the magnitude of an individual’s N2pc was increased predicted the extent to which that individual’s MMN would decrease concomitantly. These findings reveal a close and intricate connection between auditory change detection and visual selective attention.
The process of change detection reflected by the MMN is known to take place in the auditory cortex, with contributions from frontal regions (Näätänen and Alho 1995; Opitz et al. 2002; Molholm et al. 2005; Näätänen et al. 2007). The frontal cortices play an important role in selective attention and orienting (Knight et al. 1981; Chao and Knight 1995), which is why the MMN is thought to reflect an “attention switch” toward deviant sounds (Giard et al. 1990; Näätänen and Alho 1995). In addition, the top-down modulation of visual processing is widely thought to be mediated by frontal-to-visual cortex projections (Desimone and Duncan 1995; Kastner and Ungerleider 2000; Miller and Cohen 2001; Knudsen 2007; Petersen and Posner 2012; Maunsell 2015; Moore and Zirnsak 2017; Hu et al. 2019; Jackson et al. 2021; Goddard et al. 2022). The N2pc is often considered a signature of the signals received by the frontal eye field (FEF) (Heitz et al. 2010) because it is generated in the parietal and occipitotemporal cortices (Hopf et al. 2000, 2004), which are reciprocally connected with the FEF (Schall et al. 1995; Pouget et al. 2009). For example, previous single-cell studies have demonstrated that the N2pc component is generated through top-down input from the frontal cortex that modulates processing in extrastriatal regions (Cohen et al. 2009; Cosman et al. 2018). Therefore, a close relationship between the MMN and N2pc seems reasonable because they might have overlapping top-down neural substrates. On the other hand, many studies have suggested that the MMN reflects sensory memory representation (Näätänen 1992; Ritter et al. 1995; Sussman 2007; Fitzgerald and Todd 2020), which can be modulated by attention (Botta et al. 2019; Xie et al. 2021); thus, another possibility is that sensory memory serves as a bridge between the MMN and N2pc, contributing to their close relationship.
While many studies have shown no difference in MMN amplitude between ignored and attended tones (Näätänen et al. 1993; Paavilainen et al. 1993; Alho et al. 1994; Sussman et al. 2004), an equally strong body of literature has reported that the performance on auditory change detection tasks is improved with focused attention to auditory tasks, reflected by increases in MMN amplitude with the level of conscious attention to the deviant sound (Woldorff et al. 1991, 1993, 1998; Trejo et al. 1995; Alain and Woods 1997; Szymanski et al. 1999; Haenschel et al. 2005). Sussman (2007) attempted to reconcile these contrasting findings by explaining that attentional focus guides the formation of the standard stimuli. However, when the attended stimuli and irrelevant stimuli are both presented within the auditory modality, it is difficult to firmly rule out accounts based on low-level stimulus competition (Sussman et al. 2003). Thus, other studies have focused on the change in the MMN to explore attentional shifts with a cross-modal design, which negates the potential confounds of stimulus interference; however, these studies reported conflicting results (for a review of cross-modal attention effects, see Haroush et al. 2010). Some studies have found that visual attention demand has no effect on irrelevant changes in auditory stimuli (Kathmann et al. 1999; Harmony et al. 2000; Otten et al. 2000; Muller-Gass et al. 2006; Chait et al. 2012; Dyson et al. 2005; Wiens et al. 2016). In contrast, others have demonstrated that the MMN increases or decreases when more visual attention resources are needed (Kramer et al. 1995; Singhal et al. 2002; Restuccia et al. 2005; Yucel et al. 2005; Zhang et al. 2006; Haroush et al. 2010). Here, we used a novel design facilitated examination of both the MMN and N2pc, where the timing of the auditory and visual stimuli are precisely matched to maximize the potential competition for attentional resources (Molloy et al. 2015, 2019). In experiment 3, the group-level MMN amplitude did not change with visual attention demand, despite the significant change in group-level N2pc. However, we found that participants whose N2pc amplitude increased the most exhibited the largest reduction in the auditory MMN. We suggest that this phenomenon could reflect a within-subject trade-off between the auditory and visual processes, for example, tracking the differential distribution of attention between the two modalities that draw on an (individually varying) limited resource. Individuals that responded to the change in demand by allocating additionally attentional resources into visual processing, which in turn competes on a cross-modal basis with auditory processing, were therefore left with fewer resources available for auditory change detection (Lavie 2005, 2010; Haroush et al. 2010; Lavie et al. 2014). In contrast, individuals that fail to allocate more shared attentional resources (or did not need to) show no change or even a slight increase in auditory change detection (Lavie 2005; Zhang et al. 2006). This finding provides an avenue to resolve the conflicting group-level results reported in the literature which did not consider individual differences. It also provides a way to reconcile the finding that N2pc and MMN are correlated across participants when demands are low (reflecting individual differences in a shared mechanism) while also allowing for a trade-off between the two, at the individual and group level (because the share mechanism has a total capacity limit).
Some people propose that the N2pc elicited in visual detection task might be epiphenomenal or automatic because simple visual features can be detected at the preattentive stage of processing (Treisman and Gelade 1980; Treisman 1985). However, Joseph et al. (1997) argued that attention is indispensable to process any kind of stimulus, and visual detection is impaired immediately after another attentionally demanding task was performed. Although a previous study found the absence of N2pc in a visual singleton-detection experiment (Luck and Ford 1998), indeed, the results can also be understood through Lavie’s perceptual load theory (Lavie 2005), indicating that individuals do not deploy attention to the lateral singleton because excess perceptual resources are available (Theeuwes et al. 2008). Growing evidence indicates that attentional selection is required for visual detection (Wolfe 1994; Nothdurft 1999; Theeuwes et al. 2006; Theeuwes et al. 2008) and target singletons do elicit the N2pc in visual detection task (Schubo et al. 2004; Mazza et al. 2009; Tay et al. 2019; Tay et al. 2022a; Tay et al. 2022b). The presence of N2pc in such detection tasks does not indicate definitively that attentional selection is necessary for detection, but it does demonstrate that attentional selection occurs most of the time when there is no effort to prevent such selection (Tay et al. 2022b). In addition, the N2pc in our tasks was modulated by task instructions even when the visual stimuli were the same. This finding is consistent with the previous studies (e.g. Eimer et al. 2009; Kiss et al. 2008), suggesting that the N2pc is primarily mediated by top-down task set, with only a minimal role for salience. In summary, although participants can complete a visual detection task equally well with or without evidence of an N2pc (Luck and Ford 1998), although the N2pc can be triggered in response to salient distractors in a bottom-up manner (Hickey et al. 2006; Zhao et al. 2023), the significant N2pc in our visual detection tasks still reflects the functional process of attentional selection (Tay and McDonald 2022), which is modulated by top-down control.
There is still much to be done to fully elucidate the relationship between the auditory MMN and visual N2pc. The current study only focused on the MMN elicited with frequency deviants and the N2pc elicited with salient singletons; future investigations should include MMN elicited with diverse deviants and N2pc elicited with different stimuli (e.g. less salient targets or various nontargets) to provide a comprehensive understanding. Participants in our study performed a visual search task and disregarded the simultaneous presentation of auditory stimuli. To obtain a more comprehensive understanding of the relationship between the auditory MMN and visual N2pc, upcoming work should examine this relationship when people focus on an auditory task and disregard simultaneously presented visual stimuli. Moreover, we are currently collecting EEG data from children to characterize how and when this relationship develops over time.
Author contributions
Yuanjun Kong (Writing—original draft, Conceptualization, Methodology, Formal analysis, Visualization, Investigation), Chenguang Zhao (Methodology, Visualization, Software, Investigation), Dongwei Li (Methodology, Investigation), Bingkun Li (Software, Investigation), Yiqing Hu (Investigation), Hongyu Liu (Investigation), Alexandra Woolgar (Conceptualization, Writing—review & editing), Jialiang Guo (Methodology, Conceptualization, Formal analysis, Investigation), and Yan Song (Writing—review & editing, Conceptualization, Resources, Funding acquisition, Supervision).
Funding
The present research was supported by the National Natural Science Foundation of China (No. 32271094, No. 82371549, and No. 32200870), and the Fundamental Research Funds for the Central Universities (00900-310400209541). A.W. was supported by Medical Research Council (UK) intramural funding (SUAG/093/G116768). For the purpose of open access, this author has applied a Creative Commons Attribution (CC BY) license to any Author Accepted Manuscript arising from this submission version.
Conflict of interest statement: None declared.
Data availability
Anonymized data that support the findings of this study are available from the authors upon reasonable request.