


Abstract
Numerous studies have been devoted to neural mechanisms of a variety of linguistic tasks (e.g. speech comprehension and production). To date, however, whether and how the neural patterns underlying different linguistic tasks are similar or differ remains elusive. In this study, we compared the neural patterns underlying 3 linguistic tasks mainly concerning speech comprehension and production. To address this, multivariate regression approaches with lesion/disconnection symptom mapping were applied to data from 216 stroke patients with damage to the left hemisphere. The results showed that lesion/disconnection patterns could predict both poststroke scores of speech comprehension and production tasks; these patterns exhibited shared regions on the temporal pole of the left hemisphere as well as unique regions contributing to the prediction for each domain. Lower scores in speech comprehension tasks were associated with lesions/abnormalities in the superior temporal gyrus and middle temporal gyrus, while lower scores in speech production tasks were associated with lesions/abnormalities in the left inferior parietal lobe and frontal lobe. These results suggested an important role of the ventral and dorsal stream pathways in speech comprehension and production (i.e. supporting the dual stream model) and highlighted the applicability of the novel multivariate disconnectome-based symptom mapping in cognitive neuroscience research.
Introduction
Language includes a variety of linguistic processes. Speech comprehension and production are 2 fundamental components of human language processes that play a crucial role in interpersonal communication (Levelt et al. 1999; Crinion et al. 2003; Tremblay et al. 2003; Hickok 2012; Geranmayeh et al. 2016; Gajardo-Vidal et al. 2018; Dargue et al. 2019; Pylkkänen 2019; Matchin and Wood 2020). Speech comprehension comprises a number of analyses of speech inputs, including the processes of acoustically analyzing auditory inputs, recognition of speech sounds (phonemes), and access to the semantic system (Frackowiak et al. 2004). Speech production is the process of generating spoken language output, including the representation of concepts to be articulated, lexical retrieval, sound combination and sequencing, and articulatory planning and execution processes (Levelt et al. 1999; Riès et al. 2017).
The neural mechanisms underlying linguistic tasks of speech comprehension and production have been largely considered distinct from one another. Evidence has shown that brain regions essential for spoken word comprehension are located in the left inferior temporal and posterior inferior parietal cortices, whereas spoken word production is primarily associated with the left posterior basal temporal lobe and frontal operculum (Price 1998). There also existed core differences (Matchin and Hickok 2020; Matchin and Wood 2020; Matchin et al. 2022a; Arvidsson et al. 2023) and asymmetries (Giglio et al. 2022) in brain regions between spoken sentence comprehension and production. Lesion correlates of impaired sentence comprehension also differed from those associated with agrammatism and/or paragrammatism (Matchin et al. 2020, 2023; Lorca et al. 2023). On the other hand, a number of investigations suggested that sentence comprehension and production share extensive common networks of brain regions distributed over the left temporal and frontal cortex (Papathanassiou et al. 2000; Awad et al. 2007; Segaert et al. 2012, 2013; Fedorenko et al. 2020; Morales et al. 2022; Hu et al. 2023). A few studies also reported that the sentence comprehension and production processes are interrelated and that there are both distinct and common regions involved (Menenti et al. 2011; Lukic et al. 2021).
Within speech comprehension, whether and how word and sentence comprehension differ is uncertain. By studying primary progressive aphasia patients, Mesulam et al. (2015, 2019) found that the hub brain regions responsible for word and sentence comprehension were distinct and that these regions are located in the left temporal and frontal lobes, respectively. In contrast, a recent study (Matchin et al. 2022b) reported that the classic Wernicke’s area (i.e. the middle superior temporal gyrus and middle-posterior superior temporal sulcus) and temporal pole are involved in both word and sentence comprehension.
Notably, previous human neuroimaging studies on different linguistic tasks concerning speech comprehension and production used either voxel-based lesion-symptom mapping with focal anatomical lesion data from patients (Matchin and Wood 2020; Matchin et al. 2020, 2023; Lukic et al. 2021; Matchin et al. 2022b) or task-based functional neuroimaging data from healthy subjects (Papathanassiou et al. 2000; Menenti et al. 2011; Segaert et al. 2012, 2013; Silbert et al. 2014; Matchin and Wood 2020; Giglio et al. 2022; Hu et al. 2023). Recently, a new method has been developed to measure whole-brain functional or structural abnormalities for brain-damaged patients; the method, referred to as disconnectome symptom mapping, uses normative connectivity data together with patients’ lesion maps to estimate functional or structural disconnection maps (Boes et al. 2015; Salvalaggio et al. 2020; Billot et al. 2022). This novel approach can provide new insights into neural mechanisms underlying different linguistic tasks of speech comprehension and production from a disconnection perspective, but such an investigation has not yet been undertaken.
In this study, a publicly available post-stroke linguistic dataset containing 216 patients with left hemisphere stroke (Matchin et al. 2022a, 2022b; Matchin et al. 2023) and a publicly available normative connectivity dataset (Human Connectome Project, HCP) (Van Essen et al. 2013) was used. The lesion/disconnectome symptom mapping approaches were applied to 3 linguistic tasks mainly concerning speech comprehension and production. Specifically, we investigated whether lesion maps, functional disconnectome maps, and structural disconnectome (SDC) maps can independently predict spoken word/sentence comprehension task score and picture naming task score, and how these maps differ in the prediction performance. Next, we examined the similarities and differences of the significantly contributing networks for the above predictions.
Materials and methods
Subjects and measures
A publicly available post-stroke linguistic dataset was used in this study, which was collected by Matchin et al. (2022a, 2022b, 2023) at the University of South Carolina. In this dataset, all participants were native American English speakers and had at least one ischemic stroke to the left hemisphere at least 6 months before study inclusion. All participants provided informed consent to participate in this study, which was approved by the Institutional Review Boards at the University of South Carolina and the Medical University of South Carolina. Two subjects were excluded because of the right hemisphere lesions, and finally 216 subjects were included in our current analysis (mean age 60.31 yr with a range of 29.32–81.74 yr; 85 females).
For each included patient, several neuropsychological tests were applied. Specifically, spoken word comprehension was assessed using the WAB-R Spoken Word Recognition subset of the WAB-R (Kertesz and Raven 2007), which required the participant to point to real-world objects or printed images. Spoken sentence comprehension was measured with either the Northwestern Assessment of Verbs and Sentences (NAVS) (Cho-Reyes and Thompson 2012) or the Icelandic Task (Magnusdottir et al. 2013), which involved testing the comprehension of a variety of noncanonical sentence types. Spoken word production was assessed using the Philadelphia Naming Test (PNT) (Roach et al. 1996), which is a 175-item picture naming assessment that involves the presentation of numerous simple line drawings. In addition, the pyramid and palm trees test (PPT) (Howard and Patterson 1992) was applied to provide a control for object recognition and nonverbal semantic processing effects on spoken word comprehension (Mesulam et al. 2015; Matchin et al. 2022b), and on spoken sentence comprehension. For a more detailed description of these tasks and score quantification, please see Matchin et al. (2022b). Since some participants completed only part of all neuropsychological tasks, the total number of subjects was not the same between these tasks.
MRI dataset and post-processing
The shared poststroke linguistic dataset also includes high-resolution T1 and T2 images of the stroke patients, which were collected at the University of South Carolina and the Medical University of South Carolina on a 3 T Siemens Trio scanner with a 12-element head coil (Bonilha et al. 2017; Fridriksson et al. 2018; Ouden et al. 2019; Matchin et al. 2022a, 2022b, 2023). Notably, stroke lesions of each patient have been manually delineated on the native-space T2 image by well-trained neurologists, and then further warped to the standard Montreal Neurological Institute (MNI) space using SPM12 (Ashburner and Friston 2005). The warped lesion probability map in the MNI space was then binalized using a threshold of 50% (Matchin et al. 2022b).
All our analyses were at the atlas-derived regional level. Specifically, a gray matter-masked Gordon atlas (Gordon et al. 2016) was applied to each individual’s lesion map, where the gray matter mask was generated from an HCP group-averaged gray matter probability map by applying a threshold of 0.2, as in the previous study (Liang et al. 2021). The lesion map was computed as the proportion of damaged voxels per Gordon atlas-derived region. In both lesion and disconnectome-based analyses, cerebellar and subcortical regions were excluded.
Positive functional disconnectome map
A positive functional disconnectome (PosFDC) map was estimated for each lesion. Specifically, for each subject in the HCP dataset (Glasser et al. 2013; Peng et al. 2022), we calculated Pearson’s correlation coefficient between the average BOLD time course of all gray matter voxels within the lesion mask and the one from each of the 333 Gordon atlas-derived regions. The resulting functional connectivity vectors were then averaged across all healthy HCP subjects (n = 1035). Given that negative functional connectivity might reflect false connections induced by global signal regression (Fox et al. 2009; Murphy et al. 2009; Weissenbacher et al. 2009), we excluded the negative functional connectivity within the vector by setting the negative values to zero. In the resulting PosFDC map, the value in each region indicated an average correlation strength ranging from 0 to 1 between the BOLD time course of the lesion mask and Gordon atlas-based regions.
SDC matrix
We calculated the pairwise regional SDC using the Lesion Quantification Toolkit (LQT) which uses a large-scale normative connectome atlas in combination with novel algorithms for estimating lesion-induced SDC (Griffis et al. 2021). By embedding the lesion into the full set of streamlines in the Human Connectome Project-842 (HCP-842) atlas (Yeh et al. 2018), LQT outputs a pairwise regional structural disconnection matrix. Each cell in the matrix encodes the percent of streamlines that terminate within a pair of the masked 333 Gordon atlas-derived parcels.
Lesion, PosFDC, and SDC symptom mapping
We performed lesion/disconnectome-symptom mapping with ridge regression and then quantified the common and distinct patterns of contributing brain areas between spoken word and sentence comprehension and between spoken word comprehension and production.
For each type of feature (lesion map, PosFDC map, or SDC matrix), a 10-fold cross-validation ridge regression model (see Fig. 1 for illustration) was built to predict each of the 3 linguistic test scores (i.e. spoken word comprehension, spoken sentence comprehension, and spoken word production) in Python using the scikit-learn library (http://scikit-learn.org/) (Pedregosa et al. 2011). Lesion volume was included as a covariate and was regressed from all behavior measures before performing the ridge regression. For word and sentence comprehension scores, the PPT score was also regressed to control for object recognition and nonverbal semantic processing, as did previously (Mesulam et al. 2015; Matchin et al. 2022b).
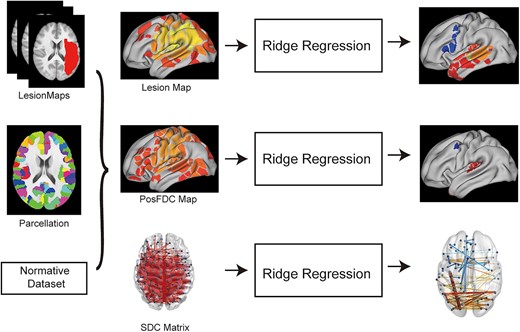
Schematic flowchart of the analysis. Individual atlas-based lesion maps, PosFDC maps, and SDC matrices were used as dependent variables for predicting linguistic task scores using ridge regression with 10-fold cross-validation. The output of interest from the ridge regression was a vector or matrix of the significant weights.
Ridge regression is a linear regression technique that prevents overfitting by adding a regularization term, and the algorithm is as follows (Lecessie and Vanhouwelingen 1992):
The penalty term, λ, regularizes the coefficients; if the coefficients are high, the optimization function is penalized. The coefficient vector, ω, contains the weights that describe the relative importance of each feature in X for the prediction of Y. In each loop, the training set predictors were normalized to the range of [0,1], and the transform was fit to the test set. The regularization coefficient, λ, was optimized by identifying a value between 10−5 and 106 (in logarithmic steps) that minimized the inner 10-fold cross-validation prediction error over the training set. Optimal weights across the entire training set using gradient descent were calculated by varying lambda such that they minimized the error for the ridge regression equation. These model weights were then applied to the remaining patients to predict the language test scores. To robustly quantify the prediction performance, we re-folded the samples randomly 100 times, each time repeating the above procedure, as typically done in previous studies (Gao et al. 2019; Yoo et al. 2019; Cropley et al. 2021).
For the 10-fold cross-validation analyses, we evaluated model performance with Pearson’s coefficient (r) between the observed and predicted scores and reported the mean r value for the 100 times re-folding. To assess the significance of the mean r, we used nonparametric permutation methods (Golland and Fischl 2003); specifically, we randomly shuffled the correspondence between behavioral variables and brain measures 1000 times and reran the ridge regression analysis with the shuffled data to generate a null distribution of r. Based on these null distributions, the p value for the predictions was calculated as p = (#{rnull > rmean} + 1)/1001, where #{rnull > rmean} indicates the number of permutated predictions numerically greater than the mean of the nonpermutated predictions. As we expected a positive correlation between predicted and actual values, the one-tailed p was reported. For the same language test, we conducted a direction comparison of the prediction performance between the 3 types of features/models (i.e. LesionMap vs PosFDC vs SDC): the residual sum of squares between real and predicted scores were compared using the Wilcoxon signed rank test (a nonparametric test for paired data) (Salvalaggio et al. 2020; Cohen et al. 2021). The Z score and p value after Bonferroni correction for multiple comparisons are reported for each pair of compared features/models.
Finally, the feature weights across all 100 times re-folding were averaged to yield a single set of consensus weights. The statistical reliability of each consensus weight was assessed by comparing the real model weight values to a null distribution, which was derived from the maximum absolute weight value of each null model (Nichols and Holmes 2002; Cule et al. 2011). P < 0.05 was set as the significance level. Linear normalization [range (−1,1)] was applied to the weight maps for better visualization (Salvalaggio et al. 2020).
Common and distinct contributing brain areas
We first calculated the overlap of the corrected weight maps of predicting the scores of spoken word and sentence comprehension tests, with positive and negative weights separately. Similarly, the overlap of the corrected weight of predicting the scores of the spoken word comprehension and production tests was calculated. In addition, to quantify the similarities and differences between these linguistic tasks, we computed the percentage of shared regions/edges as the number of shared regions divided by the total number of regions with significant contributions in both tasks. Given the word-sentence level difference between the spoken sentence comprehension and word production tests, we did not compare their contributing areas.
Finally, to evaluate the robustness of our results, we repeated all of the aforementioned analyses using the Schaefer-400 atlas (Schaefer et al. 2018).
Results
Demographic data and lesion distribution
The demographics and language test scores of all included participants from the dataset are shown in Table 1. There were 216, 129, and 160 subjects who completed the spoken word comprehension, spoken sentence comprehension, and spoken word production tasks, respectively. Only 179 subjects completed the PNT task. Therefore, our analyses include only 179 and 107 subjects with spoken word comprehension and spoken sentence comprehension scores, respectively, after regressing the PNT score. Since analyses were performed separately for each language test score, the demographic data are reported for each score. The stroke lesion overlap map across all 216 participants is shown in Fig. 2. The maximum number of participants who had a lesion in a particular voxel was 146 (MNI coordinates: −38, −9, 25, the anatomy of peak: the left superior longitudinal fasciculus).
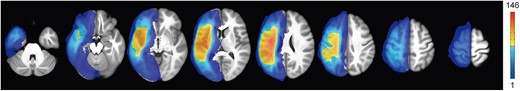
Lesion overlap map for 216 included patients in this study. The map showed regions with no overlap to maximum overlap (n = 146 participants).
Subject demographic data.
| Linguistic tests | WAB-R Spoken Word Recognition (spoken word comprehension) | Northwestern Assessment of Verbs and Sentences (NAVS) or the Icelandic Task (spoken sentence comprehension) | Philadelphia Naming Test (spoken word production) |
|---|---|---|---|
| Total number of subjects | n = 216 (179 included in the analysis) | n = 129 (107 included in the analysis; Icelandic Task: n = 26; NAVS: n = 81) | n = 160 (160 included in the analysis) |
| Sex | 110 male, 69 female | 69 male, 38 female | 96 male, 64 female |
| Mean age at testing (yr) | 60.49 ± 11.38 | 59.79 ± 10.60 | 59.77 ± 11.08 |
| Mean months post-first stroke at initial testing | 41.51 ± 47.83 | 44.08 ± 50.18 | 42.19 ± 47.96 |
| Mean number of strokes | 1.17 ± 0.48 | 1.18 ± 0.49 | 1.15 ± 0.48 |
| Mean education(yr) | 15.00 ± 2.29 | 15.47 ± 2.31 | 14.98 ± 2.25 |
| Mean lesion volume(mm3) | 128566.12 ± 97,170 | 121092.81 ± 90,330 | 126322.78 ± 95,033 |
| Mean Score | 50.09 ± 12.64 | 9.60 ± 3.57 | 89.87 ± 62.15 |
Multivariate ridge regression
Given the similar results based on the Gordon and Schaefer-400 atlases, only the results obtained using Gordon’s atlas are presented in the main text; the results obtained using the Schaefer-400 atlas are available in the Supplementary Materials.
As shown in Fig. 3, the regression models using the lesion maps, PosFDC, or SDC could predict all the 3 language test scores: spoken word comprehension (lesion map: r = 0.32, P = 0.001; PosFDC map: r = 0.35, P = 0.001; SDC matrix: r = 0.23, P = 0.002), spoken sentence comprehension (lesion map: r = 0.32, P = 0.005; PosFDC map: r = 0.36, P = 0.002; SDC matrix: r = 0.36, P = 0.001), and spoken word production (lesion map: r = 0.64, P = 0.001; PosFDC map: r = 0.62, P = 0.001; SDC matrix: r = 0.65, P = 0.001). Overall, the prediction performance for the spoken word production score is much better than the other 2 comprehension test scores. For each type of language test score, the models with the 3 different types of features also showed significant differences in prediction performance (according to the Wilcoxon signed rank test): (i) both posFDC-based and lesion-based models predicted the spoken word comprehension score better than the SDC-based model, and posFDC-based model performed better than the lesion-based model; (ii) both posFDC-based and SDC-based models predicted the spoken sentence comprehension score better than the lesion-based model; (iii) both lesion-based and SDC-based models predicted the spoken word production better than the FDC-based model.
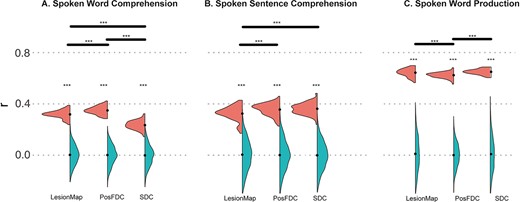
Comparison between different models using the Gordon atlas. A) Spoken word comprehension. B) Spoken sentence comprehension. C) Spoken word production. The violin plots show the distribution of correlation coefficients between observed and predicted scores (left: real distribution of 100 times re-folding; right: null distribution from permutation). Asterisks are shown to indicate that the Pearson correlation coefficients are significantly greater than by chance (null distribution), the mean values are indicated by black-filled circles. Violin plots are shown for each predictive model—lesionMap, PostFDC map, and SDC matrix. For each language test, significant differences in prediction performance between the 3 models are indicated on the top (*P < 0.05; **P < 0.01; ***P < 0.001).
Significantly contributing regions of the lesion-based prediction model
Figure 4A showed the significantly predictive lesion regions for each score. The negative weighting regions for the spoken word comprehension were distributed throughout the middle and superior left temporal gyrus and extended to the left temporal pole. The positive weighting regions were mainly located in the left hemisphere’s precentral gyrus and inferior frontal gyrus. The negative weighting regions for the spoken sentence comprehension were similar to those for spoken word comprehension and were also located in the left middle and superior temporal gyrus. The positive weighting regions for spoken sentence comprehension were mainly located in the middle of the frontal gyrus. The negative weighting regions for spoken word production were around the left parietal lobe, parietal–temporal lobe, precentral sulcus, and inferior frontal gyrus. Based on lesion maps, there was no positive weighting region for the spoken word production.
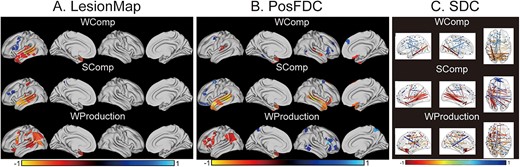
Significantly contributing features derived from the prediction models. Panel (A) LesionMap. (B) PosFDC map. (C) SDC matrix. All regions and edges shown in color survived a significance threshold of P < 0.05, permutation-based FWE-corrected. Negative weighting represents regions and edges predicting more severe deficits, while positive weighting represents regions and edges predicting fewer deficits.WComp = spoken word comprehension; SComp = spoken sentence comprehension; WProduction = spoken word production.
Significantly contributing regions of the PosFDC-based prediction model
Figure 4B shows the locations of brain regions that significantly contributed to predicting each of the language task scores. When predicting the spoken word comprehension score, negative weighting regions were identified around the posterior of the left superior temporal gyrus (commonly referred to as Wernicke’s area) and bilateral temporal poles; positive weighting regions were found around the posterior of the bilateral middle frontal gyrus and the anterior of the right inferior frontal gyrus. When predicting spoken sentence comprehension scores, the negative weighting regions covered extensive portions of the bilateral middle and superior temporal gyrus, along with the temporal poles; the positive weighting regions were mainly located in the posterior left superior frontal gyrus, anterior middle frontal gyrus, and olfactory bulb. In contrast, the negative weighting regions for predicting speech production scores were distributed across the left supramarginal gyrus, inferior parietal lobe, inferior frontal gyrus, middle frontal gyrus, and temporal pole; the positive weighting regions were distributed across the right inferior frontal gyrus, middle frontal gyrus, posterior inferior temporal gyrus, and inferior parietal lobule.
Significantly contributing regions of the SDC-based prediction model
The significantly contributing SDC edges/connections are shown in Fig. 4C. Regarding spoken word comprehension, the negative edges were located between the left temporal and parietal lobes, as well as near several homologous regions between the 2 hemispheres. The corresponding positive edges were found between the temporal and frontal lobes within the left hemisphere. For spoken sentence comprehension, the distribution of the negative edges was similar to that for spoken word comprehension. However, it contained more structural disconnections between the left temporal and parietal lobes and between the left and right temporal lobes, and the positive edges were mainly between the left and right hemispheres, particularly between the frontal lobes. For speech production, the negative edges were found to be widely distributed within the left hemisphere and between the left and right hemispheres. However, there were only a few positive edges, and they were located between the left temporal lobe and the superior frontal gyrus.
Overlap of significantly contributing regions between linguistic tasks
Figure 5A shows the overlap of brain regions that were both negatively associated with the 2 comprehension tasks. The lesion-based model revealed that the left superior and middle temporal gyrus (marked in yellow) were associated with both word and sentence comprehension. According to the PosFDC-based model, although the 2 weight maps did not fully overlap, they were both located in the bilateral superior and middle temporal gyrus. This pattern was akin to that observed in the SDC-based model: the edges with a significant negative correlation were mainly between the left temporal lobe and occipital lobe, as well as between the left temporal lobe and right hemisphere.
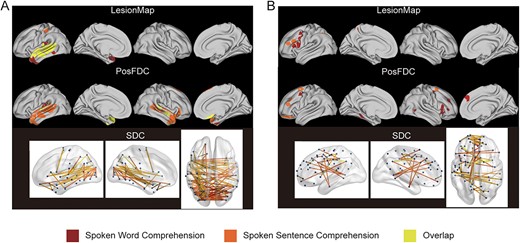
Overlap of significantly contributing regions between spoken word and sentence comprehension. (A) Overlap of negative correlations. (B) Overlap of positive correlations. The deep red color represents a significant correlation solely with spoken word comprehension, orange indicates a significant correlation solely with spoken sentence comprehension, and yellow indicates a significant correlation with both behavioral measures.
Figure 6A shows the contributing regions that have a negative correlation with both spoken word comprehension and production measures. According to the lesion-based model, the regions involved in the 2 language tasks are distinct. Spoken word comprehension was related to the left temporal lobe, whereas spoken word production was related to the left occipital and parietal–frontal lobes. Only the posterior part of the left temporal lobe and the temporal pole (marked in yellow) were related to both speech functions. According to the PosFDC-based model, the 2 weight maps were separated, with overlap only in the temporal pole. This was consistent with the results from the lesion-based model, which showed that areas related to spoken word comprehension were located in bilateral temporal lobes, while the regions associated with spoken word production were situated in the left occipital lobe, parietal lobe, and inferior frontal gyrus. The SDC-based model revealed that few edges of the left temporal and occipital lobes were linked to both speech functions, and the majority of edges were specific to spoken word comprehension or production.
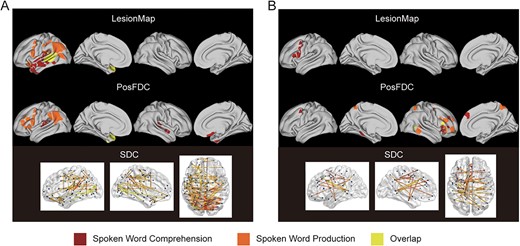
Overlap of significantly contributing regions between spoken word comprehension and production. (A) Overlapping negatively associated regions and edges. (B) Overlapping positively associated regions and edges. The deep red color represents a significant correlation solely with spoken word comprehension, orange suggests a significant correlation solely with spoken word production, and yellow indicates a significant correlation with both behavioral measures.
Figure 6B represents a comparison of the brain regions positively associated with spoken word comprehension and production scores. According to the lesion-based model, there were only regions significantly positively correlated with speech comprehension. According to the PosFDC-based model, only the right inferior frontal gyrus and posterior middle temporal gyrus were positively correlated with both spoken word comprehension and production. The regions significantly positively correlated with spoken word comprehension were predominantly in the left hemisphere, whereas those positively correlated with spoken word production were in the right hemisphere. The SDC-based model showed that a few edges were significantly positively correlated with both language measures, distributed between the lobes within the left hemisphere and between the left and right hemispheres.
The quantitative results (Table S1 and Table S2) further indicated that the contributing regions for the spoken word and sentence comprehension have more in common, but spoken word comprehension and production showed more in distinction.
Discussion
In this study, we compared and investigated neural mechanisms underlying 3 different linguistic tasks concerning speech comprehension and production with multivariate lesion/disconnectome-symptom mapping. The results showed that all of the lesion, PosFDC, and SDC maps could significantly predict poststroke speech comprehension and production scores independently. The identified significantly contributing brain regions for predicting both spoken word and sentence comprehension scores were mainly located around the Wernicke’s area, particularly the left posterior superior temporal gyrus. On the other hand, the contributing regions for spoken word comprehension and production fit the dual stream model proposed by Poeppel and Hickok (2004): the contributing brain regions for spoken word comprehension were situated in the ventral pathway, i.e. within the lateral temporal lobe and extending to the temporal pole; the contributing brain regions for spoken word production were located in the dorsal pathway, mainly consisting of frontal–parietal regions.
Our results demonstrated that the PosFDC map could significantly predict post-stroke linguistic task scores (e.g. speech comprehension and production). This contrasts with a recent study by Salvalaggio et al. (2020), which reported the predictive power of functional disconnection for behavioral scores across a variety of domains was lower than SDC. This discrepancy may relate to the within-gray matter restriction to the BOLD signal extraction as well as the removal of negative functional connectivity in the functional disconnectome feature (Boes et al. 2015; Salvalaggio et al. 2021; Trapp et al. 2023). On the other hand, a number of previous studies have consistently shown that SDC could successfully predict poststroke behavioral scores (Griffis et al. 2019; Wiesen et al. 2020; Billot et al. 2022; McCall et al. 2022; Pan et al. 2022; Jiang et al. 2023), compatibly with our current SDC-based results.
The contributing brain regions for spoken word and sentence comprehension scores were similarly distributed around the superior and middle temporal gyri. These results were consistent with previous findings and supported the classical theory of Wernicke’s area (Poeppel and Hickok 2004; Geranmayeh et al. 2014; Matchin et al. 2022b). Following previous results based on voxel-based lesion symptoms (Bates et al. 2003) or functional imaging techniques (Papathanassiou et al. 2000; Awad et al. 2007), this study further identified similarities and differences in contributing structural connections for these 2 linguistic tasks. As like the functional anomalies, spoken sentence comprehension involved more widely distributed contributing structural connectivity than spoken word comprehension. This may relate to more complex syntactic analysis demands of spoken sentence comprehension, compared with spoken word comprehension (Abuom et al. 2013; Abu et al. 2022; Horne et al. 2022).
Intriguingly, the identified contributing brain regions for spoken word comprehension and production align with the dual stream model. Specifically, the contributing regions of spoken word comprehension were located around the ventral stream, whereas the contributing regions of spoken word production were located in the dorsal stream. This is also compatible with the Matchin and Hickok (2020) model, which proposed that both the left temporal and frontal lobes play an important role in syntactic processing, but they correspond to different functions, perception, and production, respectively. Along this line, there have been a number of evidence supporting core differences (Matchin and Wood 2020; Matchin et al. 2022a; Arvidsson et al. 2023) and asymmetries (Giglio et al. 2022) in the brain regions involved in syntactic comprehension and syntactic production processing. The negative finding of the difference between production and comprehension in previous studies (Segaert et al. 2012, 2013; Fedorenko et al. 2020; Hu et al. 2023) might relate to different linguistic tasks for measuring speech comprehension and production, compatible with the multidimensional nature of language processing.
Only the left temporal pole was identified as the overlapping contributing brain regions for predicting word comprehension and production task scores. The particular region has been widely deemed as a core hub for semantic processing, including word and sentence comprehension (Olson et al. 2007; Lambon Ralph et al. 2009; Jackson et al. 2015; Córcoles-Parada et al. 2019). Our current finding further indicated a role of the left temporal pole in multiple levels of language processing including production (Branzi et al. 2021; Kim et al. 2022; Mizrahi and Axelrod 2023).
This study revealed the contributing brain regions associated with different linguistic tasks using only lesion locations and normative neuroimaging datasets together with a multivariate regression approach, complementary to traditional univariate correlation approaches. The negative weight of the identified contributing regions (mostly the well-documented language areas) suggested that damages/lesions to these regions or their connectivity likely accompany worse performance in language tasks, and this is compatible with prior knowledge in poststroke language deficits (Fridriksson et al. 2018; Matchin et al. 2022b). However, the meaning of the positive weight for the identified contributing regions is less straightforward. The positive weight might indicate a role of these regions’ damage in poststroke behavioral improvement/recovery (Xu et al. 2004; Hartwigsen et al. 2013; Mattioli et al. 2014; Li et al. 2021), but such interpretation is counter-intuitive. It is possible that the positive weight is simply a mathematical artifact and driven by forced orthogonalization, which possibly accounts for the much less overlap of positive weighted regions between modalities (as shown in Figs. 5B and 6B). Further investigations are needed to address this issue in the future.
A few limitations should be addressed. First, despite our cross-validation within the sample, the generalizability of our current findings needs to be further verified by another stroke patient cohort with a larger sample size in future studies. Next, the 3 linguistic tasks concerning speech comprehension and production in this study differ on multiple dimensions, e.g. word/sentence level and syntactic and semantic demands. To specifically elucidate neural similarity and dissimilarity between speech comprehension and production process, well-designed speech comprehension and production tasks matched in these dimensions are warranted in future studies.
Conclusions
In conclusion, lesion, structural disconnection, and functional disconnections were valuable predictors of poststroke linguistic scores concerning speech comprehension and production. The contributing regional maps indicated that impairments in spoken word and sentence comprehension were both related to the superior temporal gyrus and middle temporal gyrus, i.e. the traditional distribution of Wernicke’s area. In contrast, regions related to spoken word comprehension and production impairments were mainly located around the ventral and dorsal streams of the dual stream model, respectively.
Acknowledgments
We sincerely thank Dr William Matchin and the other anonymous reviewers for their valuable comments. We also thank Junhao Luo and Haokun Li for their valuable discussions.
Author contributions
Yaya Jiang (Conceptualization, Formal analysis, Visualization, Writing – original draft, Writing – review & editing), Gaolang Gong (Conceptualization, Resources, Supervision, Writing – review & editing).
Funding
This work was supported by the National Natural Science Foundation of China (82172016, T2325006, 82021004), the STI 2030-Major Projects (2021ZD0200500, 2021ZD0201701), and the Fundamental Research Funds for the Central Universities (2233200020).
Conflict of interest statement: None declared.
Data availability
We have made all the significant weighting maps publicly available for download at https://github.com/YayaJiang0605/Common-and-Distinct-Patterns.