


Abstract
Fractal patterns have been shown to change in resting- and task-state blood oxygen level-dependent signals in bipolar disorder patients. However, fractal characteristics of brain blood oxygen level-dependent signals when responding to external emotional stimuli in pediatric bipolar disorder remain unclear. Blood oxygen level-dependent signals of 20 PBD-I patients and 17 age- and sex-matched healthy controls were extracted while performing an emotional Go-Nogo task. Neural responses relevant to the task and Hurst exponent of the blood oxygen level-dependent signals were assessed. Correlations between clinical indices and Hurst exponent were estimated. Significantly increased activations were found in regions covering the frontal lobe, parietal lobe, temporal lobe, insula, and subcortical nuclei in PBD-I patients compared to healthy controls in contrast of emotional versus neutral distractors. PBD-I patients exhibited higher Hurst exponent in regions that involved in action control, such as superior frontal gyrus, inferior frontal gyrus, inferior temporal gyrus, and insula, with Hurst exponent of frontal orbital gyrus correlated with onset age. The present study exhibited overactivation, increased self-similarity and decreased complexity in cortical regions during emotional Go-Nogo task in patients relative to healthy controls, which provides evidence of an altered emotional modulation of cognitive control in pediatric bipolar disorder patients. Hurst exponent may be a fractal biomarker of neural activity in pediatric bipolar disorder.
Introduction
Bipolar disorder (BD) is a generalized neuropsychiatric disorder in which individuals exhibit inattention and decreased motivational behavior or goal-orientation in multiple functional areas (Yurgelun-Todd and Ross 2006; Zhang et al. 2011). BD can be divided into mania (BD-I) and hypomania (BD-II) based on whether there is a full-blown manic episode. BD-I is characterized by periodic episodes of mania and depression, usually accompanied by periods of relative relief of symptoms or euphoria (Robinson et al. 2008). It is believed that people with BD exhibit symptoms of emotional dysregulation, further leading to deficits in emotional recognition and assessment (Poletti et al. 2018).
Understanding how emotion is regulated is important in BD. It is believed that emotional dysregulation causes cognitive impairment through interaction between cognitive and emotional brain networks (Pavuluri et al. 2007; Wessa et al. 2007). Compared with controls, euthymic pediatric bipolar disorder (PBD) exhibited increased activation in higher-order visual perception areas and decreased activation in visual areas of the occipital cortex in a face processing task. This suggests that the patient has an inability to regulate emotional responses to the face and struggles to control sensory input (Pavuluri et al. 2007). In addition, in terms of emotion recognition and assessment, facial emotion is often used to study emotional processing. Assessing facial emotion recognition ability is helpful to understand the emotional regulation of BD patients (Pavuluri et al. 2007; Delvecchio et al. 2013). It was demonstrated that BD-I patients have difficulty in recognizing fearful and angry faces, and BD patients tend to judge extreme emotions as moderate or mild (Rocca et al. 2009). PBD patients showed greater amygdala activity and decreased ventrolateral prefrontal cortex (VLPFC) activity as participants passively viewed happy and angry faces (Pavuluri et al. 2007). In the recognition of negative emotions, the right inferior frontal gyrus (IFG) activation was reduced in BD patients (Hafeman et al. 2014). Researches using emotional Go-Nogo tasks have demonstrated that in euthymic BD, Nogo minus Go contrast revealed greater activation in IFG, insula, and orbitofrontal cortex (Hummer et al. 2013), comparison of emotional versus non-emotional distractors revealed greater activity in prefrontal cortex, cingulate cortex, parietal cortex and insula, and comparison between emotional and neutral distractors revealed an increased neural response in a fronto-striatal circuit (Wessa et al. 2007). In short, emotional regulation is a complex process, which is a “buffering” system that can respond flexibly to constantly changing conditions (Ortiz and Alda 2018). The system of BD become more organized over a longer time scale and less flexible, which different from that of healthy subjects (Bayani et al. 2017). The process of emotional variability might be better described using fractal dynamics.
Many physiological signals demonstrate fractal fluctuations on a wide time scale from seconds to hours, which is typical of self-similarity time patterns or statistical characteristics. Evidence suggested that the brain and its functional activities express fractal behavior on a limited scale. Fractal fluctuations are very complex, neither too random nor too regular. It is believed that fractal regulation may reflect integrity and adaptability of a physiological system in terms of maintaining internal stability meanwhile responding to external alterations, while the degradation of fractal regulation signifies the loss of functional flexibility and increased vulnerability to destructive events (Goldberger et al. 2002; Knapen et al. 2021). It has been shown that blood oxygen level-dependent (BOLD) signal of the brain exhibits fractal-like dynamics. That means the self-similarity in the time course of the BOLD signal (Gentili et al. 2015; Long et al. 2022) and it may be illustrated by a widely used indicator, Hurst exponent (HE), an index in the range of 0 to 1. According to the HE values, time series can be divided into three categories. (i) HE equals or close to 0.5 suggests a white noise series, indicating a process of with less memory and low predictability. (ii) HE between 0 and 0.5 indicates an anti-correlation time series with a dynamic of reversal in time. (iii) HE between 0.5 and 1 indicates a positively correlated series with long memory and it is more predictable (Gentili et al. 2015). By present changes in the degree of correlation in the signal, the HE value of the BOLD signal specifies if and how internal and external stressors affect brain function (Campbell and Weber 2022). HE has been used to investigate randomness and self-similarity of BOLD time series in healthy and diseased subjects and some significant results were reported. It was found that HE of resting-state fMRI signal was greater in gray matter than in white matter regions (Wink et al. 2008). The average HE value of the gray matter of whole brain became larger along with the increase of age. The most significant increase located in the parietal lobe and frontal lobe and some brain regions showed a downward trend of HE, mainly in emotion regulated brain regions including the temporal lobe, limbic lobe, and insula (Dong et al. 2018). Compared to healthy controls, higher HE of resting-state fMRI signals in medial and lateral temporal lobes, insula, dorsal cingulate/medial premotor cortex was found in Alzheimer’s disease subjects (Maxim et al. 2005). And higher HE at mean whole brain and regional levels was demonstrated in schizophrenia people while performing the Cyberball social exclusion task (Sokunbi et al. 2014). Furthermore, structural magnetic resonance imaging (MRI) research indicated increases in fractal dimensions (in patients relative to controls) in left lateral orbitofrontal cortex and right precuneus, and decreases in right caudal middle frontal, entorhinal cortex, and right pars orbitalis, and left fusiform and posterior cingulate cortices in BD (Nenadic et al. 2017). Considering the inherent relationship between brain structure and brain function, we speculate that the brain activity of BD, such as the neural response to external stimuli, will exhibit abnormal fractal characteristics in brain regions implicated in emotion regulation and cognitive control. There are few reports on this issue and further research is needed.
To test the hypotheses, a functional MRI (fMRI) Go-Nogo paradigm comprising both emotional and non-emotional task conditions was conducted in the present study. Fractal index of the BOLD signals of brain regions showing regional activations was analyzed, and relation between the fractal index and clinical indices was evaluated.
Materials and methods
Subjects
The data of the present study included 20 PBD-I patients from the Child and Adolescent Psychiatry Department of the Second Xiangya Hospital of Central South University in Changsha, Hunan Province. Seventeen age- and sex-matched healthy controls were randomly recruited from local secondary schools. The data for this study were collected from January 2012 to July 2014.
Inclusion criteria for PBD patients included the following: (i) meeting the criteria for BD of the Diagnostic and Statistical Manual of Mental Disorders, Fourth Edition (DSM-IV); (ii) right-handed; (iii) aged 10–18 years; (iv) keeping body still during MRI scan; (v) Han nationality. Exclusion criteria for all subjects included the following: (i) IQ < 80; (ii) MRI contraindications such as claustrophobia, stents, and metal implants; (iii) having a neurological disease, such as injury to the head; (iv) other mental disorders, such as schizophrenia, personality disorders, or autism; (v) alcohol or drug addiction; and (vi) having received electroconvulsive therapy.
The present study was approved by the ethic committee of the Second Xiangya Hospital of Central South University. Written informed consent from all subjects and their guardians were obtained.
Clinical evaluations
Two experienced psychiatrists diagnosed all PBD patients by implementing the Emotional Disorders and Schizophrenia Scale for School-Age Children-Current and Lifetime Versions (Kaufman et al. 1997). The subjects and at least one guardian underwent a diagnostic semi-structured interview. Demographic information and clinical data were collected by questionnaires. The intelligence of all participants was assessed using the Wechsler Reduced Scale of Intelligence (WASI). Before the MRI scan, the Mood and Senses Questionnaire (MFQ; Chang et al. 2005) and Young Mania Rating Scale (YMRS; Young et al. 1978) were used to assess the severity of depression and mania symptoms respectively. YMRS is an 11-item clinician rating scale, and the score correlates with symptoms of mania. The higher the score, the more severe the degree of mania. MFQ is a 33-item measure to assess emotional symptoms in subjects. The more severe the degree of depression, the higher the score of the scale. Demographic data such as age of onset, duration of illness, number of episodes and psychotic symptoms were recorded. One patient fulfilled the criteria for a comorbid attention deficit hyperactivity disorder (ADHD) and generalized anxiety disorder (GAD). Two patients have comorbidity ADHD and GAD respectively. Three patients were medication-free, and 17 patients were taking psychotropic medication. Among those who were on regular medication, 1 received antidepressant, 1 received atypical neuroleptics, and 15 received a combined pharmacological treatment (e.g. lithium, valproate, and atypical antipsychotics).
Go-Nogo task paradigm
The task flow of fMRI in emotional Go-Nogo paradigm is shown in Fig. 1. Participants were asked to identify happy, sad and neutral facial expressions which from pictures of facial affect (Ekman and Friesen 1976), and perform keystroke tasks, including pressing a button when the target face was present and not responding when the distractor was present. The task consisted of eight blocks, six of which were emotional blocks (Go) with materials contained happy, sad and neutral faces, and the other two were control blocks (Nogo) with materials contained male, and female faces with neutral emotions. Each block lasts for 36 s and contains 16 targets and 8 distractors, which constantly appear through a pseudo-random sequence. Each stimulation lasted for 500 ms, and the stimulation interval was 1,000 ms. The subjects were asked to read the instructions (4,000 ms) before the start of each block and subsequently either respond or not respond to the stimulus. E-prime software was used to record the response time and accuracy of each subject.
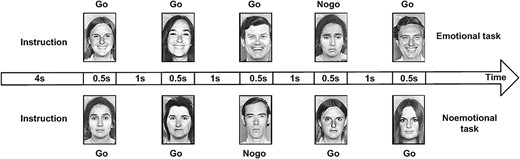
Task flow of fMRI in emotional Go/Nogo paradigm. Each stimulation lasted for 500 ms, and the stimulation interval was 1,000 ms. instructions lasts for 4,000 ms before the start of each block. Each block lasts for 36 s and contains 16 targets and 8 distractors, which constantly appear through a pseudo-random sequence.
MRI data acquisition and preprocessing
MRI images were collected on a 3.0 T Siemens Trio scanner (Siemens, Munich, Germany). During the MRI scanning, foam pads were placed on either side of the subject’s head to restrict head movement. Cotton plugs were used to reduce noise and protect the subject’s hearing. Structural images were obtained by using 3D magnetization and rapid acquisition gradient echo (3D MPRAGE) protocol. Detailed parameters covering the whole brain include repetition time (TR) =2,300 ms, echo time (TE) =2.03 ms, field of view (FOV) =256 × 256 mm2, flip angle =9o, matrix size =256 × 256, slice thickness = 1 mm, and gap =0 mm. Functional images were performed using T2-weighted single echo gradient imaging sequences with scan parameters as: TR = 2,000 ms, TE = 30 ms, FOV = 240 mm × 240 mm, flip angle = 90o, matrix size =64 × 64, slice thickness = 4 mm, and gap = 0.4 mm. The functional scanning lasted for 620 s, yielding a total of 310 volumes.
The fMRI signals were preprocessed in the following steps by SPM12. The first three volumes of each subject’s fMRI image were discarded in consideration of magnetization equilibration effects. The images were then sectioned for slice timing, realignment, covariate regression (Friston 24 parameter model, white matter signal, cerebrospinal fluid signal, and global signal) and spatial normalization. Finally, fMRI images were spatially smoothed using a 6 mm Gauss kernel FWHM.
BOLD changes associated with Go-Nogo task
SPM12 was used to analyze fMRI data by two level general linear model. At the subject level, the images of each subject were contrasted in three different ways. First, contrasts were made to observe task states versus resting states, which enables them to evaluate the influence of emotional valence in the task. Next, emotional versus non-emotional states contrasts were created to investigate the influence of emotional factors on the task performance. At last, emotional distractor versus neutral distractor were compared in emotional tasks to analyze the effect of emotional titer on response suppression. These outputs were input into second-level analyses to study neural correlates of tasks in each group (one-sample t-test) and determine regions that were significantly different between the PBD-I patients and the HCs (two-sample t-tests) (α < 0.05 with false discovery rate (FDR) corrected).
The brain atlas (Fan et al. 2016) that partitions the cerebral cortex into 246 ROIs, including 210 cortical sub-regions and 36 subcortical sub-regions, was used to identify brain regions where BOLD signals were significantly associated with tasks in the PBD-I and HCs groups. After overlapping the group activation map and the atlas, the fMRI signal of a region of interest (ROI) was extracted by averaging the intensity of all voxel signals in the ROI at each time point and used for further analyses.
HE calculation
Dispersion analysis, an effective method to detect the temporal complexity of a time series with requiring smaller datasets and exhibiting less bias (Bassingthwaighte and Raymond 1995), was utilized to derive the HE of the BOLD data series in the present study. It calculates descriptive statistical measures as a function of scale with local measure is the mean of time series of a window and the partition-based measure is the standard deviation of local means (Eke et al. 2002).The time series is divided into nonoverlapping windows of size m, and the standard deviation within the window SD(m) depends on the window size, m, in a power–law relationship:
The following practical formula is obtained by taking the logarithm
where m is the element size used to calculate SD, and m0 is the arbitrarily chosen reference size that is the number of points aggregated together in a time series (Bassingthwaighte and Raymond 1995). The HE may be read off as the slope of the line on the log–log plot. In the present study, m = 2 and m0 = 1.
Statistical analysis
Demographic data and task performance scores were analyzed using Chi-square test and independent sample t-test. A second-level random effects analysis was conducted to create task related T-statistics maps of the fMRI data, followed by a one-sample T-test and a two-sample T-test in SPM12. Brain regions where the BOLD signal showed significant correlation with the task and differences between PBD and HC groups were set ROIs. Averaged BOLD signals of the ROIs were extracted and the HE of the time series of the ROIs were calculated. Permutation testing was performed to test the null hypothesis that the HE showed no significant difference between the two groups other than by chance. The values were randomly relabeled 5,000 times and a distribution of the test statistic was obtained. The permutated P-values were obtained by the occupied null models with less than 5% or greater than 95% and corrected by FDR with P < 0.05. Correlations between clinical indices and values of HE were estimated with age and gender regressed. Due to the small sample of each group in the present study, effect size (Cohen’s d) was calculated to discover between-group difference of HE. A P-value < 0.05 was considered significant for all statistical analyses.
Results
Demographics and clinical data
As shown in Table 1, no significant difference was found in gender (P = 0.254), age (P = 0.064), educational years (P = 0.232), IQ (P = 0.703), and MFQ scores (P = 0.742) between the two groups (PBD-I, HC). There were significant differences between the two groups in scores of YMRS (P < 0.001). No significant difference was found in error of omission, error of response and reaction time between the two groups.
Demographic characteristics and clinical variables.
| Characteristics | PBD-I (n = 20) | HCs (n = 17) | Statistic (T/χ2) | P-value |
|---|---|---|---|---|
| Gender (male/female) | 12/8 | 7/10 | 1.303 | 0.254 |
| Age (years) | 15.25 ± 1.65 | 14.24 ± 1.56 | 1.910 | 0.064 |
| Education (years) | 8.15 ± 1.50 | 7.59 ± 1.28 | 1.216 | 0.232 |
| IQ | 105.60 ± 10.29 | 106.71 ± 6.33 | −0.385 | 0.703 |
| YMRS scores | 25.43 ± 14.08 | 7.88 ± 3.30 | 5.010 | <0.001 |
| MFQ scores | 6.60 ± 3.52 | 6.24 ± 3.11 | 0.331 | 0.742 |
| Onset age (years) | 13.90 ± 1.74 | |||
| Illness duration (months) | 16.85 ± 13.41 | |||
| Number of episodes | 2.60 ± 1.31 | |||
| Psychotic symptoms (yes/no) | 6/14 | |||
| Task performance | ||||
| Emotional targets (Go) | 5.16 ± 1.73 | 4.26 ± 2.28 | 1.35 | 0.18 |
| Neutral targets (Go) | 2.89 ± 1.87 | 3.27 ± 1.94 | −0.61 | 0.54 |
| Control targets (Go) | 1.88 ± 1.05 | 1.64 ± 1.04 | 0.66 | 0.51 |
| False response errors (%) | ||||
| Emotional distractors (Nogo) | 3.18 ± 1.01 | 2.93 ± 1.51 | 0.59 | 0.55 |
| Neutral distractors (Nogo) | 2.40 ± 1.32 | 2.14 ± 0.91 | 0.69 | 0.49 |
| Control distractors (Nogo) | 2.26 ± 0.78 | 2.46 ± 1.33 | −0.56 | 0.57 |
| Reaction time (ms) | ||||
| Emotional targets (Go) | 590.09 ± 8.05 | 604.63 ± 62.10 | −0.59 | 0.53 |
| Neutral targets (Go) | 591.78 ± 78.88 | 592.27 ± 69.02 | −0.02 | 0.98 |
| Control targets (Go) | 565.57 ± 66.19 | 555.72 ± 65.86 | 0.45 | 0.6 |
Values are presented as mean ± standard deviation. Except for the Chi-squared test for gender, independent sample t-test was used for comparison of other variables. PBD-I, pediatric bipolar disorder type I; HCs: healthy controls; IQ: intelligence quotient; YMRS: Young Manic Rating Scale; MFQ: Mood and Feelings Questionnaire.
BOLD changes associated with Go-Nogo task
No significant regional brain activation difference was found in the contrast of all Go-Nogo conditions versus the rest and contrast emotional and non-emotional revealed between the PBD-I patients and HCs.
In the contrast of emotional distractor versus neutral distractor during Go-Nogo task, clusters that covering frontal lobe, parietal lobe, temporal lobe, limbic lobe, insula, and subcortical nucleus demonstrated increased brain regional activations in PBD1 patients than that of the HCs (FDR-corrected, Fig. 2). The brain atlas that partitions the cerebral cortex into 246 ROIs was used to identify the activated brain regions. After overlapping the group activation map and the atlas, 13 brain regions were survived including A10m (superior frontal gyrus, SFG), A45r (IFG), A12/47 l (frontal orbital gyrus, FOG), A4hf (precentral gyrus, PrG), A4ul (PrG), A1/2/3ll (paracentral lobule, PCL), A20iv (inferior temporal gyrus, ITG), TL (parahippocampal gyrus, PhG), A39c (inferior parietal lobule, IPL), A39rd (IPL), dIa (insula, INS), mAmyg (amygdala, Amyg), and cHipp (hippocampus, Hipp). Details of the 13 regions were described in Table 2. The fMRI signals the 13 brain regions were extracted for further HE calculation to evaluate the fractal dynamic characteristics of the signal.
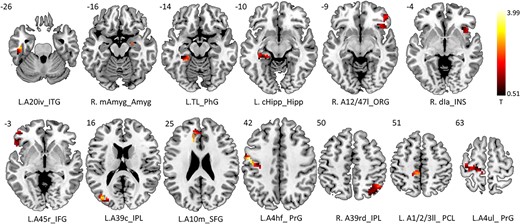
Increased activations of PBD1 patients than HCs in contrast of emotional distractor versus neutral distractor during Go Nogo task (FDR-corrected). Active clusters were found covering frontal lobe, parietal lobe, temporal lobe, limbic lobe, insula, and subcortical nucleus. The brain atlas that partitions the cerebral cortex into 246 ROIs was used to identify the activated brain regions. After overlapping the group activation map and the atlas, 13 brain regions were survived including A10m (SFG), A45r (IFG), A12/47 l (FOG), A4hf (PrG), A4ul (PrG), A1/2/3ll (PCL), A20iv (ITG), TL (PhG), A39c (IPL),A39rd (IPL), dIa (insula), mAmyg (amygdala), and cHipp (hippocampus). The fMRI signals the brain regions were extracted for further HE calculation.
Thirteen brain regions showing increased activations in PBD-I patients after overlapping the group activation map and Human Brainnetome Atlas.
| Lobe | Gyrus | Cytoarchitectonic name | Peak T value | Cluster size |
|---|---|---|---|---|
| Frontal lobe | Superior frontal gyrus | L.A10m | 2.667 | 84 |
| Inferior frontal gyrus | L.A45r | 1.482 | 43 | |
| Orbital gyrus | R. A12/47 l | 2.272 | 64 | |
| Precentral gyrus | L.A4hf | 3.994 | 121 | |
| L.A4ul | 3.303 | 108 | ||
| Paracentral lobule | L. A1/2/3ll | 2.588 | 18 | |
| Temporal lobe | Inferior temporal gyrus | L.A20iv | 2.971 | 37 |
| Parahippocampal gyrus | L.TL | 2.397 | 31 | |
| Parietal lobe | Inferior parietal lobule | L.A39c | 3.011 | 26 |
| R. A39rd | 2.674 | 128 | ||
| Insular lobe | Insular gyrus | R. dIa | 1.789 | 60 |
| Subcortical nuclei | Amygdala | R. mAmyg | 0.557 | 6 |
| Hippocampus | L. cHipp | 3.797 | 32 |
PBD-I: pediatric bipolar disorder type 1. L = left; R = right.
HE results
As shown in Table 3, among the 13 brain regions that showed hyperactivation in the contrast of emotional versus neutral distractor during the Go-Nogo task, 8 brain regions demonstrated significantly higher HE values of fMRI signals in the PBD-I patients compared with that of HCs(FDR-corrected). The regions included left A10m_SFG, left A45r_IFG, right A12/47 l_ORG, right A4hf_PrG, left A20iv_ITG, left A39c_IPL, right A39rd_IPL, and right dIa_INS.
PBD-I subjects exhibited significantly higher HE in eight brain regions than HCs.
| Brain regions | BA | PBD-I (n = 20) | HCs (n = 17) | p_FDR | Cohen’s d |
|---|---|---|---|---|---|
| L.A10m_SFG | 10 | 0.889 ± 0.069 | 0.827 ± 0.092 | 0.025 | 0.762 |
| L.A45r_IFG | 45 | 0.885 ± 0.075 | 0.811 ± 0.101 | 0.025 | 0.831 |
| R. A12/47 l_ORG | 47 | 0.889 ± 0.086 | 0.813 ± 0.084 | 0.041 | 0.894 |
| L.A4hf_ PrG | 6 | 0.889 ± 0.070 | 0.829 ± 0.081 | 0.021 | 0.792 |
| L.A4ul_ PrG | 6 | 0.822 ± 0.094 | 0.805 ± 0.096 | 0.320 | 0.178 |
| L. A1/2/3ll_ PCL | 0.844 ± 0.085 | 0.811 ± 0.088 | 0.145 | 0.381 | |
| L.A20iv_ITG | 20 | 0.902 ± 0.070 | 0.831 ± 0.074 | 0.018 | 0.985 |
| L.TL_PhG | 30 | 0.876 ± 0.099 | 0.830 ± 0.073 | 0.089 | 0.561 |
| L.A39c_IPL | 39 | 0.896 ± 0.061 | 0.821 ± 0.088 | 0.018 | 0.990 |
| R. A39rd_IPL | 39 | 0.892 ± 0.060 | 0.830 ± 0.099 | 0.025 | 0.757 |
| R. dIa_INS | 48 | 0.884 ± 0.069 | 0.830 ± 0.075 | 0.027 | 0.749 |
| R. mAmyg_Amyg | 0.874 ± 0.082 | 0.837 ± 0.072 | 0.101 | 0.479 | |
| L. cHipp_Hipp | 0.831 ± 0.093 | 0.818 ± 0.117 | 0.363 | 0.123 |
Data are shown in mean ± standard deviation. L = left; R = right; SFG: superior frontal gyrus; IFG: inferior frontal gyrus; ORG: orbital gyrus; PrG: precentral gyrus; PCL: paracentral lobule; ITG: inferior temporal gyrus; PhG: parahippocampal gyrus; IPL: inferior parietal lobule; INS: insular gyrus; Amyg: amygdala; Hipp: hippocampus; BA: Brodmann area; p_FDR: FDR-corrected P-values
Correlation analysis
With age and gender regressed, significant correlation was found between HE of ORG and onset age in PBD-I subjects (Fig. 3).
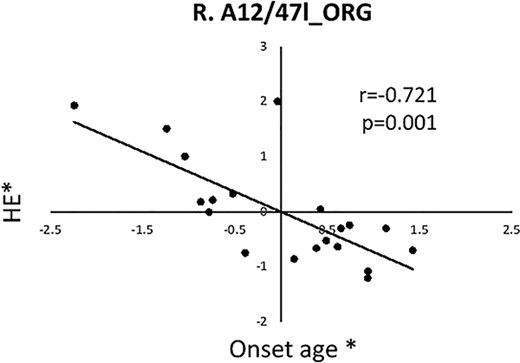
Significant correlation was found between HE of frontal ORG(A12/47 l) and onset age in PBD-I subjects. Asterisk (*) represents the adjusted values with age and gender regressed. ORG: Orbital gyrus; HE: Hurst exponent; R: Right.
Discussion
In the present study, an emotional stimulus in an emotional Go-Nogo task was conducted to evaluate emotional dysregulation process in PBD by investigating responses activation and alteration of fractal dynamic of BOLD signals. Increased neural responses and increased self-similarity were detected in PBD patients in predominantly cortical-limbic regions during the contrast of emotional distractor versus neutral distractor. No significant regional brain activation difference between PBD and HC subjects was observed in the contrast of Go-Nogo conditions versus resting state, and emontional versus non-emotional conditions. In addition, PBD adolescents exhibited no behavioral performance scarcity on the emotional Go-Nogo task.
It was reported that the response inhibition process in BD involves brain regions including the IFG, insula, dorsolateral prefrontal cortex, and parietal lobe to promote stimulus–response associations (Wessa et al. 2007). Consistent with this, the present study observed increased activation in a total of 13 brain regions including the above brain regions when comparing emotional and neutral distractors in PBD-I patients compared to healthy controls. The brain regions covered frontal lobe (SFG, IFG, ORG, PrG, PCL), temporal lobe (ITG, PhG), parietal lobe (IPL), insula, amygdala and hippocampus. The IFG extending into the right anterior insula was involved in refraining from action initiation (Cieslik et al. 2015; Fan et al. 2016). IPL is a component of frontoparietal network which is believed to guide attention to relevant stimuli, make trade-offs based on context, and maintain relevant information, so working memory and continuous attention are required (Seeley et al. 2007). Consistent with our results, increased brain activation to emotional versus neutral distractors was reported in orbitofrontal cortices and insula in euthymic bipolar patients. The increased orbitofrontal activation to happy distractors relative to neutral distractors was also found in manic BD patients (Elliott et al. 2000). The amygdala plays a key role in emotional information processing, and there is preliminary evidence of increased activation during mixed mood episodes in frontal and amygdala regions in BD (Chan et al. 2023). Resting glucose metabolism of euthymic old BD patients was found to be increased in the amygdala and PhG (Brooks 3rd et al. 2009). It was reported that manic patients showed elevated neuronal responses associated with emotional versus neutral targets in IFG (BA 47) and ITG (BA 20). On the other hand, most of the 13 brain regions discovered in the present study were key regions of ventrolateral circuit in corticlolimbic model related to BD (Brooks III and Vizueta 2014).The ventrolateral circuit consists of VLPFC, ventromedial striatum, globus pallidus, thalamus, anterior temporal cortex (BA20 and 38), and amygdala. It is believed to participate in responding to external emotional stimuli and regulating emotional expression. The overactivation of these brain regions discovered in the present study may cause damage to the ventrolateral circuit, thereby affecting PBD patients’ response to external stimuli. In a word, the overactivation of these regions may reflect a “compensatory” mechanism in which PBD patients need more efforts to engage the brain regions responsible for action inhibition and to achieve the same level of behavioral performance as healthy subjects.
Studies have verified that BOLD signals of the brain exhibit scale-free or fractal dynamics (Wei et al. 2013; Gentili et al. 2015). Fractal like dynamics represents the self-similarity of time series of BOLD signals. HE, an index between 0 and 1, is used to describe this self-similarity and a measure of brain activity complexity. Emotional regulation may be seen as a “buffering” system that allows for flexible responses to constantly changing conditions (Ortiz and Alda 2018). From a dynamic perspective, the characteristics that enable the system to adapt to these random changes are considered “complex” (Ortiz et al. 2021).The results of the present study indicated that, when comparing the emotional distractor versus neutral distractor during Go-Nogo task, the HE values of 8 among 13 overactivated brain regions were significantly higher in the patient group than in the normal group. The brain regions covering areas of frontal lobe (L.A10m_SFG, L.A45r_IFG, R. A12/47 l_ORG, L. A4hf_ PrG), temporal lobe (L.A20iv_ITG), parietal lobe (L.A39c_IPL, R. A39rd_IPL), and insula (R. dIa_INS)(Table 3). The enhanced HE means that the process during the Go-Nogo task have increased self-similarity and reduced complexity of BOLD signal in PBD-I patients. Furthermore, our correlation analysis results indicate that the decrease in complexity (increase in HE value) in ORG was negatively correlated with the age of onset of PBD. Consistent with our findings, reduced cortical complexity (gray matter fractal dimension) had been reported in frontal and temporal cortex that are heavily affected by BD subjects, which seem to reflect some neurodevelopmental antecedents (Squarcina et al. 2015; Nenadic et al. 2017). Furthermore, study of emotion and energy time series using paper-based visual analog scales exhibited a positive, short-term autocorrelation for both mood and energy series BD and HC groups with a more chaotic pattern in the time series for mood in HC than in BD participants (Ortiz et al. 2021), higher regularity of mood in patients with BD (Ortiz et al. 2015) and their unaffected first-degree relatives (Ortiz et al. 2019). Additionally, resting-state fMRI studies exhibited that brain dysfunction is associated with higher HE (lower fractal dimension) in individuals with autism spectrum disorder (Dona et al. 2017a) and mild traumatic brain injury (Dona et al. 2017b), with neurophysiological explanations as deficiency of adaptability and loss of functional components that accompany greater HE values. It has been suggested that healthy systems exhibited a more chaotic pattern, whereas damaged systems exhibit a more rigid pattern, lacking flexibility or resilience to adapt to the constantly changing demands of the environment (Ortiz et al. 2021). Brain regions shown increased HE in PBD subjects in the present study including dorsolateral prefrontal cortex, IFG, posterior parietal cortex, and insula are key regions of executive control network which involved in action initiation. The increase in BOLD signal HE in these brain regions indicates that the system responsible for responding to inhibition is not flexible enough for PBD-I patients to cope with the constantly changing needs of the environment when performing emotional Go-Nogo tasks. Thus, the BD may be believed as the result of a loss of complexity, rather than the loss of regularity (Ortiz et al. 2021).
In the present study, no significant difference was found in task performance between PBD-I patients and HCs. Similar results have been reported in euthymic and mix mood state BD subjects (Wessa et al. 2007; Morsel et al. 2017). It may suggest that BD patients have different neural mechanisms for achieving similar levels of performance as the HCs (Wessa et al. 2007). The compensatory over activation of key brain regions mentioned above, the increase of self-similarity and the decrease of complexity of neuronal activity process may contribute to the performance. On the other hand, this may also be related to the relatively simple nature of the Go Nogo task, while complex tasks, such as Stroop task, require more cognitive processes to be mobilized, which may lead to difficulty in response inhibition. The Go-Nogo task may directly enter the response inhibition process by load less other cognitive process. The advantage of utilizing simple task is that it displays changes of brain activity without being affected by differences in task performance, making an allowance for clear identification of neural abnormalities (Morsel et al. 2017).
Several limitations should be considered in the current study. Firstly, the sample size of each group in the study is relatively small. Studies involving more subjects are necessary to make more convincing conclusions in our future work. Secondly, medication exposure may influence the interpreting results of the present study. Though it has been reported that no significant effect of drug use in behavioral performance and neural activity between BD patients and HCs (Delvecchio et al. 2012; Jiang et al. 2020), more data from drug naïve BD patients will be extracted in our further research. Thirdly, the temporal sampling frequency (0.5 Hz) used to acquire the BOLD signal was relatively low, which may reduce the accuracy of fractal analysis. Higher sampling frequency may help to capture true dynamics of the neural activity process by means of fractal analysis. It is commanded that future research may use new MRI signal acquisition techniques to obtain BOLD signals and conduct fractal analysis and other nonlinear methods to mine more information.
Conclusions
The present study exhibited an overactivation, increased self-similarity and decreased complexity of BOLD signal in brain structures mediating response inhibition in PBD. The system that in charge of action inhibition is not flexible enough and requires greater effort to mobilize relevant brain regions to cope with cognitive tasks in PBD-I patients. HE may be a fractal biomarker of neural activity in PBD patients. Understanding the alteration in the fractal characteristics of the neural circuit related to response inhibition may provide useful clues for alleviating impulsive behaviors in BD, such as suicidal behavior and substance abuse.
Acknowledgments
We thank all the participants for their cooperation in the present study. All authors contributed to the article and approved the submitted version.
Author contributions
Yi-Bing Guo (Formal analysis, Methodology, Software, Validation, Visualization, Writing—original draft), Qian Xiao (Data curation, Funding acquisition, Resources), Qing Jiao (Conceptualization, Funding acquisition, Investigation, Project administration, Writing—review and editing), Weifang Cao (Funding acquisition, Writing—review and editing), Zhou Wu,Xiao-Tong Zhang (Investigation, Methodology, Software), Dong Cui (Supervision, Visualization), Guanghui Yu (Project administration, Supervision), Ruhai Dou (Investigation, Supervision), Linyan Su (Data curation, Resources), Guangming Lu (Data curation, Resources).
Funding
The present study was supported by the Funds for the National Natural Science Foundation of China (81371531 to Q.J.; 81901730 to W.-F.C.; 82201702 to Q.X.).
Conflict of interest statement: None declared.
Data availability
The data underlying this paper will be made available upon reasonable request the corresponding author.