


Abstract
The ability to suppress unwelcome memories is important for productivity and well-being. Successful memory suppression is associated with hippocampal deactivations and a concomitant disruption of this region’s functionality. Much of the previous neuroimaging literature exploring such suppression-related hippocampal modulations has focused on the region’s negative coupling with the prefrontal cortex. Task-based changes in functional connectivity between the hippocampus and other brain regions still need further exploration. In the present study, we utilize psychophysiological interactions and seed connectome-based predictive modeling to investigate the relationship between the hippocampus and the rest of the brain as 134 participants attempted to suppress unwanted memories during the Think/No-Think task. The results show that during retrieval suppression, the right hippocampus exhibited decreased functional connectivity with visual cortical areas (lingual and cuneus gyrus), left nucleus accumbens and the brain-stem that predicted superior forgetting of unwanted memories on later memory tests. Validation tests verified that prediction performance was not an artifact of head motion or prediction method and that the negative features remained consistent across different brain parcellations. These findings suggest that systemic memory suppression involves more than the modulation of hippocampal activity—it alters functional connectivity patterns between the hippocampus and visual cortex, leading to successful forgetting.
Introduction
Some memories we relish retrieving; others risk bringing our internal life and outward productivity to a standstill if allowed into consciousness. When confronted with a reminder of a memory that threatens to cause upset, individuals may summon cognitive control processes aimed at stopping—or suppressing—retrieval of the event. With practice, such control curbs unwanted memory intrusions in the moment, as well as the likelihood of their future retrieval—outcomes linked to the modulation of hippocampal activity (Levy and Anderson 2012; for a recent review, see Anderson and Hulbert 2021). Much of the evidence for these mnemonic outcomes stems from a procedure known as the Think/No-Think (TNT) paradigm.
The TNT paradigm was developed to model memory suppression in the laboratory, opening an empirical window to the behavioral consequences (Anderson and Green 2001) and neural correlates (Anderson et al. 2004) of attempts to stop memory retrieval. The paradigm consists of 3 main phases: an encoding phase, the critical TNT phase, and surprise memory tests. During encoding, participants are asked to learn a number of cue-target word pairs to criterion. Then, participants engage in the TNT phase, in which they repeatedly retrieve (Think condition) or suppress retrieval (No-Think condition) of the target words, when given the cue word. As reviewed in detail elsewhere (Anderson and Huddleston 2012; Anderson and Hanslmayr 2014; Anderson and Hulbert 2021; Marsh and Anderson 2022), surprise final tests for all the learned associates generally reveal that targets in the No-Think condition are less recallable than are the Baseline items, which were learned just as well at the outset, but which were omitted from the TNT phase. This below-baseline memory impairment has been termed suppression-induced forgetting (SIF).
Deployed strategically, effective memory suppression is thought to provide numerous psychological and health-related benefits (for perspectives on this topic, see Nørby 2015; Fawcett and Hulbert 2020), as evidenced by correlational evidence linking greater suppression abilities to reduced depression, anxiety, and PTSD symptoms (see Stramaccia et al. 2021, for a meta-analysis across these and other disorders). Whether the goal is to detect potential vulnerabilities or to train more adaptive coping habits in individuals who are facing or may face future challenges, understanding the nature of these relationships and their neural underpinnings is of critical concern. And just as appreciating the potential side effects of retrieval suppression can inform therapeutic approaches, their very existence has helped establish a more detailed mechanistic understanding of adaptive memory control in action (see Anderson and Hulbert 2021, for a review).
The targets of memory suppression are not the only items that tend to be forgotten after repeated attempts to stop retrieval. Episodic memories that are encoded (Hulbert et al. 2016) or cued (Zhu and Wang 2021) before or after periods of targeted retrieval suppression also become less accessible. This so-called “amnesic shadow” can affect memories that are entirely unrelated to the targets of retrieval suppression but simply are unlucky enough to occur near in time to suppression. This phenomenon bears a striking resemblance to organic amnesias caused by damage to the hippocampus (for reviews, see Spiers et al. 2001). In fact, the amnesic shadow was predicted based on numerous reports of hippocampal deactivations (relative to the Think condition, as well as to passive baseline conditions) observed during studies of memory suppression (Anderson et al. 2004; Depue et al. 2007; Benoit and Anderson 2012; Paz-Alonso et al. 2013; Gagnepain et al. 2014; Benoit et al. 2016; Yang et al. 2020; Apšvalka et al. 2022). Consistent with a role of hippocampal deactivations in successful memory control, hippocampal modulation is greatest (and predictive of SIF) when unwanted memories intrude and need to be purged from awareness (Levy and Anderson 2012; Gagnepain et al. 2017).
Successful retrieval of recent memories does not depend only on hippocampal activity; however, it also depends on interactions between the hippocampus and other brain regions, such as the neocortex (Treves and Rolls 1994; Sutherland and McNaughton 2000; Schott et al. 2013). One prominent view of retrieval holds that its success depends on pattern completion based on perceptual inputs to the hippocampus, helping to reinstate patterns that were initially encoded in the neocortex (Rolls 2013; Horner et al. 2015; Guzman et al. 2016; Hindy et al. 2016). Indeed, the human hippocampus has extensive connections with early visual cortex, parietal cortex, and cingulate gyrus, among other regions (Huang et al. 2021). These direct connections facilitate hippocampal-cortical communication, with recall of vivid memories being associated with higher communication efficiency of the hippocampal whole-brain network (Geib et al. 2017). If suppression, rather than retrieval, is the goal, connectivity within and between memory regions might be disrupted. Neuroimaging evidence supports this prediction. For example, suppression not only reduces bilateral hippocampal activity, but also activity in posterior cortex in a content-specific manner; thus, suppression of visual objects or places reduces activity in fusiform gyrus and parahippocampal place area, respectively (Depue et al. 2007; Gagnepain et al. 2014; Benoit et al. 2015; Mary et al. 2020). In addition, previous studies have also reported suppression-related downregulations in the visual cortex relative to the Think condition, both when words (Levy and Anderson 2012; Sacchet et al. 2017; Yang et al. 2020) and pictures were used as stimuli (Depue et al. 2007; Gagnepain et al. 2014; Benoit et al. 2015; Liu et al. 2016; Gagnepain et al. 2017). Like the hippocampus, these other regions are involved in memory representation and retrieval, though for more specialized forms of content (Albers et al. 2013; Rosenthal et al. 2016; Waldhauser et al. 2016). For example, visual or auditory cortical regions involved when encoding an event are also reactivated during that event’s retrieval (Nyberg et al. 2000; Wheeler et al. 2000; Waldhauser et al. 2016). The hippocampus, as a convergence zone, integrates information from many brain areas (Backus et al. 2016), yielding increased functional connectivity between the hippocampus and the neocortex, such as sensory cortex (Ranganath et al. 2005; Wolosin et al. 2012; Schott et al. 2013). Therefore, we might expect that successful suppression of unwanted memories should not only downregulate activity in the hippocampus and sensory cortex individually, but also disrupt the communication between these regions.
For present purposes, we examined how retrieval suppression modulates hippocampal connectivity with the rest of the brain by utilizing connectome-based predictive modeling (CPM; Shen et al. 2017; Goldfarb et al. 2020), which previously has revealed brain functional connectivity related to attention, stress, and creative ability (Beaty et al. 2018; Rosenberg et al. 2018; Goldfarb et al. 2020; Li et al. 2020). Using a cross-validation approach, CPM minimizes the chance of overfitting and improves test–retest reliability. Moreover, compared with other machine learning methods, the simplicity of the CPM approach allows for more interpretable models. Our aim was to exploit these methodological advantages to predict behavioral performance on a standard memory suppression task and to further elucidate the brain mechanisms of the associated cognitive processes.
In the current study, 134 participants completed the TNT task during functional magnetic resonance imaging (fMRI) scanning. To apply CPM, we first divided the brain into 132 regions, including cortical, subcortical, and cerebellar areas obtained from the Harvard-Oxford probabilistic atlases of brain structure (Tzourio-Mazoyer et al. 2002), and then we selected both the right and left hippocampi as anatomical seeds. As input features for the CPM, we used a generalized psychophysiological interaction (g-PPI) method to calculate the functional connectivity changes between seed regions with other brain regions during memory suppression (McLaren et al. 2012). Ridge regression was used to build the prediction model, allowing for different features to contribute flexibly to the prediction model.
We hypothesized that superior forgetting of unwanted memories would arise, in part, by disrupting communication between the hippocampus and posterior cortical regions involved in memory, including the visual cortex, fusiform gyrus, and the parahippocampal gyrus. Such disrupted communication should be reflected in reduced functional connectivity between the hippocampus and these regions during suppression trials. We based this hypothesis on evidence that inhibiting memory retrieval may interrupt pattern completion (Anderson et al. 2004; Depue 2012), which, in turn, would alter hippocampal functional connectivity with regions involved in memory representation.
Materials and methods
Participants
We recruited 146 students from Southwest University for this study. All participants had no history of visual, medical, neurological, or memory disorders, and completed the TNT phase (Anderson et al. 2004) during fMRI scanning. After removing participants because of missing behavioral indices or functional scans and becuase of severe head motion (predefined as mean FD > 0.3 mm), 134 participants (Male: 41, Female: 93; average age: 19.5 years) were retained for analyses. This study has been approved by the Academic Committee of Southwest University in China and written informed consent was obtained from each of the subjects. The resting-state images and behavioral data of the overall set of 146 participants were used in another study (Yang et al. 2021). In the current study, we only considered the functional data.
Behavioral assessment (TNT task)
Participants performed the TNT task (Anderson et al. 2004), which assesses the ability to suppress unwanted memories. The TNT task consists of 3 main phases: the encoding phase, the TNT phase, and the memory test phase. The TNT phase was completed in the scanner, whereas the encoding phase and memory test phases were completed outside the scanner. Further task details are provided elsewhere for space reasons (Yang et al. 2020). Here, we briefly describe the 3 main phases.
Encoding phase
During the encoding phase, participants were asked to study associations between 66 weakly related cue-target word pairs such that when presented each cue word, they would be able to reliably recall the associated target. To advance to the main TNT phase, participants were required to recall at least 50% of the target words when presented with their associated cue. Participants had up to 3 test-feedback cycles to demonstrate this competence after an initial study period.
TNT phase
After participants demonstrated successful encoding of the threshold number of cue-target word pairs, they were asked to practice the TNT task using filler pairs to ensure that participants understood the instructions pertaining to the Think and No-Think conditions. The training phase consisted of 2 blocks. After participants completed each training block, the experimenter administered a standard diagnostic questionnaire to make sure they followed the instructions correctly (Liu et al. 2021). Before entering the scanner to complete the critical TNT task, participants received a 5-min break. Then, prior to scanning, the correct word pairs were presented one final time (in a re-randomized order) to refresh the materials in the scanner environment.
The critical TNT phase consisted of 6 runs in a single session, with each run lasting 6.7 min and involving the presentation of 16 Think cues and 16 No-Think cues (each cue was presented twice in each run, according to blocked randomization, with the condition assignments for the pairings counterbalanced across participants). Cues from the remaining third of the studied word pairs did not appear during the TNT phase, as they were reserved to provide a baseline measure of memory on the final test, given that they would neither have been suppressed nor retrieved during the TNT phase. As in the practice phase, cue words from the Think condition appeared in green for 3 s, indicating that participants were to silently recall the associated target and keep it in mind for the entire time that the cue remained on the screen. For No-Think trials, the cue word appeared in red for an equal duration while participants sought to prevent the associated target word coming into mind; on these No-Think trials, participants were told to directly suppress retrieval to block out the unwanted item, without trying to distract themselves by substituting another word, image, or idea for the unwanted target. Across both conditions, participants were trained to keep their eyes and attention fixed on the presented cues throughout the trial duration. It is worth noting that the word pairs cued in the TNT phase included those that were successfully memorized in the encoding phase, as well as those that were not successfully memorized. Therefore, for the purpose of our analysis, the studied word pairs could be further conditionalized based upon whether participants had successfully recalled the target word in the final test-feedback round of the encoding phase, ensuring that only successfully learned pairs contributed to the analyses we discuss.
Memory test phase
After the critical TNT phase, participants completed surprise memory tests for all the studied targets outside the scanner. After asking participants to think back to the original encoding phase (in order to reinstate the encoding phase context), they were asked to recall the targets to 18 filler pairs targets, cued one at a time with the original cue word. This practice test allowed participants to adjust to the instructions to try their best to recall the target words matching the given cues, regardless of what happened in the preceding phase. Participants’ memory for the critical pairings was then tested in a block-randomized fashion with respect to TNT condition, ensuring that the average test position of the Baseline, Think, and No-Think items was equated and that output interference was matched. Each critical target was tested in 2 ways during this phase, each assessing the accessibility of the learned targets. The same-probe (SP) test, involves the presentation of the original cues on the screen for 3.4 s (interstimulus interval 0.6 s) each as test prompts to elicit the learned target words. The independent-probe (IP) test is designed to measure inhibition in a way that bypasses the original cue-target association and any associative interference that the original cue may trigger (Anderson and Green 2001). Similar to the SP test, the IP test presents a category or a semantically related cue on the screen for 3.4 s (interstimulus interval 0.6 s) as test prompts to elicit the target word fitting the cues. The order of the SP and IP test was counterbalanced across subjects.
MRI data acquisition
A Siemens 3T scanner (Siemens Magnetom Trio TIM, Erlangen, Germany; 3.0T MAGNETOM Trio TimSystem) was used to collect the functional and structural images from 146 participants. T1-weighted brain anatomical data were collected using a magnetization-prepared rapid gradient echo (MPRAGE) sequence (time repetition, TR = 1,900 ms; flip angle, FA = 9°; 256 × 256 matrix; time echo, TE = 2.52 ms; time to inversion, TI = 900 ms; 176 slices; slice thickness = 1.0 mm; and voxel size = 1 mm × 1 mm × 1 mm). The T2*-weighted functional images were recorded using an echo planar imaging (EPI) sequence (TR = 2,000 ms; TE = 30 ms; matrix size = 64 × 64; 32 interleaved 3-mm thick slices; flip angle = 90°; in-plane resolution = 3.4 × 3.4 mm; field of view (FOV) = 220 × 220 mm; and interslice skip = 0.99 mm).
Image preprocessing
The brain imaging data were preprocessed using the CONN toolbox (Whitfield-Gabrieli and Nieto-Castanon 2012) in MATLAB vR2018a (The MathWorks, MA, United States). The scans were first coregistered and then resampled to a reference image. Slice-timing correction was used to correct for time shifts by resampling to match the slice time in the middle of each TA. At this stage, we also identified outlier scans, which produced a new reference image by averaging across all scans (except for the outlier scans). The SPM12 unified segmentation and normalization procedure (Ashburner and Friston 2005) was used to normalize functional images to standard MNI space and segment them into gray matter, white matter (WM), and CSF. We then smoothed the functional data with a Gaussian kernel of 8-mm FWHM. However, we did not use the smoothed functional data for our functional connectivity analyses because smoothing may artificially influence individual differences in this prediction analysis (Triana et al. 2020). After preprocessing, the unsmoothed images were denoised using the anatomical component-based correction (aCompCor) method. This procedure removes potential confounding effects, including signals from WM, cerebrospinal fluid (CSF), and 12 movement parameters (3 rotations, 3 translations, and 6 first-order temporal derivatives). Importantly, to focus on intrinsic fluctuations in functional connectivity and avoid ambiguous inferences, we also removed the trial-evoked signal (by convolving a boxcar model for all task events with canonical hemodynamic response function plus first and second derivatives; Cole et al. 2019; Goldfarb et al. 2020). We did not apply linear detrending to the time courses because previous research (Anderson and Hulbert 2021) indicates that there exist some systematic singal changes over TNT blocks, such as conflict reduction. Temporal band-pass filtering was applied to eliminate low-frequency drift (<0.01 Hz). We did not apply global signal (GS) regression because this procedure may cause false negative correlations in terms of functional connections (Murphy and Fox 2017), and the GS, itself, may contain neural information (Wen and Liu 2016).
Seed regions
The nodes were defined using the default Harvard-Oxford atlas (Tzourio-Mazoyer et al. 2002) applied in CONN toolbox, which included cortical, subcortical, and cerebellar areas, resulting in the parcellation of the brain into 132 regions. For each participant, the time series of each of the 132 nodes was calculated by averaging the time series of all voxels in that node. We selected both the left and right hippocampus as seed regions and then separately calculated the functional connectivity change between right or left hippocampus with other brain regions (see Section “Generalized psycho-physiological interaction (g-PPI) analysis”).
Generalized psycho-physiological interaction (g-PPI) analysis
Hippocampal seed-CPM
The regularization parameter |$\lambda$| is used to shrink the regression coefficient |$\beta$|. As this parameter increases, so does the shrinkage penalty. Within each fold of the LOOCV, an inner 5-fold cross-validation was used to obtain the optimal parameter |$\lambda$| from [2−5, 2−4…29, 210] (Cui and Gong 2018). After obtaining predicted behavioral scores for each participant, we computed the model’s performance as the Pearson correlation (rp) between participants’ observed and predicted scores. We then used a nonparametric permutation test to test the significance of the correlation coefficient (rp) by randomly shuffling participants’ observed scores and input beta matrix and then rerunning the whole LOOCV procedure. After 1,000 permutations, we obtained a null distribution of the correlation coefficient between observed and predicted scores. We computed the P-value of the true model performance by using the number of null coefficients that were greater than the true rp plus one and then dividing by 1,000. Because a leave-one-out procedure was used in current prediction analysis, the features selected in any given fold varied. To facilitate interpretation of results, in the Results section, we only describe features that appeared in every fold, which we call “consistent features.” The predictive features of the right and left hippocampus that were selected at least once and their probability of being selected are presented in Supplementary Tables S3–S6. The probability represents the percentage of folds in which the feature was identified. The contribution of each consistent feature was calculated as the mean regression coefficient across all folds.
Model stability
Head motion
We took a number of steps to deal with the known potential confound between functional connectivity and head motion (Van Dijk et al. 2012). We removed outlier scans during preprocessing and regressed out mean framewise displacement of each participant’s functional connectivity matrix. We also used partial correlations to measure the predictive power of the model.
Cross-validation strategy
Although widely used in prediction analysis (Beaty et al. 2018; Rosenberg et al. 2018; Goldfarb et al. 2020), one might be concerned with the LOOCV procedure, as its use of almost all data points may effectively reduce biases while also increasing the test-error variance (Kohavi 1995; Varoquaux et al. 2017). Given this bias-variance trade-off, we also used 10-fold and 2-fold cross-validation strategies to build the prediction model on a training dataset and test it on the test dataset. 10-fold and 2-fold cross validation procedures are similar to the LOOCV procedure, with the difference being that, in the 10-fold procedure, we randomly divided the participants into 10 groups, 9 of which were used as the training set, and the remaining 1 used as the test set. Similarly, for the 2-fold procedure, half the participants served as the training dataset, whereas the remaining half served as the test dataset. Because we randomly divided participants into different groups, the prediction performance may differ. Therefore, we repeated the 10-fold or 2-fold prediction test 100 times, and take the mean Pearson correlation between observed scores and predicted scores as the prediction performance, using 1,000 permutations to test for significance.
Brain parcellation
Brain parcellation may affect both feature selection and prediction accuracy. Therefore, after obtaining the prediction features defined using the Harvard-Oxford atlas, we then re-ran the procedure instead using the Brainnetome Atlas (Fan et al. 2016). The Brainnetome Atlas (https://www.nitrc.org/projects/bn_atlas) is a cross-validated connectional atlas consisting of 210 cortical and 36 subcortical nodes. Based on high-quality in vivo multi-modal MRI data collected over 6 years, this freely available atlas includes information on both anatomical and functional connections. This allowed us to compare whether the predictive features and predictive performance were the same across the 2 parcellation approaches.
Regression method and feature selection threshold
In the main analysis, we used ridge regression to construct a predictive model with a commonly used feature threshold of P < 0.05 (Rosenberg et al. 2018; Goldfarb et al. 2020). To further ensure that our results did not depend on specific regression methods or feature selection thresholds, we also constructed predictive models based on 4 widely used regression methods: multiple linear regression, Lasso (least absolute shrinkage and selection operator), relevance vector regression, and support vector regression—each under 5 different feature selection thresholds (0.05, 0.01, 0.005, 0.001, and 0.0005).
Results
Behavioral results
Both the SP and IP tests were used to assess the final recall percentages for targets from the 3 TNT conditions (Think, No-Think, and Baseline). Both tests measured a participant’s memory suppression ability by subtracting the recall percentage of the No-Think items from that of the Baseline items. The difference is termed SIF. We conditionalized our analysis by considering only those items for which a participant was able to demonstrate successful encoding on their last test-feedback cycle prior to embarking on the TNT phase (Benoit and Anderson 2012). Because forgetting on the SP test is thought to reflect a mix of inhibition and interference, we chose to use the IP test as a purer measure of inhibition (Anderson and Levy 2007). Consistent with previous findings and our prior reporting based on this sample of participants (Liu et al. 2021), the conditionalized IP recall of No-Think items (M = 45.47%, standard deviation, SD = 15.73%) was significantly lower than the recall percentage of Baseline (M = 54.75%, SD = 18.25%), yielding a reliable SIF effect (M = 9.25%, SD = 19.98%, 1-tailed, t133 = 5.36, P = 1.8e − 07, see Table 1).
The recall percentages observed on the SP and the IP tests.
| Condition | Think | No-Think | Baseline |
|---|---|---|---|
| SP test | |||
| Conditionalized | 92% [90 94] | 83% [80 86] | 89% [87 91] |
| Unconditionalized | 81% [79 84] | 72% [68 75] | 76% [73 79] |
| IP test | |||
| Conditionalized | 43% [40 46] | 46% [43 48] | 55% [52 58] |
| Unconditionalized | 39% [36 41] | 40% [37 42] | 47% [44 50] |
Conditionalized data refer to final recall scores, restricted to items that were demonstrably learned during study; unconditionalized data include all items. Values in brackets represent the 95% confidence intervals for the marginal means.
Prediction of memory suppression ability
We applied seed-CPM to test whether and how memory suppression ability (operationalized as SIF) on the final test was predicted by suppression-related hippocampal functional connectivity changes. We separately ran the predictive analysis on the left and right hippocampus. By computing the Pearson correlation between predicted and observed scores, we found that, compared with the Think condition, the functional connectivity change associated with the right hippocampus during the No-Think task significantly predicted memory suppression ability (r = 0.36, P = 0.005, see Fig. 1a). We then divided the general predictive network into positive and negative networks. Only the negative network predicted participants’ memory suppression ability (positive network: r = 0.14, P = 0.180; negative network: r = 0.35, P = 0.004, see Fig. 1b and c). For the left hippocampus, we found that the functional connectivity change did not reliably predict subjects’ memory suppression ability (r = 0.21, P = 0.084, see Fig. 2a). After we divided the general predictive network into positive and negative networks, the positive networks failed to predict memory suppression ability and the predictive power was marginal in the negative network (positive network: r = − 0.05, P = 0.713; negative network: r = 0.22, P = 0.053, see Fig. 2b and c). The P-values presented here were all obtained following 1,000 permutation tests. In order to further facilitate the interpretation of the results, we mainly focused on the features that were selected in each and every fold—what we called “consistent” features (Greene et al. 2020; Rutherford et al. 2020; Yang et al. 2021). The predictive features of the right and left hippocampus that were selected at least once and their probability of being selected are presented in Supplementary Tables S3–S6. The consistent right hippocampal negative network revealed that decreased functional connectivity during No-Think trials between the right hippocampus and bilateral intracalcarine cortex, right cuneal cortex, left lingual gyrus, right supracalcarine cortex, right occipital pole, left accumbens, and bran-stem predicted higher memory suppression ability (see Fig. 1d). Among these features, left accumbens had the largest weight (see Table 2). The selected negative features had a certain pattern in spatial distribution, in which 75% of the negative features (6/8) were located in the visual cortex, including Brodmann areas 17 and 18. For the left hippocampus, the consistent negative network revealed that decreased functional connectivity during No-Think trials between the and left intracalcarine cortex, left lingual gyrus, right supracalcarine cortex, and bilateral accumbens predicted higher memory suppression ability (see Fig. 2d). Among these features, the left accumbens had the largest weight (see Table 3).
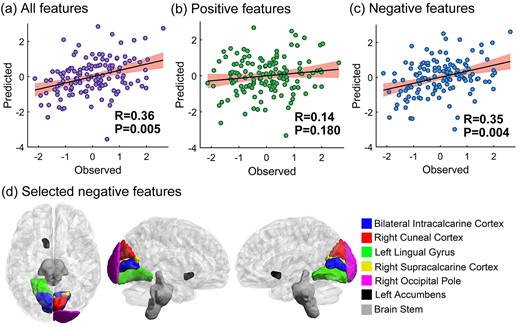
Right hippocampal functional connectivity changes predict SIF. The P-values here were obtained following 1,000 permutation tests. a) The predictive performance of all selected features; b) the predictive performance of positive selected features; c) the predictive performance of negative selected features; d) the highlighted negative features exist consistently in every cross-validation fold. The brain visualization was generated using BrainNet Viewer (Xia et al. 2013). In the scatter plots, the X-axes represent the Z-normalized memory suppression ability, calculated as the recall percentage of the Baseline condition minus the No-Think condition on the conditionalized IP test and the Y-axes represent the Z-normalized predicted score. The shaded area in the scatter plots represent the 95% confidence interval.
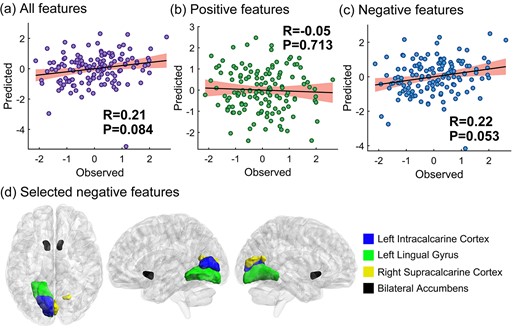
Left hippocampal functional connectivity changes predict SIF. The P-values here were obtained following 1,000 permutation tests. a) the predictive performance of all selected features; b) the predictive performance of positive selected features; c) the predictive performance of negative selected features; d) the highlighted negative features exist consistently in every cross-validation folds. The brain visualization was generated using BrainNet Viewer (Xia et al. 2013). In the scatter plots, the X-axes represent the Z-normalized memory suppression ability, calculated as the recall percentage of the Baseline condition minus the No-Think condition on the conditionalized IP test, and the Y-axes represent the Z-normalized predicted score. The shaded area in the scatter plots represent the 95% confidence interval.
The prediction weight of consistent negative features of right hippocampus.
| Regions | Prediction weight |
|---|---|
| Left intracalcarine cortex | −0.1305 |
| Right intracalcarine cortex | −0.0397 |
| Right cuneal cortex | −0.0280 |
| Left lingual gyrus | −0.0111 |
| Right supracalcarine cortex | −0.0465 |
| Right occipital pole | −0.0809 |
| Left accumbens | −0.1692 |
| Brain stem | −0.1019 |
The prediction weight of consistent negative features of left hippocampus.
| Regions | Prediction weight |
|---|---|
| Left intracalcarine cortex | −0.0423 |
| Left lingual gyrus | −0.0463 |
| Right supracalcarine cortex | −0.0736 |
| Right accumbens | −0.0622 |
| Left accumbens | −0.0970 |
| Regions | Prediction weight |
|---|---|
| Left intracalcarine cortex | −0.0423 |
| Left lingual gyrus | −0.0463 |
| Right supracalcarine cortex | −0.0736 |
| Right accumbens | −0.0622 |
| Left accumbens | −0.0970 |
The stability of the prediction model
Head motion
We applied several methods to confirm that the prediction analysis was not confounded by head motion. First, head motion, calculated as the mean frame-to-frame displacement (mean FD), did not correlate with memory suppression ability (r = 0.01, P = 0.897). Second, we measured the model performance by comparing the predicted scores with observed scores using partial correlations. After controlling for head motion, the prediction remained largely unchanged (Right hippocampus: all predictive features: r = 0.36, P = 0.005, positive predictive features: r = 0.14, P = 0.178, and negative predictive features: r = 0.35, P = 0.004. Left hippocampus: all predictive features: r = 0.21, P = 0.088, positive predictive features: r = −0.05, P = 0.715, and negative predictive features: r = 0.22, P = 0.057).
Cross-validation strategies
The LOOCV procedure we used in the above analyses may effectively reduce bias while also increasing variance of prediction error. Therefore, we also applied 10-fold and 2-fold cross-validation strategies to verify the stability of the results. For the right hippocampus, the predictive power of all features and negative features remained significant using the 10-fold and 2-fold approaches, despite some expected numeric weakening of the correlation coefficients compared with our primary approach (see Fig. 3). The 10-fold approach revealed the following: all predictive features: r = 0.32, P = 0.005; positive predictive features: r = 0.07, P = 0.281; and negative predictive features: r = 0.32, P = 0.004. The 2-fold approach revealed the following: all predictive features: r = 0.27, P = 0.004; positive predictive features: r = 0.06, P = 0.221; and negative predictive features: r = 0.28, P = 0.004. For the left hippocampus, the functional connectivity change associated with the left hippocampus failed to predict memory suppression ability using the 10-fold and 2-fold approaches. The 10-fold approach revealed the following: all predictive features: r = 0.10, P = 0.224; positive predictive features: r = − 0.07, P = 0.825; and negative predictive features: r = 0.16, P = 0.088. The 2-fold approach revealed the following: all predictive features: r = 0.04, P = 0.315; positive predictive features: r = − 0.03, P = 0.684; and negative predictive features: r = 0.08, P = 0.182. Again, the P-values presented here were all obtained following 1,000 permutation tests.
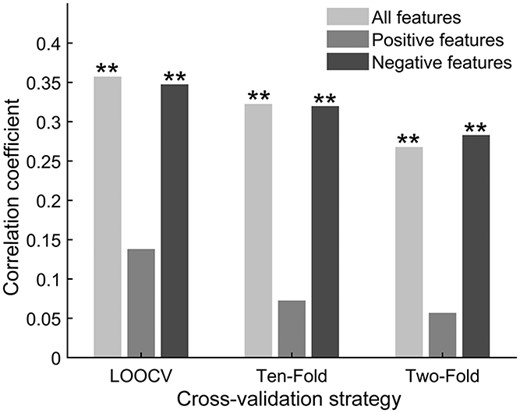
The prediction performance of right hippocampus based on different cross-validation strategies. The P-values here were obtained following 1,000 permutation tests. ** represents P < 0.01; LOOCV: leave-one-out cross validation.
Brain parcellation
In the foregoing analyses, we defined the nodes using the Harvard-Oxford atlas. However, the particulars of the chosen brain parcellation may affect prediction accuracy. Therefore, we applied a different brain parcellation and reran the prediction analyses to determine if the results generalized. The procedure we followed was otherwise the same as defined previously. The results again revealed that the negative features of right hippocampus reliably predicted participants’ memory suppression abilities (r = 0.30, P = 0.018; see Fig. 4a). Notably, the negative right hippocampal predictive features based on the 2 parcellation approaches largely overlapped in space, namely the lingual gyrus, cuneus gyrus, and left nucleus accumbens (see Fig. 4b). For the left hippocampus, the negative features failed to predicted subjects’ memory suppression abilities (r = 0.10, P = 0.265).
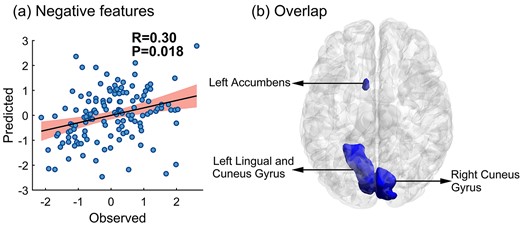
The P-value here was obtained following 1,000 permutation tests. a) The prediction performance of right hippocampal negative features based on the Brainnetome atlas; b) brain map highlighting the right hippocampus consistent negative features that overlapped across the 2 parcellation approaches (colored in blue); visualization generated with BrainNet Viewer (Xia et al. 2013). In the scatter plot, the X-axis represent the Z-normalized memory suppression ability, calculated as the recall percentage of the Baseline condition minus the No-Think condition on the conditionalized IP test, and the Y-axis represents the Z-normalized predicted score. The shaded area in the scatter plot represents the 95% confidence interval.
Regression methods and feature selection thresholds
In our primary analyses, ridge regression was used to build the prediction model under the feature selection threshold of 0.05. For validation purposes, we also applied different regression approaches and feature selection thresholds to verify that our right hippocampal results did not depend on any particular regression method or feature selection threshold (see Fig. 5). The results show that different regression methods or feature selection thresholds all produced similar prediction results for right hippocampus. The selected consistent features at different thresholds for right hippocampus are shown in the Supplementary Table S1.
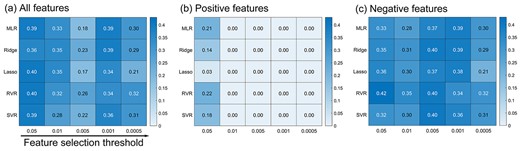
The prediction performance of right hippocampus based on different regression methods. The numbers in the heat map represent the Pearson correlation coefficient between predicted score and observed score. MLR: multiple linear regression; Ridge: ridge regression; Lasso: least absolute shrinkage and selection operator; RVR: relevance vector regression; and SVR: support vector regression.
Multiple comparisons correction
In the main analysis, we used the left and right hippocampus as nodes and used all the features (both positive and negative) to predict a participant’s memory suppression ability. In other words, 6 (2*3 = 6) models were trained and tested using LOOCV for each subject. Even if we treated the left and right hippocampus as independent regions and used a strict Bonferroni correction (0.05/6 = 0.0083), the primary results of the prediction model built on all or on just the negative features of the right hippocampus remained significant.
Discussion
By adopting a g-PPI and seed-CPM analysis approach to neuroimaging data from a large sample of participants engaged in memory suppression, we found that the change in functional connectivity of the right hippocampus during memory suppression predicted participants’ forgetting of suppressed memories on a later recall test. Specifically, decreased functional connectivity of the right hippocampus with visual cortical areas (bilateral intracalcarine cortex, right cuneal cortex, left lingual gyrus, right supracalcarine cortex, and right occipital pole), left accumbens and the brain-stem predicted superior forgetting ability for suppressed items and formed the negative predictive network. Through several validation tests, we showed that these negative right hippocampal networks were stable across different cross-validation methods, different feature selection thresholds and different regression approaches and did not arise artifactually from head motion. Furthermore, most of the right hippocampal negative features generalized to a different parcellation atlas. Taken together, these results broaden our view of the hippocampus’s role in suppression, moving beyond the simple observation that hippocampal deactivations and negative prefrontal-hippocampal coupling underpin this process (for a recent review, see Anderson and Hulbert 2021). Our results provide additional support for the notion that, in addition to direct disruption of hippocampally dependent mnemonic processes (for evidence of this, see Hulbert et al. 2016), attempts to stop unwanted memory retrieval depend on reduced communication between the hippocampus and visual cortex.
Many studies have found that memory suppression decreases hippocampal activation (Anderson and Hulbert 2021). Effective connectivity analyses further revealed that reduced activation of these regions is caused in part by top-down control by MFG (Benoit and Anderson 2012; Benoit et al. 2015, 2016; Gagnepain et al. 2017; Apšvalka et al. 2022). But most research focuses on a few selected ROIs, such as the right MFG as the source of modulation (Paz-Alonso et al. 2013; Xie et al. 2020; Yang et al. 2020) and the hippocampus as the target of downregulation. However, successful retrieval depends on extensive communication between the hippocampus and many brain regions, including the sensory cortex (Treves and Rolls 1994; Sutherland and McNaughton 2000; Schott et al. 2013). Although several studies have documented how suppression affects cortical regions outside the hippocampus that represent the domain-specific content of the to-be-suppressed event (e.g. Gagnepain et al. 2014, 2017; Benoit et al. 2015), we are not aware of any studies (other than the present one) that have characterized how suppression alters functional connectivity between the hippocampus and cortical regions involved in recollection, in a manner linked to forgetting. In the present study, we used g-PPI (functional connectivity) and seed-CPM (prediction analysis) to demonstrate that decreased functional connectivity between the right hippocampus and the visual cortex predicts successful forgetting. In addition, we found that hippocampal connectivity with other brain regions, such as the nucleus accumbens, predicts memory suppression ability. Previous research shows that, compared with the Think condition, the posterior cortex exhibits a large area of reduced activation during memory suppression, mainly located in the cuneus and the lingual gyrus (Levy and Anderson 2012; Benoit et al. 2016; Gagnepain et al. 2017; Hu et al. 2017; Yang et al. 2020). Our study shows the same pattern: activation is suppressed during the No-Think condition compared with Think-condition in the cuneus and lingual gyrus, along with the right hippocampus (see Supplementary Table S2 and Supplementary Fig. S1). According to a prominent neural model of memory suppression (Anderson et al. 2004; Depue et al. 2007; Depue 2012; Benoit et al.,2015; Hu et al. 2017; Anderson et al. 2016; Anderson and Hulbert 2021), the prefrontal cortex can be recruited to inhibit memory representations at the level of the hippocampal convergence zone, which brings together different aspects of the unwanted memory, and/or at the level of the different sensory and emotional aspects of those memories, which might include the visual cortex (Rolls 2013). Adding to this, our results demonstrate that deactivations found in other memory-related regions linked to the hippocampus may not be independent of one another. Indeed, we found that the functional connectivity between these other regions also decreases in a manner that may effectively predict subjects’ later forgetting of the suppressed content. Such work invites future investigations exploring how memory suppression influences the interaction between the hippocampus and other brain regions that contribute to different forms of memory representation.
Of the negative features we identified, the decreased functional connectivity between the right hippocampus and the lingual gyrus and with the cuneus gyrus were the most prominent and stable. Both regions send and receive projections to the medial temporal lobes via the inferior longitudinal fasciculus, as demonstrated by diffusion tractography and postmortem dissection (Palejwala et al. 2021), suggesting a role in memory. Consistent with this possibility, both structural and functional magnetic resonance imaging findings suggest that these components of the ventral visual stream play a role in recollection. For example, greater cortical thickness/gray matter volume in the lingual gyrus predicts better long-term free recall across the lifespan (Walhovd et al. 2006; Kalpouzos et al. 2009). In fMRI studies, the lingual gyrus also shows greater univariate activation during episodic retrieval than during encoding (Robinson-Long et al. 2009). Variations in signal within the lingual gyrus predict the vividness with which a person can mentally replay a video during episodic retrieval (St-Laurent et al. 2014) and the level of perceptual detail that can be reinstated from previously encoded pictures (McDonough et al. 2014). Wing et al. (2015) found that only the anterior hippocampus and lingual gyrus showed univariate activity at encoding that predicted the degree of item-specific encoding/retrieval match in multivariate analyses, suggesting they helped to establish a recallable and vivid episodic trace. Strikingly, the role of the lingual gyrus may not be restricted to voluntary retrieval but may also extend to involuntary intrusions of unwelcome memories: greater cortical thickness in lingual gyrus predicts participants’ propensity to experience involuntary intrusions during the week after exposure to a traumatic film clip (Gvozdanovic et al. 2020). Collectively, these findings suggest that the visual cortical regions such as the lingual and cuneal gyri contribute to the formation and retrieval of perceptually vivid experiences, as might arise during intrusive memories of trauma. Given these observations, suppressing the retrieval of an intrusive memory might achieve forgetting, in part, by disrupting hippocampal-lingual connectivity that would otherwise support retrieval. Alternatively, retrieval suppression may target both hippocampal and visual cortical activity, and this parallel modulation may be reflected by reduced connectivity (Gagnepain et al. 2014). Notably, previous studies have reported deactivations within the visual cortex when words were the targets of memory suppression, as they were in this study, as well as when the memoranda were pictorial (Depue et al. 2007; Levy and Anderson 2012; Gagnepain et al. 2014, 2017; Benoit et al. 2015; Sacchet et al. 2017; Yang et al. 2020). Given that the visual cortex may be involved in the representation of both types of materials, our finding of decreased hippocampus-visual cortex connectivity predicting superior memory suppression ability may similarly generalize (though this speculation needs to be substantiated by future research).
We also found that decreased functional connectivity between the right hippocampus and left nucleus accumbens predicted superior SIF. Although retrieval suppression has been found to engage the caudate nucleus and the putamen (Guo et al. 2018), no study has specifically hypothesized a role of the nucleus accumbens in memory suppression. Why this pattern of connectivity predicts SIF is unclear. Because the anatomical projections linking these structures are unidirectional from the hippocampus to the accumbens (Thierry et al. 2000; Floresco 2015), it is unlikely that the accumbens could exert an inhibitory impact on hippocampal memory traces to induce forgetting. On the other hand, the nucleus accumbens participates in a network of regions that supports the avoidance of threat, including both active avoidance (taking an action to avoid a threat) and inhibitory avoidance (withholding an action to avoid a threat; e.g. Levita et al. 2012; Piantadosi et al. 2018). Interestingly, in human imaging studies, inhibitory avoidance (e.g. given a warning cue preceding the appearance of an unpleasant image, withholding a keypress response to prevent the image from appearing) downregulates blood oxygen level-dependent (BOLD) signal in the accumbens, with increasing downregulation predicting state anxiety (Levita et al. 2012). Because retrieval suppression can be viewed as a form of inhibitory avoidance in which the threat originates from memory, rather than perception, and in which the response is to stop retrieval rather than motor action, the current findings may constitute another example of this intriguing phenomenon. If so, our findings link this form of inhibitory avoidance to later forgetting and to the suppression of hippocampal activity. One simple account of both phenomena is that both retrieval stopping and Levita et al.’s inhibitory avoidance paradigm may lead people to suppress hippocampal activity to prevent recollection of the unwelcome content, disrupting the hippocampus’s connectivity with the nucleus acumbens.
Our demonstration that suppression-induced hippocampal functional connectivity changes could predict participants’ later forgetting is novel in that previous research only achieved this type of prediction using resting-state connectivity of the frontoparietal control networks (Yang et al. 2021). The current findings complement those earlier results. Compared with functional connectivity change induced by a task, resting-state functional connectivity tends to be more stable across tasks, and is thus more suitable for predicting individuals’ general competencies (Gratton et al. 2018). However, people face many different tasks in daily life, making it important to dynamically tailor the state of the interconnected brain networks to perform the particular task at hand. Functional connectivity change is more appropriate to predict these dynamic task-related shifts that are missed by resting-state analysis. Previous studies have shown that the human brain has an “intrinsic functional network architecture” (Cole et al. 2014) and the functional network is highly similar in different tasks across subjects (Cole et al. 2014; Krienen et al. 2014; Gratton et al. 2016). Indeed, in the present study, we found that the group-averaged hippocampal functional connectivity was highly similar between the No-Think and Think conditions (right hippocampus: r = 0.90 and left hippocampus: r = 0.90). Gratton et al. (2018) further demonstrated that the intrinsic functional network changes induced by the task are relatively small (~5%). Our results indicate that, although task-induced changes were small, they also related to participants’ cognitive performance. Using functional connectivity change to predict participants’ performance and mental states is a new and promising method. Previous studies have used this method to predict levels of stress from the hippocampal connectivity network and compared this method with others (Goldfarb et al. 2020; Greene et al. 2020). The use of seed-CPM could also allow researchers to better focus on key brain areas and facilitate the discovery of novel networks involved in a task (Goldfarb et al. 2020).
In conclusion, we used machine learning to reveal how the hippocampus communicates functionally with the rest of the brain during memory suppression and in a manner that predicts behavior on a later memory test. Overall, our results suggest that active suppression yields forgetting through decreases in the functional connectivity between the right hippocampus with visual cortex (lingual gyrus and cuneus gyrus) and nucleus acumbens. The identified hippocampal networks provide insight into neurobiological mechanisms supporting active forgetting, which could, in turn, have profound implications for mental disorders characterized by intrusive memories.
Acknowledgments
We would like to thank Ana Catarino (University of Cambridge) for training on TNT data collection.
Funding
This research was supported by the National Natural Science Foundation of China (31600878,32271112), the 13th 5-years plan of national sciences of education sciences, Young Teachers Research Program of the Ministry of Education (EBA200393), the Natural Science Foundation of Chongqing (cstc2021jcyj-msxmX1138), and a Medical Research Council grant (MC-A060-5PR00) to MCA.
Conflict of interest statement
The authors declare no conflicts of interest.
Data/code availability
The code used for predictive analysis and permutation testing are available at: https://github.com/YuchiYannn/tnt_FCchanges. Due to the relevant regulations imposed by the administering institution on human subject image data, the data in this study are only available from the authors upon request. Re-analysis of the data requires formal sharing agreement and also approval from Academic Committees of Southwest University and Chongqing Medical University in China.