


Abstract
Selective attention is thought to involve target enhancement and distractor inhibition processes. Here, we recorded simultaneous electroencephalographic (EEG) and functional near-infrared spectroscopy (fNIRS) data from human adults when they were pre-cued by the visual field of coming target, distractor, or both of them. From the EEG data, we found alpha power relatively decreased contralaterally to the to-be-attended target, as reflected by the positive-going alpha modulation index. Late alpha power relatively increased contralaterally to the to-be-suppressed distractor, as reflected by the negative-going alpha modulation index. From the fNIRS data, we found enhancements of hemodynamic activity over the contralateral hemisphere in response to both the target and the distractor anticipation but within nonoverlapping posterior brain regions. More importantly, we described the specific neurovascular modulation between alpha power and oxygenated hemoglobin signal, which showed a positive coupling effect during target anticipation and a negative coupling effect during distractor anticipation. Such flexible neurovascular couplings between EEG oscillation and hemodynamic activity seem to play an essential role in the final behavioral outcomes. These results provide unique neurovascular evidence for the dissociation of the mechanisms of target enhancement and distractor inhibition. Individual behavioral differences can be related to individual differences in neurovascular coupling.
Introduction
Our world is full of sensory information, but our ability to process and act on this information is fundamentally limited. Selective attention is an essential cognitive ability used to filter information by boosting stimuli that are most relevant to our current goals and ignoring behaviorally irrelevant input. A modulation of alpha-band (8–12 Hz) power over the posterior cortex is a robust oscillatory correlate of selective attention (Foxe and Snyder 2011). The increases in alpha power index functional inhibition and decreases in alpha power reflect reductions in inhibition–enhancement (Rihs et al. 2007; van Dijk et al. 2008; Antonov et al. 2020; Gundlach et al. 2020). Such a pattern implies that distractor suppression is the inverse of target facilitation. It seems that a common electrophysiological mechanism is responsible for both selecting task-relevant and suppressing task-irrelevant information. However, recent studies suggest that target facilitation and distractor inhibition are not merely 2 aspects of attention but are controlled by distinct cognitive mechanisms (Capilla et al. 2014; van Moorselaar and Slagter 2019; Moorselaar and Slagter 2020). Some ERP studies have shown that distractor inhibition is not governed by the same attention process as target facilitation by revealing a functional dissociation between the P1 and N1 event-related potential (ERP) components (Couperus and Mangun 2010; Noonan et al. 2016). Wöstmann et al. (2019) demonstrated that the mechanism of target selection is independent of distractor suppression by linking 2 sign-reversed lateralized alpha responses, which are independent of each other in distinct underlying neural networks. Some research suggests that the time course of the target facilitation is earlier than the sustained suppression of distractors from the oscillatory nature of ongoing electroencephalographies (EEGs) during cued shifts of feature-selective attention (Andersen and Muller 2010).
In addition to electrophysiological studies, neuroimaging studies have shown enhanced hemodynamic activity in areas contralateral to the attended target location, and this hemodynamic lateralization reflects the allocation of spatial attention (Huang et al. 2015; Liu et al. 2016). However, the expectation of a distractor also increases hemodynamic activity in the occipital cortex contralateral to the distractor, rather than decreasing hemodynamic activity in anticipation of distracting input (Serences et al. 2004; Ruff and Driver 2006). Moreover, target enhancement and distractor inhibition have been found to modulate distinct cortical sites: the dorsal network responds to cues to shifting target position, and the ventral network shows stronger activation levels in response to distractor interference (Corbetta and Shulman 2002; Corbetta et al. 2008).
Recent studies have shown that neurovascular coupling effects play an essential role in selective attention processing in adults (Heinze et al. 1994; Pfurtscheller et al. 2012) and infants (Roche-Labarbe et al. 2007). Classically, low alpha power has been considered as a key signature of enhanced hemodynamic activity, which was supported by negative correlations between alpha power and blood oxygen level–dependent in the lateral frontal and parietal cortices during the resting state (Laufs et al. 2003; Laufs et al. 2006) and during the task state (Liu et al. 2016). Interestingly, positive alpha-related neurovascular coupling was also found during the resting state (Laufs et al. 2003; Moosmann et al. 2003) and during the task state (Mayhew and Bagshaw 2017). Moreover, an enhanced preparatory oxygenated hemoglobin (HbO) response over the visual cortex contralateral to an upcoming target was positively coupled with subsequent target-related ERPs but negatively coupled with distractor-related ERPs (Huang et al. 2015).
Although the hemispheric lateralization of the alpha and hemodynamic activity during anticipation has been proven to be a highly robust phenomenon, it has not been clearly demonstrated the mechanisms of neurovascular coupling between EEG oscillation and hemodynamic activity in preparing for target enhancement and distractor inhibition. Here, we recorded simultaneous functional near-infrared spectroscopy (fNIRS)–EEG data from human adults when they performed a cued visual–spatial attention task. Participants were provided foreknowledge about the visual field of the coming target (T-only), distractor (D-only), or both (T + D) via a pair of colored arrow cues (see Fig. 1A). This method provided an accessible way to investigate the electrophysiological and hemodynamic features as well as their neurovascular coupling responsible for anticipatory selective attention.
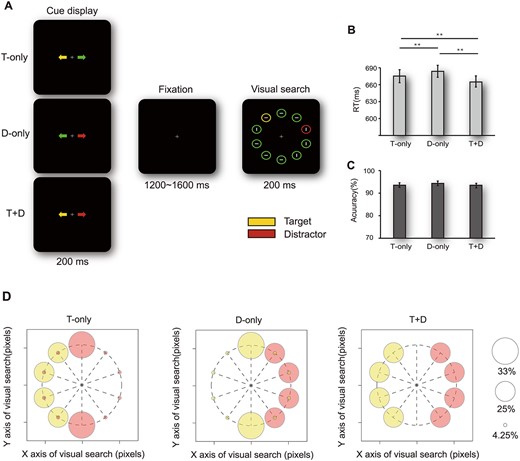
Task schematic and behavioral results. (A) Illustration of the sequence of events within a trial. The cue display was fully predictive (with 100% validity) of the side on which the subsequent target or distractor would appear (yellow represents the target; red represents the distractor; green has no meaning). Participants were required to identify the orientation of the gray line (horizontal or vertical) inside the yellow target circle. Right panels show performance in terms of RTs (B) and accuracy (C) for the 3 different cueing trials. Error bars indicate ±1 standard error of mean (SEM). **indicates P < 0.010. The abbreviated letters indicate the 3 cue display configurations as follows: T-only, target side-cued; D-only, distractor side-cued; T + D, spatial information provided for both target and distractor sides. The 3 cues were randomized within each block. (D) The spatial probability of target and distractor occurring during subsequent visual search with respect to 3 cue trials.
Materials and Methods
Participants
Fifty-two adult participants performed the cue covert spatial task twice in 2 days. Ten of the original participants were excluded for one of the following reasons: (1) difficulties in following task instructions (2 participants) and (2) excessive body or eye movements (8 participants). Data from the remaining 42 participants [mean age = 23.45 years, standard deviation (SD) = 3.40, 19 males] were used for the full analysis. All had normal, corrected-to-normal vision, and normal color vision and gave informed consent to participate in this study as approved by the Beijing Normal University Institutional Review Board.
Behavioral Procedure
Stimuli were presented on a 21-inch gamma linearized (Cathode Ray Tube) monitor with a resolution of 1920 by 1080 pixels and a refresh rate of 60 Hz with black background (0.5 cd/m2) at a distance of 57 cm. In the beginning, a fixation appeared and remained visible throughout the trial. Two colored arrows (0.1° × 0.5°) cues were briefly (200 ms) presented centered 3.0° to the left and right of the fixation. The cue-to-target interval was randomly designated as a value between 1200 and 1600 ms. Then, each visual search array consisted of 10 unfilled circles presented for 200 ms (13.5 cd/m2 mean optical luminance, and 3.4° × 3.4°, 0.3° thick outline) from the imaginary ring with a 9.2° radius (see Fig. 1A). Among the circles, a yellow circle (target) was simultaneously presented with a red circle (distractor). Their locations were predicted by 3 cue display configurations as follows (Fig. 1): For T-only cueing trials, only the yellow arrow (pointing to the left or right) predicted that the yellow target circle would appear randomly on one lateral location of the cued side with equal probability (25% on each lateral location). Even though the opposite green arrow had no predictive value regarding the distractor circle, the distractor circle was systematically present more often in 2 midline locations (33% at each midline location) than in all other lateral locations (4.25% at each lateral location). For D-only cueing trials, only the red arrow predicted that the red distractor circle would appear randomly on one lateral location of the cued side with equal probability (25% on each lateral location). Even though the opposite green arrow had no predictive value regarding the target circle, the location of a yellow target circle was pseudorandomized by specifying the unequal spatial probability of the midline target (33% on each midline location) and lateral target (4.25% on each lateral location). For T + D cueing trials, the yellow arrow was fully predictive of the side on which the yellow target circle would subsequently appear (25% on each lateral location), whereas the opposite red arrow was predictive of the opposite side on which the red distractor circle would simultaneously appear (25% on each lateral location). The yellow circle (target) location was always lateral, with the distractor on the opposite side.
Regardless of cue type (T-only or D-only), the following target circle would appear with equal probability to the same distractor side or opposite distractor side so that subjects could not infer anything about the target circle from the distractor cueing trials. Participants were instructed to maintain their gaze upon the fixation, allocate their attention based on a variable cue, and search for one yellow circle (target), but to ignore other items including the red circle (distractor), and indicate whether the line segment inside the target was vertical or horizontal by pressing 1 of 2 buttons with their right hand as quickly as possible. The experiment contained 20 blocks (i.e., 60 trials per block) per participant. All conditions were randomized within each block. Each experiment lasted approximately 45 min.
EEG Recording and Analysis
EEG data were acquired using Scan 4.5 package (NeuroScan, Inc.) and a SynAmps EEG amplifier from an EEG cap with 32 silver chloride electrodes mounted on an elastic cap (Greentek Pty. Ltd). The EEG data were in accord with the international 10–20 system. To detect eye movements and blinks, we also recorded horizontal and vertical electrooculograms (EOGs) with 2 electrodes placed at the canthi of both eyes (horizontal EOG) and above and below the right eye (vertical EOG). All electrodes, except for those monitoring eye movements, were physically referenced to the left mastoid and were then re-referenced offline to the average of the left and right mastoids. The signal was bandpass filtered at DC to 200 Hz and digitized at a sampling rate of 1000 Hz. Skin/electrode impedance was maintained below 5 kΩ and then offline filtered with a digital bandpass of 0.1 Hz–40 Hz (6 dB/octave roll-off, FIR filter).
For offline data analysis, the EEGLAB toolbox, as well as custom MATLAB scripts (The MathWorks, Natick, MA), were used. First, data were epoched from −500 ms before to 1200 ms after cue onset. Trials were only automatically excluded if EEG activity exceeded ±100 μV in any channel during the cue–target interval. We used an independent component analysis (ICA)-based denoising approach to identify and remove eye blinks to obtain clean EEG data. On average, 12.445% of the trials were excluded from the analysis. A total of 356 (SD: 29) T-only cueing trials, 354 (SD: 28) D-only cueing trials, and 353 (SD: 28) T + D cueing trials per participant were used for further analyses. We calculated a time-varying estimate of the instantaneous alpha frequency following previously published procedures. We used the newtimef() function in EEGLAB to compute the event-related spectral perturbation from a fast Fourier transform with Hanning window tapering and applied it to the broadband signal from individual trials within each subject. The trial average was subtracted from every trial to obtain induced activity without contributions from stimulus-evoked components (Cohen and Donner 2013). This process was performed separately for each participant, for the left cue condition, and for the right cue condition.
To estimate the effects of cue-elicited attention modulation, we calculated the combined modulation index (MI) from cue-locked data in the alpha band (8 Hz–12 Hz). The MI was computed by subtracting the alpha power of right-cued trials from that of left-cued trials for the left and right parietal and occipital electrodes (left: P3, P7, O1; right: P4, P8, O2). This subtraction was subsequently normalized by dividing the value by half of the sum of these values. Then, a combined MI was calculated by subtracting the MI for the right hemisphere from that for left hemisphere. The detailed formula was as follows:
In this study, we calculated the lateralized alpha activity using combined MI instead of using the difference between contralateral and ipsilateral electrode clusters in this study. This method has been commonly used in the analysis of lateralized alpha activity (ter Huurne et al. 2013; Zumer et al. 2014; Vollebregt et al. 2015; Guo et al. 2019). Given that alpha power was somewhat asymmetric across the hemispheres (Lachat et al. 2012), and hemispheres with higher power might give extra weights to combined alpha lateralization. Thus, the individual lateralized power collapsed across attend-left and attend-right conditions were normalized to the sum of these values prior to collapsing across hemispheres. Then, the left or right MI denotes the relative change with respect to the local left or right hemisphere and the units are hundredths. This method allowed us to avoid possible bias in the analysis due to the hemisphere asymmetry.
Time windows with significant effects were identified using cluster-based permutation testing over time with cluster correction (P = 0.05 and 5000 iterations) using Filedtrip functionality (Oostenveld et al. 2011). This routine controls the type 1 error rate in a situation involving multiple comparisons over time. We further performed a jackknife-based analysis to define onset latency and offset latency (Smulders 2010). The latency was defined as the time at which the waves reached 50% area amplitude. To test for evidence of the null, Bayes factor analyses (Rouder et al. 2009) with default priors (r = 0.707) were conducted on the EEG data (BF10 = support for H1 over H0; BF10 < 0.333: substantial evidence for the null).
Optical Signal Recording and Preprocessing
Near-infrared spectroscopy (NIRS) data were collected at 10 Hz using a continuous wave system (ETG-4000, Hitachi Medical Co., Japan) with wavelengths of 830 ± 20 nm and 695 ± 20 nm. We used a 44-channel array consisting of 16 light emitters and 14 photodetectors arranged in 2 probe sets of 3 × 5 optodes. The emitters and receivers were positioned alternately in space with the 2-piece flexible rubber holders and with an interoptode distance of 30 mm. NIRS optodes were attached to the subject’s head using 2 plastic arrays of optode holders that were placed on the same elastic cap with 32 silver chloride electrodes in accordance with the international 10/20 system in such a way that they covered the bilateral occipital, parietal, and temporal cortices symmetrically. The midpoint between left channel 1 and right channel 1 corresponded to the location of Oz, and the NIRS channels near the parietal electrode positions (P7/P8 or P3/P4) were bilateral channels 5 and 6 or channels 10 and 14.
For the coregistration of fNIRS channels on participants’ cortical regions, all the measurement channels were labeled with Vitamin E capsules [bright spheres in structural magnettic resonance imaging (MRI)]. The participant was placed in the supine position in the MRI scanner with Vitamin E capsules that were accurately marked at the actual fNIRS optode and electrode locations attached to his or her head. Cortical regions below the different channels were determined according to the coregistration of fNIRS channels to Montreal Neurological Institute brain space. The measured light attenuation data were related to changes in absorption by applying the modified Beer–Lambert law. The obtained values reflected relative changes in HbO and HbR chromophores in the brain. HbO and HbR concentrations were then high-pass filtered at 0.02 Hz and low-pass filtered at 0.1 Hz to remove the high-frequency physiological noise and low-frequency baseline drifts. Additionally, an artifact rejection threshold was set to the mean concentration value at a given sampling timepoint ±2 SDs. Trials at the start and end of measurements were rejected when HbO signals were above the rejection threshold for movement artifact correction.
fNIRS Activation Analysis
Last, group-level LI of HbO responses were elicited by t-tests of the lateralization index against zero and were considered statistically significant at P < 0.050. The 2-contiguous-channel criterion (Lloyd-Fox et al. 2011; Southgate et al. 2014) was applied as an alternative to multiple comparison corrections.
Alpha-informed analysis
The trial-by-trial correlation between EEG and hemodynamic signals, as commonly performed in EEG-fMRI studies, has been widely accepted, and used to comprehensively understand neurovascular coupling effects (Debener et al. 2005; Debener et al. 2006). Unlike the correlation between lateralized alpha power and lateralized HbO at the group level, we further calculated the coupling effect at the individual level by correlating single-trial lateralized alpha power with original HbO concentration in each hemisphere. This process allowed us to explore the different roles of the left or right hemisphere. It also allowed us to explore the relationship between neurovascular coupling and behavioral performance.
For each subject, dynamic properties of brain oscillations were calculated by extracting the normalized single-trial lateralized alpha power spectrum within the range of 8–12 Hz over occipitoparietal sites where alpha showed the strongest attentional effects (Fig. 4C). The single-trial lateralized alpha power was different from the lateralization index across hemispheres. The single-trial lateralized alpha power was calculated as the alpha power contralaterally minus that ipsilateral to the target or distractor location. It was defined using the following formula (Thut et al. 2006; Liu et al. 2016) as follows.
In the subsequent coupling effect analyses, we considered that the average magnitude of alpha LI was negative in T-only trials and positive in D-only trials, and the LI of the T-only trials was inverted to render its polarity consistent relative to the LI of the D-only trials. Larger values of the above index indicated stronger lateralization of alpha. Single-trial lateralized alpha power was measured at posterior electrodes (P7/P8, P3/P4, and O1/O2). We used the mean amplitude in the timeframe 402–638 ms of 3 pairs of electrodes for T-only cueing trials and 660–816 ms for D-only cueing trials.
A similar procedure has been described in depth previously (Liu et al. 2016) but will be explained briefly here. In addition to the standard regressor modeling event sequence of cue onset timings, an EEG-based regressor was modeled in the GLM using parametric modulations and single-trial lateralized alpha power. Specifically, attentional modulation of alpha power was included in the design matrix with the onset of the boxcar function specified according to cue onset timings in attend-left and attend-right conditions. The height of each boxcar function modeling each trial within this regressor was multiplied by the single-trial lateralized alpha power (Fig. 4D left). To find coupling effects specifically related to the electrophysiological measure (the amplitude variation of the alpha power) and not to a general feature of the cue-related process, we used Schmidt–Gram orthogonalization (Eichele et al. 2005) to orthogonalize the parametric modulation with respect to regressors modeling cue-related activities as suggested previously. The effect of orthogonalization was shown on typical data (Table S1; Fig. 4D right). Two regressors were then convolved with an SPM8’s standard canonical hemodynamic response function to allow for comparisons with the recorded HbO signal (Fig. 4E). In this GLM model, the strength of coupling effects between HbO and alpha power was indicated by the resultant regression coefficients (β value) linking the alpha-informed variable. Finally, the generated maps (Fig. 4F) directly reflected the EEG-informed brain coupling effect. A schematic representation of the above alpha-informed methods is shown in Figure 4. Relevant analyses scripts are publicly available and can be downloaded at https://github.com/Chenguang918/Alpha-informed-analysis.
Results
The Effect of Cues on Performance in a Visual Search Task
For mean reaction time (RT), a one–way repeated measures analysis of variance (ANOVA) with a factor of cue type (T-only, D-only, T + D) revealed a significant main effect of cue type (F 2,82 = 23.200, P < 0.001, 2-tailed). Post hoc contrasts confirmed that RTs in the T + D cueing trials were shorter than those in the T-only cueing trials (t 41 = −6.559, P < 0.001, 2-tailed) and D-only cueing trials (t 41 = −7.008, P < 0.001, 2-tailed). Moreover, RTs in the T-only cueing trials were shorter than those in the D-only cueing trials (t 41 = −2.020, P = 0.014, 2-tailed; see Fig. 1B). These results suggested that when prior information about the side of the screen on which a yellow target circle would appear was obtained (T-only or T + D cueing trials), participants manipulated covert spatial attentional resources better than in trials in which prior information about only the distractor (D-only cueing trials) was provided. Meanwhile, participants can obtain much more benefits from prior information about the side of the screen on which a yellow target circle and a red distractor circle would simultaneously appear (T + D cueing trials) than in trials in which prior information about only the target (T-only cueing trials) was provided. We also performed behavioral analysis for 3 stimulus display configurations.
We also performed behavioral analysis for 3 stimulus display configurations. In T-only cueing trials, RTs increased monotonically (F2,82 = 15.13, P < 0.001) as the target–distractor distance decreased from far distance (opposite side) to moderate distance (midline distractor with the lateral target) to adjacent distance (same side). All differences of RTs between configurations were statistically significant (P < 0.012, 2-tailed). These results were consistent with previous studies reporting that the RT increase depended on the target–distractor distance (Gaspar and McDonald 2014) and different hemifields (Walter et al. 2013). In D-only cueing trials, participants were slower to respond to the target when it was on the same side as the distractor compared with when the target was on the opposite side (t41 = 8.565, P < 0.001, 2-tailed) or at the vertical midline (t41 = 4.430, P < 0.001, 2-tailed). All differences in behavioral accuracy (ACC) were nonsignificant (see Fig. 1C). This result may have been due to the ceiling effect of accuracy.
Alpha Band Power Is Lateralized by Anticipatory Attention
We found that the power of alpha oscillations over the hemisphere contralateral to the target or distractor decreases after the visual stimulus (cue display) presentation (see Supplementary Material for the results). This event-related desynchronization (ERD) phenomenon exhibited a stronger contralateral ERD to the target for T-only cueing trials (Fig. S1A) and weaker contralateral ERD to the distractor for D-only cueing trials (Fig. S1B). We estimated this hemispheric modulation of alpha power by calculating the alpha MI. Here, we first investigated how alpha power is modulated differently by the 3 types of cues (T-only, D-only, and T + D). Consistent with many previous studies (Worden et al. 2000; Thut et al. 2006), the amplitude of the alpha MI was increased during the 402–638 ms when the cue was predictive of the visual field of the subsequent target (T-only; Fig. 2A; permutation test: P < 0.050, 2-tailed), suggesting that the alpha power was more suppressed over the hemisphere contralateral to the cued target field (contralateral to target < ipsilateral to target). On the other hand, the alpha MI showed the opposite modulation direction during the latter 660–816 ms when the cue was predictive of the visual field of the distractor (D-only; Fig. 2B; permutation test: P < 0.050, 2-tailed). That is, the alpha power was more strongly elevated over the hemisphere contralateral to the cued distractor field (contralateral to distractor > ipsilateral to distractor). For T + D cueing, the alpha MI was positive-going, long-lasting, and included almost 2 latencies (400–810 ms) of the T-only and D-only cueing trials (Fig. 2C; permutation test: P < 0.050, 2-tailed). These data were averaged over significant time points and then over participants to create a topographic representation (Fig. 2A–C right column). The allocation of voluntary attention resulted in similar scalp distributions, but in the opposite direction: (1) The T-only cue gave rise to positive alpha MI values during earlier intervals (onset latency: 422 ± 38 ms; offset latency: 718 ± 54 ms), (2) the D-only cue gave rise to negative alpha MI values during later intervals (onset latency: 612 ± 45 ms; offset latency: 978 ± 12 ms), and (3) the T + D cue gave rise to positive alpha MI values during the long interval (onset latency: 356 ± 18 ms; offset latency: 786 ± 12 ms). It was noted that 2 sign-reversed alpha MIs represent the direction of alpha modulation and the absolute value of alpha MI denotes the deviation degree from baseline.
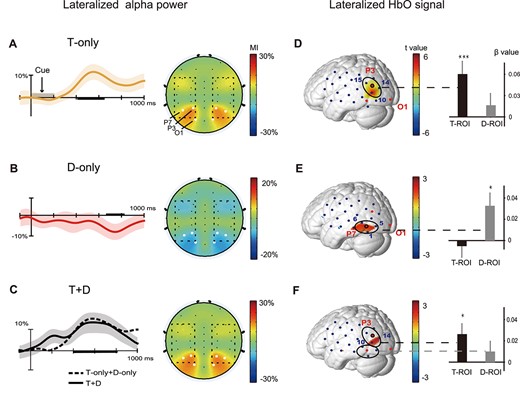
EEG and fNIRS results. Left: the grand average of alpha MI values (±SEM error bars) for a trial time window (−100 to 1000 ms) for the T-only (A) and D-only (B) and T + D cueing trials (C) across participants. The scalp topographies show opposite patterns of alpha MI and significant electrodes (white dots: P7/P8, P3/P4, O1/O2) within the posterior brain regions. The dashed square on the EEG topographies shows the scope of the fNIRS measurements. Right: the T-map shows regions with significant contralateral effects (contralateral > ipsilateral; P < 0.050) for the T-only (D), D-only (E) and T + D cueing trials (F) across participants. Note that we have shown the left view instead of the mirror-image views of lateralized HbO activity. (*P < 0.050,***P < 0.001).
Alpha MI (T + D) = Alpha MI (T-Only) + Alpha MI (D-Only)
In a recent EEG study, Wöstmann et al. (2019) decoupled auditory target selection from distractor suppression by setting the position of target and distractor stimuli in different combinations of spatial positions. That is, when the distractor was fixed in the front, alpha power relatively decreased contralaterally to the target; when the target was fixed in the front, alpha lateralization reversed direction for the suppression of distractors. Accordingly, we hypothesized that, when the visual target and distractor were presented in opposite hemifields (T + D cueing trial in our study), alpha lateralization could represent logical summation for the target/distractor: Alpha MI (T + D) = Alpha MI (T-only) + Alpha MI (D-only). To address the additivity of selection and suppression more directly, we created a “T-only + D-only” waveform and compared it with the alpha MI elicited by the T + D cueing trials. The “T-only + D-only” waveform was created in 2 steps: (1) the alpha MI wave elicited by the D-only cueing trials was inverted so as to render its polarity consistent relative to the target when the target- and distractor- arrows were on opposite sides of fixation and (2) this inverted D-only waveform was added to the T-only waveform. The resulting “T-only + D-only” MI is displayed in Figure 2C (dashed line), along with the actual alpha MI of the T + D cueing trials (solid line). The 2 MI waveforms contained remarkably similar changes during the cue–target intervals. Both the onset and offset peak latencies of the “T-only + D-only” waveform (onset latency: 412 ± 21 ms; offset latency: 780 ± 8 ms) were statistically indistinguishable (Ps > 0.050) from the peak latencies observed in the T + D trials (onset latency: 356 ± 18 ms; offset latency: 786 ± 12 ms), which was further confirmed by the Bayesian t-test (BF10 = 0.199). The mean amplitudes of the 2 peaks (402–638, 660–816 ms) were also not statistically different (Ps > 0.050), which was further confirmed by the Bayesian t-test (BF10 = 0.206). It seems that when the T + D cue informed that the coming target and distractor were presented contralateral to each other, the 2 attentional mechanisms reflected by increases in alpha power (inhibition) and decreases in alpha power (enhancement) might occur in tandem during the cue interval. The present results offer the first evidence for the alpha MI logical addition hypothesis: “alpha MI (T + D) = alpha MI (T-only) + alpha MI (D-only).”
HbOs Are Lateralized by Anticipatory Attention
We then focused on the difference in hemodynamic activity (as reflected by HbO levels) between the bilateral posterior cortexes. We quantified the lateralized modulation of HbO by quantifying the lateralization index for each pair of symmetrical channels. For T-only trials, paired t-tests showed that significant contralateral effects (contralateral to target > ipsilateral to target) were found in the visual cortex near the region between the P3/4 and P7/8 electrodes (Ch10, P < 0.001; Ch14, P = 0.028; Ch15, P = 0.021; 2-tailed, Fig. 2D). As an inverse comparison, the target ipsilateral effect was not significant. We used significant channels (Ch10, Ch14, Ch15) with contralateral effects to create functional Region of interest related to anticipatory target enhancements (T-ROI). These modulations of the HbO response for attended targets in the visual cortex are consistent with prior fMRI studies of spatial attention (Hopfinger et al. 2000) and are in agreement with previous concurrent fNIRS–EEG studies (Huang et al. 2015; Zhao et al. 2019). For D-only cueing trials, we also found a significant contralateral effect (contralateral to distractor > ipsilateral to distractor) in the visual cortex to the visual field of the distractor for D-only cueing trials. The distractor-related ROIs (D-ROIs) were defined by the T-map of distractor cueing trials (Ch1, P = 0.048; Ch5, P = 0.036; Ch6, P = 0.036, 2-tailed; Fig. 2E). Note that the lateralized modulation of hemodynamic activity evoked by distractor cueing trials was strong but had nonoverlapping regions with that in T-only cueing trials. For T + D cueing trials, the lateralized modulation of hemodynamic activity was similar to that of T-only cueing trials. We found significant target contralateral effects in the same T-ROI, which was near the region between the P3/4 and P7/8 electrodes (Ch10, P = 0.039; Ch14, P = 0.025; 2-tailed; Fig. 2F). However, we did not find any significant contralateral distractor effect in the D-ROI for the T + D cueing trials. These results suggested that hemodynamic activity might not be expected to coactivate target-related and distractor-related ROIs for T + D cueing trials.
With structural MRIs based on the corresponding anatomical landmarks, NIRS_SPM was used to project the fNIRS channels onto the cortical surface and to determine the anatomical localization of each fNIRS measurement channel. The results showed that the anatomical localization of the T-ROI and D-ROI were both in the V3 region (Table S2).
Lateralization of HbO and Alpha Activity Are Highly Correlated
As mentioned above, both the alpha power and HbO activations were lateralized during the preparation of visuospatial attention (Fig. 2). However, T-only and D-only cueing trials evoked distinct alpha modulation with opposite directions and with different time intervals as well as nonoverlapping regions of lateralized HbO activation in the visual cortex. To quantify the relationship between EEG oscillations and hemodynamic activity within 2 functional ROIs, we performed between-subject correlation analyses. Note that the average combined MI for D-only cueing trials was a negative value, and we used the opposite number of the combined MI for D-only cueing in the following correlation analyses. That is, the combined MI of the D-only cueing trial was inverted to render its polarity consistent relative to the combined MI of T-only cueing trials. The results showed that the alpha MI in T-only cueing trials was significantly and positively correlated with the lateralization index of the HbO signal from the T-ROI (Pearson’s r = 0.340, P = 0.028, 2-tailed; Fig. 3A), but no significant effects were detected in the D-ROI (Pearson’s r = 0.040, P = 0.875, 2-tailed). For D-only cueing trials, the degree of cue-induced alpha lateralization was negatively correlated with HbO lateralization in the D-ROI (Pearson’s r = −0.329, P = 0.033, 2-tailed; Fig. 3B), but no such evidence was found for the T-ROI (Pearson’s r = 0.129, P = 0.466, 2-tailed). Note that this was a negative correlation; that is, the stronger alpha lateralization for distractor anticipation was, the lower the lateralization of HbO was within the D-ROI.
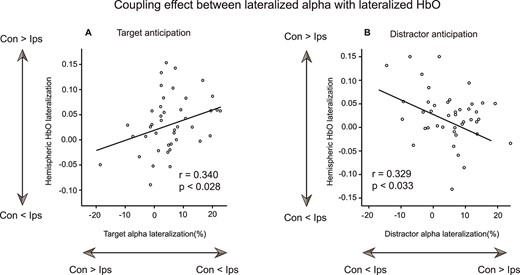
Relationship between lateralized alpha power and lateralized HbO. Scatter plot depicting the relationship between the degree of lateralized alpha power and lateralized HbO activation for the T-only cueing trial (A) and D-only cueing trials (B) across subjects. Note that we used the original number of the combined MI for T-only cueing as “Target alpha lateralization,” and we used the opposite number of the combined MI of D-only cueing trials as “Distractor alpha lateralization.” Con: Contralateral to target/distractor; Ips: Ipsilateral to target/distractor.
We further tried to determine more about the coupling effect during T + D trials by separately analyzing the time windows for target processing and distractor suppression in the same trial. The alpha MI was significant within the interval from 402 to 638 ms for the T-only cueing trial and the interval from 660 to 816 ms for the D-only cueing trial. Therefore, we averaged the alpha MI within the significant interval for target processing and correlated it with HbO lateralization from the T-ROI. No significant correlation was observed (r = 0.192, P = 0.224). Similarly, we averaged the alpha MI within the significant interval for distractor processing and correlated it with HbO lateralization from the D-ROI. No significant correlation was observed (r = 0.225, P = 0.151).
Single-Trial Coupling of Lateralized Alpha Power and Original HbO
To comprehensively understand these coupling effects and effectively link behavioral outcomes, it is necessary to extract the coupling strength of EEG information among multivariate neural signals across single trials within subjects. Unlike lateralized approaches (e.g., lateralization of the HbO) that sacrifice half of the information about channels to analyze relationships, this coupling effect can be obtained at the bilateral brain level (left or right hemisphere). We first verified whether flexible functional couplings between EEG and HbO still existed within subjects.
By using a trial-based alpha-informed analysis (see Fig. 4), we obtained the topographies of the brain coupling effect in the form of T-maps (P < 0.050, 2-tailed, Fig. 5A, B). For T-only cueing trials, the HbO concentration from the T-ROI of the left hemisphere showed a significantly positive coupling effect with lateralized posterior alpha power (left Ch10, t 41 = 2.207, P = 0.0410, 2-tailed, uncorrected; Fig. 5A, C); for D-only cueing trials, the HbO concentration from the D-ROI of the right hemisphere showed a significantly negative coupling effect with lateralized posterior alpha power (right Ch1, t41 = −2.029, P = 0.032, 2-tailed; Fig. 5B,C). We performed ANOVA with cueing type (T-only vs. D-only) and hemisphere (left vs. right) as within-subject factors and identified a marginally significant interaction effect (F1,41 = 2.343, P = 0.061, 2-tailed). For T + D cueing trials, no significant coupling effect was found at the within-subject levels. Our results support the idea that target selection was driven primarily in the left hemisphere and distractor suppression was modulated relatively more strongly in the right hemisphere (Wöstmann et al. 2019). These results provide unique neurovascular evidence for the dissociated neural generators of target enhancement and distractor inhibition.

Alpha-informed fNIRS analysis between single-trial lateralized alpha power and original HbO. EEG (blue arrows) and fNIRS (red arrow) data were recorded simultaneously (A). Subsequently, an ICA-based denoising approach was applied to identify and remove eye blinks to obtain clean EEG data (B). Dynamic properties of brain oscillations were calculated by extracting the normalized single-trial power spectrum (C). Selected points reflecting brain activity of interest can be used to obtain single-trial alpha measurements (D). After convoluting with the HRF, the single-trial amplitudes yielded EEG regressors (E). Finally, the generated correlation maps directly reflect the EEG-informed coupling effect that parametrically predicts the HbO response (F).
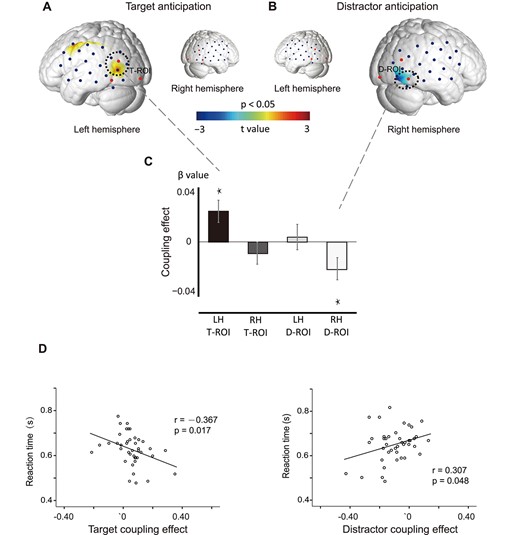
Coupling effect between lateralized alpha power and original HbO. The T-map shows positive coupling for the T-only cueing trials (A) and negative coupling for D-only cueing trials (B) within subjects. The statistical parameters are thresholded at P < 0.05. The bottom bar graphs (C) illustrate positive coupling in the left T-ROI for T-only cueing trials and a significantly inverse coupling in the right D-ROI for D-only cueing trials. (*P < 0.05). Correlation between the coupling effects and RT for the T-only cueing trials (D) and D-only cueing trials (E). Note that the cue could point to either the right or left visual field.
We then asked if the coupling effects for the T-only and D-only cueing trials predicted behavior as measured by the speed of visual search (RT). To do so, we correlated the coupling effects with RT (excluding the trials in which target and distractor were on the same side) over subjects. For T-only trials, RTs were shorter in subjects with a stronger positive coupling effect (Fig. 5D, Pearson’s r = −0.367, P = 0.017, 2-tailed). Additionally, a stronger negative coupling effect was correlated with faster RT for D-only trials (Fig. 5E, Pearson’s r = 0.307, P = 0.048, 2-tailed). These behavioral results indicate that the coupling effect both for target enhancement and for distractor inhibition can be predictive of behavioral outcome and therefore are likely to play an important role in spatial selective attention. We also analyzed the data based on ACC values and the variance of ACCs using the same methods, but no significant results were found in any of the conditions.
We further investigated whether the participants with a stronger positive coupling effect on T-only trials show a stronger negative coupling effect on D-only trials. If the individual coupling effect across the 2 conditions is not heterogeneous, the subjects who show stronger positive coupling effects, would also show stronger negative coupling effects. This outcome would result in a significant correlation between positive coupling effects on T-only trials with negative coupling effects on D-only trials. Our results did not support the above hypothesis (see Fig. S3; Pearson’s r = −0.172; P = 0.275; BF10 = 0.207). Thus, the coupling effects for target selection and distractor suppression could be considered as 2 independent neurovascular coupling processes.
Control Experiment
In the present study, purely sensory processes may contribute to asymmetric sensory input (e.g., the physical differences between the yellow arrow and the green arrow) or some specific effects for the specific colors. Two months later, we invited 8 subjects who had participated in the original experiment to test the alternative sensory explanation by exchanging the task assignment of the 2-color sets used in the above experiment. This additional control experiment was identical to the above experiment, except that participants searched for the salient red circle (target) and attempted to ignore the salient yellow circle (distractor). The control experiment replicated the results of the previous experiment and ruled out perceptual factors as a possible explanation. The alpha MI results followed a similar trend in the 3 cueing trials as well as the “alpha MI (T + D) = alpha MI (T-only) + alpha MI (D-only)” logic pattern (see Supplementary Material for the results). HbO activation determined by similar ROI analyses could extract the same functional ROI (target-related and distractor-related) as that in Figure 2 as above. Moreover, lateralized HbO values from the T-ROI were positively coupled with hemispheric alpha lateralization on T-only cueing trials. By contrast, the coupling effect between the lateralization of HbO and alpha power was negative on D-only cueing trials (see Supplementary Material for a detailed description of the results). We also analyzed the β weights of the HbR concentration by using the same methods as those used for the HbO data. Neither a significant lateralized effect nor a reliable correlation between the HbR concentration and alpha MI was found for any of the conditions.
Discussion
By using a rapid event-related protocol, we investigated the neurovascular coupling between the brain oscillations detected by EEG recordings in visual areas and adjacent hemodynamic activities recorded by simultaneous fNIRS in a cued visual–spatial attention task. The main findings were as follows: (1) From EEG signals, we extracted temporal information about brain oscillations during anticipation, that is, an early positive-going alpha MI for target anticipation, a later negative-going alpha MI for distractor anticipation, and their logical summation for target/distractor anticipation; (2) from fNIRS signals, we extracted spatial information about HbO activation for brain oscillations during anticipation and found that visual areas differed between anticipation for targets and distractors, and there are opposite functional couplings between target anticipation and distractor anticipation. That is, for the T-only cueing trials, compared with the activity in the ipsilateral occipital hemisphere to the cued visual hemifield, the more decrement of contralateral alpha power, the more increment of contralateral HbO signal. However, for the D-only cueing trials, the less increment of contralateral alpha power, the more increment of contralateral HbO signal. Moreover, the left and right hemispheres have different roles in these neurovascular coupling. Such flexible neurovascular coupling seems to play an essential role in behavioral outcomes.
In spatial distractor cueing experiments, one challenge in understanding the mechanism of distractor inhibition is the lack of directly related behavioral responses to the distractor. We could hardly verify whether the anticipation of attended distractor requires top–down attention control in our study. Thus, we performed an additional behavioral experiment in healthy adults by comparing D-only cueing trials with neutral cueing trials. Our results showed that foreknowledge of a likely distractor location contributed to faster behavioral responses, relative to neutral cueing condition (see Supplementary Material for the results). These observations are usually explained by the existence of top–down attention control, which was consistent with previous research (Ruff and Driver 2006; Chao 2010; Noonan et al. 2018).
Another challenge is that target enhancement and distractor inhibition processes usually occur almost simultaneously and strongly bind together. For auditory preparatory attention, a recent EEG study (Wöstmann et al. 2019) decouples target selection from distractor suppression by setting the position of target and distractor stimuli in different combinations of spatial positions. However, there is no strong evidence for the lateralization of visual preparatory alpha oscillation when distractors are expected. We manipulated interference by increasing distractor salience (a red circle) relative to the background interference (green circle). When participants were cued with colored arrows, the precue of a distractor (a red arrow) might have inevitably caused the participant to allocate some attention to the salient distractor because it was more salient than other items. Similar to the classic “white bear problem” (Tsal and Makovski 2006), if you were told to ignore a white bear, you could not immediately escape attraction by the distractor and should make an effort to minimize interference by the distractor relative to interference by nontargets. Accordingly, D-only cueing trials allow us to isolate a relative distractor suppression component (distractor interference vs. background interference).
Our EEG results were consistent with Wöstmann et al. (2019) in which 2 sign-reversed alpha MIs reflected target selection versus distractor suppression. We further observed that alpha modulation reflects 2 biphasic time courses: an early positive-going alpha MI for target anticipation and a later negative-going alpha MI for distractor anticipation. Interestingly, an ongoing modulation of alpha lateralization in T + D cueing trials was observed throughout the anticipation phase, suggesting that the subjects might deploy more lasting attentional resources to the cued visual field. The expectation that the target was lateral to the opposite distractor (T + D) would help participants to voluntarily separate the competition between the target selection and the active distractor inhibition before the stimulus array appeared. Therefore, we observed that alpha MI (T + D) = alpha MI (T-only) + alpha MI (D-only). This logical summation for T + D anticipation further suggests a dual mechanism of early target selection and late distractor inhibition in anticipatory selective attention.
Enhancement of the target has previously been described by a fixed top–down mechanism, which amplifies the signal strength of the target in early visual areas and propagates the signal to later areas in the visual stream (Treue and Martinez Trujillo 1999; Boudreau et al. 2006). However, distractor suppression is flexibly controlled via more than one general mechanism for preparatory inhibition, which may be specific for different strategies, dimensions, or stimuli. Here, we designed the vertical midline target more often to isolate the brain activity related to distractor anticipation during the cue period, because adults could learn statistical regularities and use them to guide their target selection and distractor suppression (Wang and Theeuwes 2018a, 2018b). The cue-induced expectation of the lateral distractor (100% probability) on D-only trials might contribute to isolating the alpha lateralization related to distractor anticipation from potential target anticipation. A recent study outlined 3 general models for preparatory inhibition consisting of direct inhibition, secondary inhibition model, and expectation suppression within a predictive coding framework (Noonan et al. 2018). The current study suggests that alpha modulation differs in the time scale—facilitation may precede inhibition. This conclusion fits well with the interpretations of secondary inhibition models, which described that top–down activation of a target-relevant representation would trigger a spread of inhibition over distractor representations. According to this model, salient distractors falling within the same receptive field compete for neural representation via secondary inhibition. We speculate that the temporal delay observed in our results might be related to the top–down signals propagating back to early visual areas with a significant delay. Future studies are needed to explore this relationship. Our finding of early enhancement of the target that precedes the suppression of the distractor by approximately 150 ms was consistent with the results of electrophysiological recordings in monkeys (Gregoriou et al. 2009) and Steady-state visually evoked potentials research in humans (Andersen and Muller 2010). Our results further suggest that participants adopt flexible strategic attention that balances between excitation and inhibition in a cued attentional task.
Previous investigations (Kincade et al. 2005; Ruff and Driver 2006) have differentiated functionally distinct neural dorsal and ventral frontoparietal networks underlying preparatory attention. Kincade’s colleagues (Corbetta et al. 2008) further identified that the ventral frontoparietal network acts as a “circuit breaker,” interrupting ongoing selection within the dorsal network. Recent research (Painter et al. 2015) further suggests that distractor suppression involves the interaction of the dorsal and ventral attentional networks by showing dorsal–ventral network communications. Our fNIRS results observed significant lateralized activity in a more dorsal region (T-ROI) during target anticipation and in a more ventral region (D-ROI) during distractor anticipation. However, unlike in the case of alpha MI, we observed activation only in target-related ROIs, rather than coactivation of target-related and distractor-related ROIs for T + D cueing trials. One possible explanation is that enhanced target-related lateralization might be accompanied by decreased lateralization within adjacent distractor-related cortices. Such a “push–pull” mechanism of selective attention in the human extrastriate cortex has been observed, in which target-related activity increased with decreasing distractor-related activity (Corbetta et al. 2008).
The precise nature of these hemodynamic responses is still under debate, and this complicates interpretation, suggesting that the hemodynamic signal reflects a combination of both excitatory and inhibitory activity (Logothetis et al. 2001; Caesar et al. 2003; Huang et al. 2015). Enhanced hemodynamic activity is usually accompanied by complex and heterogeneous biological processes, such as EEG oscillations. The most important result of the present study was the underlying link between hemodynamic activity and electrical events to obtain more useful information about the brain’s response to experimental tasks.
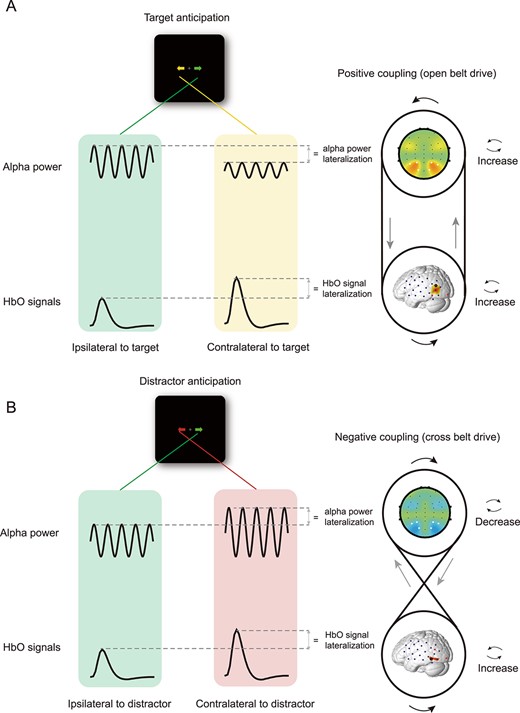
Schematic of the positive alpha-HbO coupling for T-only cueing trials (A) and negative alpha-HbO coupling for D-only cueing trials (B). Two distinct coupling mechanisms in terms of the coupling directionality between lateralized alpha power and lateralized HbO signals are identified as 2 drive systems: An open belt drive for target anticipation and a cross belt drive for distractor anticipation. The 2 systems explain how the neurovascular coupling reacts differently to the target and distractor anticipation.
We found that the degree of alpha lateralization is positively coupled with lateralized HbO signal in visual areas during target anticipation. That is, the more alpha power lateralization was, the more HbO signal lateralization responded to the attended target was (Fig. 6A for a rendering of the positive coupling pattern). Because the modulation of posterior alpha power following anticipatory cue is one robust neural marker of top–down mechanisms, which controls selective sensory input or inhibition (Rajagovindan and Ding 2011; Liu et al. 2016), we suggested the modulation of alpha power during target anticipation might reflect top–down signals to enhance the hemodynamic activity in areas contralateral to the attended target to support subsequent target-related activities. Interestingly, the alpha-HbO coupling pattern was in the opposite direction during distractor anticipation, as reflected by the fact that the degree of negative-going alpha MI was negatively correlated with HbO enhancement in the visual cortex contralateral to the anticipated distractor. That is, the less alpha power lateralization was, the more HbO signal lateralization responded to the distractor was (Fig. 6B for a rendering of the negative coupling pattern). In our study, the modulation of alpha power during distractor anticipation might be the top–down signals to diminish the hemodynamic activity in areas contralateral to the upcoming distractor in order to reserve resources to support target-related activities.
It should be noted that when the visual target and distractor were presented in opposite hemifields (T + D cueing trials), no significant alpha-HbO coupling effect was observed. This null coupling effect might be caused by the differences of rectified polarity between hemodynamic response and EEG modulations. When the target and salient distractor compete for our attention resource, it might involve the above 2 complex mechanisms: positive coupling for target anticipation and negative coupling for active distractor anticipation. Thus, it could suggest a more complicated alpha-HbO coupling exists for T + D cueing trials, which failed to measure by linear correlation analysis. Future studies are needed to clarify this issue.
Additionally, we found that the right posterior cortex plays a vital role in the neurovascular coupling of distractor inhibition, supporting the idea that the right posterior cortex is critical for successfully ignoring distractors (Mort et al. 2003; Snow and Mattingley 2006; Gillebert et al. 2011). In contrast, in the left posterior cortex, neurovascular coupling is closely linked with target enhancement. These results add to existing knowledge of hemispheric specialization, suggesting that hemispheric differences in neurovascular coupling between the target enhancement and distractor inhibition supported the complementary roles of the left and right hemispheres in selective attention. This hemispheric difference in alpha-HbO coupling further highlights the dissociation of the mechanisms of target enhancement and distractor inhibition, suggesting that the coupling effect can be characterized by substantial flexibility in its polarity and spatiotemporal variability (Yuan et al. 2010; Keles et al. 2016; Mayhew and Bagshaw 2017).
More importantly, it seems that the flexible coupling effects have an important influence on the final behavioral response. Individuals who could more efficiently benefit from the positive alpha-HbO coupling during target anticipation and take advantage of the negative alpha-HbO coupling to inhibit the coming salient but to-be-ignored distractor showed faster RTs in the subsequent visual search. That is, a higher degree of positive alpha-HbO coupling contributes to subsequent target facilitation, whereas a higher degree of negative alpha-HbO coupling contributes to the subsequent distractor suppression. However, it should be noted that the behavioral response could be modulated not only by anticipatory brain activities but also by the subsequent visual search factors. Further studies are needed to investigate how neurovascular coupling, subsequent visual processing, and their complex interaction influence the final behavioral response.
It should be noted that there is much to be done to elucidate the relationship between EEG and fNIRS signals. We are currently attempting to further investigate the relationship between anticipatory EEG/fNIRS signals and the following stimulus-elicited ERP components called the N2pc and PD (distractor positivity), which appear to reflect target selection and distractor suppression, respectively (Gaspar and McDonald 2014). Moreover, it would be important to investigate whether these alpha-HbO coupling effects can be generalized to other experimental paradigms.
In our study, lateralized metrics such as the MI were usually calculated by collapsing across the hemisphere, which means that the number of available electrodes was less than the minimal number of electrodes (>32) needed for reliable source localization. Several studies have demonstrated that this low number leads to blurring of the solution and incorrect localization (Michel et al. 2004; Michel and He 2018). To better understand underlying neurovascular coupling, the high-density EEG–fNIRS should be applied to compare EEG source distribution projected back onto the cortex with the fNIRS signals in the future.
Taken together, by performing a rapid event-related trial-by-trial coupling analysis between EEG oscillations and hemodynamic activity, our concurrent fNIRS–EEG study provides novel evidence for the mechanism of neurovascular coupling in anticipatory selective attention. Individual behavioral differences in target enhancement and distractor inhibition can be related to individual differences in neurovascular coupling between the low-frequency EEG and the nearby hemodynamic activation. Without electro-optical interference, this low-cost combination of neuroimaging modalities is insensitive to minor head movements, which makes it more feasible for natural types of cognitive tasks in a wide range of populations (e.g., from infants to older adults).
Funding
National Natural Science Foundation of China (31871099, 81771479, 81971284); the National Defense Basic Scientific Research Program of China (2018110B011); Open Research Fund of the State Key Laboratory of Cognitive Neuroscience and Learning (No. CNLZD1401).
Data Availability
The datasets that support the findings of this study are available from the corresponding authors upon reasonable request.
Notes
Conflict of Interest: None declared.
References
Foxe JJ, Snyder AC.