


Abstract
During task performance, our level of cognitive control is dynamically adjusted to task demands as reflected, for example, by the congruency sequence effect (CSE) in conflict tasks. Although brain areas related to cognitive control show protracted maturation across adolescence, previous studies found that adolescents show similar behavioral CSEs to adults. In the present study, we investigated whether there are age-related changes in the neural underpinnings of dynamic control adjustments using electroencephalography. Early adolescents (ages 12–14, N = 30) and young adults (ages 25–27, N = 29) completed a confound-minimized flanker task optimized for the detection of sequential control adjustments. The CSE was observed in midfrontal theta power thought to capture anterior cingulate cortex-mediated monitoring processes but was not modulated significantly by age. Adolescents, however, showed a smaller congruency effect in the power and cross-trial temporal consistency of midfrontal theta oscillations than adults. No age differences were observed in phase-based connectivity between midfrontal and lateral frontal regions in the theta band. These findings provide strong support for the role of midfrontal theta oscillations in conflict monitoring and reactive control and suggest that the cognitive system of early adolescents initially responds less reliably to the occurrence of conflict than that of adults.
Introduction
Cognitive control encompasses a variety of processes involved in generating and maintaining task-relevant goals and suppressing task-irrelevant goals (Gratton et al. 2018a) and is underpinned by a complex interplay of brain networks including frontal, parietal, and cingulate regions (Niendam et al. 2012; Gratton et al. 2018b). Many of these control-related regions, for example, areas of the prefrontal cortex, show protracted maturation during the adolescent period (Gogtay et al. 2004; Blakemore and Choudhury 2006; Casey et al. 2008; Ordaz et al. 2013; Crone and Steinbeis 2017). Accordingly, performance on tasks requiring cognitive control during this stage of life can still be deficient compared with adult performance (Best and Miller 2010; Shulman et al. 2016).
During performance of a task, the level of cognitive control is not static; it is thought to be adjusted dynamically to the changing demands of the task. One hallmark effect that is theorized to reflect this is the congruency sequence effect (CSE) (Gratton et al. 1992). The CSE refers to the finding that in classic conflict tasks, such as the Stroop, Simon, or flanker tasks, the difference in performance between conflicting (incongruent) trials and nonconflicting (congruent) trials is smaller following incongruent compared with congruent trials. According to the conflict monitoring theory (Botvinick et al. 2001, 2004), the CSE is the result of the upregulation of cognitive control in response to the occurrence of conflict; thus, it reflects dynamic control adjustments. This framework posits that on the neural level, the anterior cingulate cortex (ACC) is involved in the detection and signaling of conflict, and the dorsolateral prefrontal cortex (DLPFC) plays a regulatory role acting in response to the conflict signal from the ACC. The ACC and the DLPFC are hypothesized to form parts of 2 distinct control-related networks: the cinguloopercular and the frontoparietal networks, respectively (Gratton et al. 2018b). As such, the CSE reflects communication between networks of control. This makes the effect a particularly interesting target for studies of adolescence, as models of adolescent cognitive development suggest that the functional integration of specialized neural subnetworks involved in cognitive control is a central component of maturation in adolescence (Casey et al. 2008; Casey 2015; Luna et al. 2015).
Yet developmental studies of the CSE are scarce, and thus far they have typically found no significant differences in the magnitude of the effect between adolescents and adults (Waxer and Morton 2011; Larson, et al. 2012a; Cragg 2016; Smulders et al. 2018; Gyurkovics et al. 2020). These studies mostly focused on overt behavior and, with the exception of Cragg (2016) and Gyurkovics et al. (2020), used tasks that contained feature repetitions and stimulus–response contingencies limiting the scope of conclusions regarding top-down control that can be drawn from these findings (for a discussion of the effect of these confounds on the CSE, see e.g., Duthoo et al. 2014). To further our understanding of adolescent cognitive control, in the present study we used a confound-minimized task that has been optimized to isolate the control-related aspects of the CSE to investigate and contrast the neural mechanisms underpinning dynamic control adjustments in adolescents and adults, as measured by electroencephalography (EEG).
We examined developmental changes in 3 neural measures that have been previously linked to cognitive control processes: the frontocentral N2 event-related potential (ERP) component in the time domain of the EEG signal and midfrontal power and interareal synchrony in the theta range (4–7 Hz) in the time–frequency domain. The N2 component and midfrontal theta power are closely related, as phase-locked theta oscillations contribute to the N2 (Huster et al. 2013; Cavanagh and Shackman 2015), and both measures are hypothesized to reflect conflict monitoring processes (Cohen 2014a; Töllner et al. 2017). Their magnitude is sensitive to response conflict (Van Veen and Carter 2002a, 2002b; Yeung et al. 2004; Hanslmayr et al. 2008; Nigbur et al. 2011, 2012; Cohen and Donner 2013; Larson et al. 2014; Buzzell et al. 2019) and has been found to show sequential modulation, that is, the CSE pattern as well (Forster et al. 2010; Waxer and Morton 2011; Clayson and Larson 2011a, 2011b, 2013; Larson, et al. 2012b; Clawson et al. 2013; Pastötter et al. 2013; Gulbinaite et al. 2014; Jiang et al. 2015; Bombeke et al. 2017; Töllner et al. 2017; Feldman and Freitas 2018). Furthermore, in line with the idea that these indices are related to conflict monitoring, both the N2 and midfrontal theta have been localized to the ACC (Wang et al. 2005; Ladouceur et al. 2007; Hanslmayr et al. 2008; Pastötter et al. 2013).
Interareal phase synchrony in theta was examined to directly test the hypothesis that cross-network communication supporting cognitive control is still maturing across adolescence (Hwang et al. 2010; Marek et al. 2015). Oscillatory synchronization between areas has been hypothesized to be an important mechanism of communication between distant neural assemblies (Varela et al. 2001; Buzsáki and Draguhn 2004; Fries 2005; Klimesch et al. 2007; Helfrich and Knight 2016). Synchronization between midfrontal and lateral prefrontal sites in the theta band in particular has been shown to increase during task performance when the control demands of the task increase, for example, during errors (Cavanagh et al. 2009; Buzzell et al. 2019) and response conflict (Hanslmayr et al. 2008; Cohen and Cavanagh 2011; Gulbinaite et al. 2014), and this synchronization might capture the signaling between the ACC and the DLPFC as proposed by the conflict monitoring theory.
We expected to see greater current conflict-related change in conflict monitoring (N2 amplitude and midfrontal theta power) and conflict signaling (phase synchrony) but smaller reactive adjustments of cognitive control, that is, smaller CSEs, in the same outcome measures in adolescents compared with adults, because the immature cognitive control system of adolescents might not only be more sensitive to conflict but might also be less able to mobilize top-down control in response to it (Hämmerer et al. 2014). To the best of our knowledge, only a handful of studies have investigated the neural correlates of conflict-induced control changes using confound-minimized designs thus far (e.g., Larson et al. 2016; Yang et al. 2019), and we are unaware of any such studies with a developmental focus. As such, the present study will provide crucial novel insights into the development and the neural underpinnings of dynamic control regulation.
Materials and Methods
We report how we determined our sample size, all data exclusions (if any), all manipulations, and all measures in the study. Data files and the analysis script for this study are available on the Open Science Framework (OSF) at: https://osf.io/u458b.
Participants
Fifty-nine participants completed the experiment, 30 were early adolescents (12–14 year olds, mean age = 13.39, standard deviation [SD] = 0.87, 12 females, mean self-reported puberty score = 2.95 ± 1.19) and 29 were young adults (25–27 year olds, mean age = 26.30, SD = 0.90, 19 females). Three additional participants were removed, because they reported psychiatric or neurological conditions. All participants received £12 compensation for taking part. The study was approved by the Ethics Committee of the Department of Psychology, University of Sheffield.
Group-level target sample sizes were set to match those in Gyurkovics et al. (2020), that is, approximately 30. This still reflects an increase in statistical power for the conflict task analyses compared with that study, as the number of observations in the task was more than doubled (160 vs. 72 trials by condition).
Materials
Conflict Task
Participants completed a confound-minimized arrow flanker task (Eriksen and Eriksen 1974), in which they had to identify the direction of the central arrow—up, down, left, or right—in an array of 5 arrows displayed in the center of the screen. The 4 irrelevant distractor arrows flanking the target could point either in the same direction as the central target (congruent trials) or in a different direction (incongruent trials). The proportion of congruent trials was 50%, and the number of observations in the 4 within-subject conditions of interest (iI, cI, cC, and iC where i/I is incongruent and c/C is congruent, and lowercase letters indicate the congruency of the previous trial and upper case letters indicate the congruency of the current trial) was balanced. The following strategy was used to avoid feature repetition and contingency learning confounds: the 4 arrow directions (left, right, up, and down) were randomly split into 2 sets of 2 (e.g., left and up, right and down), and features in one set were used exclusively on odd trials, whereas features in the other were used exclusively on even trials, as such, certain combinations (e.g., left and down in this example) were never used. Consequently, no features repeated from one trial to the next, and there were no contingencies between stimulus features and responses, because all stimulus combinations—2 incongruent and 2 congruent combinations for both stimulus subsets—appeared with equal frequency (for further examples of this strategy, see Jiménez and Méndez 2013; Kim and Cho 2014; Schmidt and Weissman 2014; Weissman et al. 2014; Aschenbrenner and Balota 2017; Gyurkovics et al. 2020).
The task started with 24 practice trials (this was extended with 12 additional trials if the participant did not give at least 19 correct responses). Feedback was given after every trial during the practice session. Experimental sessions consisted of 8 blocks of 81 trials separated by short self-paced breaks, resulting in a total of 648 trials. In each block, there were 20 trials in each condition (cC, iC, iI, cI). The congruency of the first trial—which was not included in further analyses—was determined randomly for each block.
Each flanker trial started with the presentation of the distractor arrows without the target arrow present. After 200 ms, the target arrow appeared and the whole array of arrows remained on screen for 200 ms. After this interval, the task stimuli were replaced by a fixation cross. The stimulus onset asynchrony between distractors and the target was included to maximize conflict, and to bring our paradigm in line with previous EEG studies (e.g., Clayson and Larson 2011a, 2011b, 2013; Larson, et al. 2012a; Clawson et al. 2013, 2017; Bombeke et al. 2017). Stimuli were presented in black on a gray background. Participants had to indicate the direction of the target arrows by pressing the 2, 4, 6, or 8 keys on the numeric keypad to respond down, left, right, or up, respectively, within 3000 ms of target presentation. Participants were asked to use the index finger of their dominant hand. Following the participant’s response, the fixation cross remained on screen for 1000 ms if the response was correct, and error feedback was provided for 1000 ms in case the participant responded incorrectly (‘ERROR’) or too slowly (‘TOO SLOW’). The next trial started after a variable ITI of 300–900 ms during which the fixation cross remained on screen.
The task was programmed using the Psychtoolbox extension (Brainard 1997; Kleiner et al. 2007) in MATLAB R2014b.
Procedure
Tasks
After obtaining informed consent, including parental consent in the case of adolescents, participants first completed the Positive and Negative Affect Schedule (PANAS) (Watson et al. 1988) for the first time (PANAS1). After that they were set up for the EEG recording and completed the flanker task (duration ~25–30 min). On completion of the task, the EEG recording was terminated, and the electrode cap removed. Participants then completed the PANAS for a second time (PANAS2), along with a self-rated measure of pubertal development (Carskadon and Acebo 1993). Finally, the Sustained Attention to Response Task (SART) with thought probes was administered, which lasted approximately 10–15 min. Participants also completed the Mind-Wandering Questionnaire (MWQ) (Carriere et al. 2013), either before or after the SART (counterbalanced). Altogether, one experimental session lasted about 75–90 min. With the exception of the MWQ, self-report data were only collected to help better characterize the subsamples, but no a priori hypotheses were formed about these measures. Findings from the SART and the MWQ are not reported here but are available on the OSF page of the project. These measures were administered in an attempt to replicate mind-wandering-related findings from Gyurkovics et al. (2020).
EEG Recording and Preprocessing
EEG was recorded using a Biosemi ActiveTwo 64-channel EEG System. Electrodes were fitted according to the 10-20 system. EEG data were digitized by Biosemi ActiView software, at a sampling rate of 2048 Hz. The digitized data were subsequently downsampled to 512 Hz off-line. The downsampled data were then preprocessed and analyzed using the EEGLAB 14.1.2 and ERPLAB 5.0 MATLAB toolboxes (Delorme and Makeig 2004; Lopez-Calderon and Luck 2014) and custom MATLAB scripts available on the OSF page of the project.
First, data were rereferenced to the average of all electrodes and high-pass filtered using an infinite impulse response (IIR) Butterworth filter with a half-amplitude cutoff of 1 Hz to remove low-frequency noise such as drifting caused by sweating. Then, the CleanLine plugin (Mullen 2012) was used to attenuate 50 Hz noise originating from sources of alternating current in the environment, such as power lines. In the next step, channels containing excessive amounts of noise as determined by visual inspection were removed (average number of channels removed per participant: 4.29 ± 1.79), and independent component analysis was run to identify blink- and eye movement-related activity. Components representing these were subtracted from the data. The output of the ADJUST toolbox for artifact removal (Mognon et al. 2011) was used to help identify potential noise components, but the final decisions were ultimately made by visual inspection of component topographies. Finally, previously removed channels were interpolated using spherical spline interpolation (Perrin et al. 1989).
After these steps, continuous data were segmented into 1200 ms long epochs beginning 400 ms before presentation of the target arrow (and thus 200 ms before presentation of the distractors) and concluding 800 ms after target presentation. Baseline activity from the period −400 to −200 ms was subtracted from the resulting epochs. Any epochs with voltage deflections exceeding ±150 μV were removed from the data. Epochs where the participant’s eventual response was incorrect and epochs immediately following error trials were also removed from the data. The remaining epochs were classified into 4 categories based on current trial congruency (congruent vs. incongruent) and previous trial congruency (congruent vs. incongruent). All conditions contained more than 130 trials on average in each age group (for more detailed information regarding trial numbers see Supplementary Table 1).
After artifact removal, epoched data were Laplacian transformed by using the laplacian_perrinX() MATLAB function created by Cohen (2014b; default parameters were used, order of Legendre polynomial = 20; λ = 10−5). This transformation is a spatial filter that attenuates spatially broad features of the data, by subtracting the sum of activity across all electrodes weighted by interelectrode distances from the activity of each electrode (Cohen 2014b). This improves the topographical localization of activity, attenuates volume conduction effects, and makes the data reference independent (Kayser and Tenke 2015).
EEG Analyses
Analysis in the Time Domain—ERPs
Electrode FCz was chosen as the electrode of interest in all analyses based on previous studies focusing on the N2 (e.g., Yeung et al. 2004; Danielmeier et al. 2009; Clayson and Larson 2011a, 2011b, 2013; Larson, et al. 2012b; Clawson et al. 2013, 2017; Riesel et al. 2017), and cognitive control-related time–frequency effects (e.g., Cavanagh et al. 2009; Gulbinaite et al. 2014) in which FCz has been the most commonly investigated site. Scalp topography of grand-average ERPs and power were also inspected visually to confirm the choice of electrode. For all analyses, variants of the adaptive mean procedure were used to quantify event-related changes in brain activity in various conditions (Clayson et al. 2013). In the time domain this meant that first the negative peak was identified between 200 and 400 ms after target presentation in each conditional ERP for each participant, then mean amplitude was extracted from a second, smaller time window starting 15 ms prepeak and ending 15 ms postpeak, resulting in a peak latency and a mean amplitude value for every condition. This was preferable to the simple mean amplitude procedure because we were not forced to use the same time window for every participant. This would have been problematic in case there was a latency difference between groups in the peak of the N2 component. As peak identification can be susceptible to high-frequency noise, segmented EEG data were low-pass filtered for time domain analyses only, using an IIR Butterworth filter with a half-amplitude cut-off of 30 Hz.
The length of the larger, sample-level time window was determined in a data-driven fashion. The first time window of interest we applied was 200 to 350 ms post-target, however, with this interval the adaptive mean calculations often identified negative peaks for the congruent conditions that were exactly at the upper limit of the window (at 350 ms) suggesting that this shorter range was not appropriate for all conditions. It is also worth noting that we originally considered running the adaptive mean procedure on the trial level as opposed to on condition-aggregated data in order to be able to use the same analytic strategy for the neural data as for the behavioral data (linear mixed-effects modeling), however, trial-level adaptive mean estimates were deemed to be too unreliable for such analyses due to noise.
Analysis in the Time–Frequency Domain—Power and Phase Synchrony
Power
Time–frequency information was derived from the EEG signal by taking the Fourier transform (frequency spectrum) of the epoched data and multiplying it with the Fourier transform of Morlet wavelets of different frequencies and then computing the inverse Fourier transform of the product spectra (Cohen 2014b). Power values were then obtained from the resulting complex signal by squaring the length of the complex vector at each time point and were subsequently averaged across trials. Thirty frequencies were used, logarithmically spaced between 2 and 30 Hz, and the number of wavelet cycles (i.e., the width of the Gaussian taper used to create the Morlet wavelet) increased with the frequency from 3 to 10 to adjust the balance between temporal and frequency precision across different frequency bands. Finally, power was normalized and decibel (dB) transformed in each frequency (dB power = 10 × log 10[power/baseline]) where baseline activity represented the average power across all conditions from −400 to −200 ms, i.e., the 200-ms window before the appearance of the distractor arrows. This transforms the data to the same scale across different conditions and subjects, thereby facilitating comparisons. Epochs were reflected before wavelet convolution and subsequently trimmed to their original length to avoid edge artefacts (Cohen, 2014b).
To quantify event-related changes in theta power, first peak posttarget power was identified for each participant in each condition within a time window of 0 ms (stimulus onset, 200 ms after distractor onset) to 500 ms and in the frequency band ranging from 2 to 10 Hz (Cohen 2014b). The time window was determined after visual inspection of grand average power. After maximal power was found, a time window extending 25 ms before and 25 ms after the peak time–frequency point was identified. Power was then averaged down in this window, across a band of frequencies stretching ± ~ 2 Hz around the frequency of the maximum power value. Thus, at the end of the procedure we had information about the 1) latency of maximal posttarget power, 2) the frequency of maximal post-target power, and 3) the mean power in a time window surrounding this maximal value for every condition and participant.
Intertrial Phase Clustering
In addition to power, time–frequency decomposition also provides information about the phase of oscillations at each time–frequency point. This information can be used to gauge the temporal consistency of oscillations across trials providing a measure of intraindividual variability at the neural level. Intraindividual variability decreases prominently as a function of maturation both in behavior (e.g., Dykiert et al. 2012; Montez et al. 2017; Gyurkovics et al. 2020) and at the neural level (Müller et al. 2009; Papenberg et al. 2013; Liu et al. 2014), and these two levels of variability have been shown to be related (Groom et al. 2010; Papenberg et al. 2013; Cooper et al. 2017). In a series of complementary analyses, we attempted to replicate these findings, using intertrial phase clustering (ITPC) as a measure of neural variability and the coefficient of variation (CV) in RT as a measure of behavioral variability (i.e., SD RT/mean RT). ITPC quantifies the similarity of the phase angles of oscillations across trials at time–frequency point N in a given condition; more specifically, it measures how clustered phase angles are in polar space. An ITPC value of 0 indicates no phase synchrony, that is, the phase angles of the different trials are uniformly distributed in polar space at time point N, there is no clustering, whereas a value of 1 means phase angles are identical across trials, reflecting perfect consistency. For analyses, conditional values were extracted using a strategy similar to the one described for ERPs and power: first, a sample-level time window was defined based on the grand average (covering frequencies from 2 to 10 Hz, and time points from 0 to 400 ms posttarget), then for each participant and each condition, the maximum ITPC value was identified within this larger window, and a smaller window of the same parameters described above for power analyses was defined around it. Mean ITPC within this latter window was used in further analyses.
Phase-Lag Index
For the analysis of interareal oscillatory synchronization, the PLI was calculated at each time–frequency point by first determining the distribution of the differences in phase angles between 2 sites (electrodes) at a given point across trials. The PLI then measures the extent to which this distribution is shifted toward the positive or the negative side of the imaginary axis on the complex plane at that point, by averaging the sign of the imaginary part of the cross-spectral density (Cohen 2014b). Volume-conducted connectivity is distributed around zero radian (because there is no substantial delay between the phases of oscillations at the 2 sites), as such, it results in PLI values close to 0. Consequently, PLI is largely insensitive to volume conduction. Conditional PLI values were quantified using the same strategy described above: a sample-level time window was established based on the grand average PLI plot (here ranging from 0 to 500 ms) in the frequency band of interest (2–10 Hz), and then smaller windows of interest were identified within this larger window for each participant, in a manner identical to the ITPC analyses. In all analyses, FCz was the seed electrode, and the sites of interest were electrodes F5 and F6, capturing the left and right dorsolateral prefrontal cortices, respectively.
For the sake of transparent reporting we note that inter-site phase clustering (ISPC) was also considered as a measure of connectivity (Cohen, 2014b). However, due to its sensitivity to volume conduction, this measure was abandoned in favor of PLI. Notably, ISPC analyses revealed largely similar results to PLI.
Statistical Analyses
Behavioral data were analyzed using a similar strategy to Gyurkovics et al. (2020). To clean the data, RTs shorter than 150 ms were removed. This resulted in the removal of only 0.37% of trials. Then outliers, identified as trials with RTs beyond 3 SDs of the participant’s mean were also removed. This resulted in the removal of further 1.01% trials. Error trials and trials immediately following error trials were also removed. For accuracy analyses, no trials were removed. To account for baseline differences in response speed across groups, standardized RTs were also analyzed in addition to raw RTs. RTs were standardized by calculating within-subject Z-scores. This procedure preserves intraindividual variability in RT but converts the mean of each individual to 0, thereby removing group differences in the outcome.
For RT analysis, a general linear mixed-effects model with variables Previous Congruency (0: congruent, 1: incongruent), Current Congruency (0: congruent, 1: incongruent), and Age Group (0: adults, 1: adolescents) and their interactions as predictors was run with RT as the outcome, using the “lme4” package in R (Bates et al. 2015). The structure of the random effects was determined by inspecting the Akaike Information Criteria (AIC) of models with random effects structures of different complexity. The significance of terms in the model with the lowest AIC value was determined using the Anova() function of the “car” R package (Fox and Weisberg 2019).
A similar generalized linear mixed-effects model was run for accuracy analyses with trial-level accuracy as the outcome. For the sake of brevity, accuracy analyses of the flanker task will only be presented if they in any way contradict or complement RT analyses.
Intraindividual variability in behavior was indexed by the CV of correct RTs in each of the 4 conditions, calculated as SD/mean RT. Data were then analyzed via a mixed analysis of variance (ANOVA), with Age Group as a between-subject factor, and Previous Congruency and Current Congruency as within-subject factors.
Neural data were also analyzed with mixed ANOVAs of the same parameters. Outcome variables were adaptive mean amplitude (time domain data), adaptive mean power, adaptive mean ITPC, and adaptive mean PLI.
For each participant, a behavioral CSE index and 2 neural CSE indices were also calculated using the following equation: (cI − cC) − (iI − iC) where each letter combination refers to the mean RT, adaptive mean amplitude, or adaptive mean power of that condition. For the N2 adaptive mean amplitude calculation, where the incongruent condition was expected to have larger negative values than the congruent condition, the formula was modified to (cC − cI) − (iC − iI). In all cases, larger values indicate larger CSEs, that is, bigger modulation of control following conflict. The 2 neural indices were then correlated with the behavioral CSE index using Kendall’s τ. Finally, the relationship between ITPC and behavioral variability was examined by correlating the conditional ITPC values with the corresponding conditional CV, for example, iI ITPC with iI CV.
To explore the potential confounding effects of gender, all between-group analyses were rerun with gender and all its interactions included in the model. The main findings remained unchanged following the inclusion of gender. These control analyses can be found in the analysis scripts on the OSF page of the project.
The α level was set to.05 in all analyses.
Results
Behavioral Findings
Conflict Task Performance
No significant age differences were found in the CSE after controlling for baseline speed differences between early adolescents and adults. Table 1 summarizes the 2 statistical models of interest, one with raw RT as the outcome and the other with standardized RT to eliminate baseline speed differences. The CSE is the Previous Congruency × Current Congruency interaction, and it is significant in both models. While there is a small age effect in the magnitude of the CSE in raw RT whereby the size of the effect was smaller in adults than in early adolescents (Fig. 1), this effect was not present in standardized RT. Consistent with the findings of Gyurkovics et al. (2020), there was an age-related increase in the size of the congruency effect (Age Group × Current Congruency) in standardized RT. For error analyses, see Supplementary Table 2 and Supplementary Figure 1.
Terms from the 2 general linear mixed-effects models investigating flanker task performance in raw and standardized RT across age groups
| Model (AIC value) | Raw RT (436972.9) | Standardized RT (90405.1) | ||||
|---|---|---|---|---|---|---|
| B | χ2(1) | P | B | χ2(1) | P | |
| Congruency (C) | 99.82 | 1047.44 | <0.001 | 1.13 | 922.44 | <0.001 |
| Previous Congruency (PC) | 7.68 | 39.00 | <0.001 | 0.09 | 42.37 | <0.001 |
| Age Group | 47.23 | 16.47 | <0.001 | 0.11 | 4.59 | 0.032 |
| C × PC (CSE) | −8.12 | 37.44 | <0.001 | −0.10 | 48.25 | <0.001 |
| C × Age Group | 17.18 | 3.75 | 0.053 | −0.22 | 15.20 | <0.001 |
| PC × Age Group | 10.98 | 7.92 | 0.005 | 0.06 | 3.91 | 0.048 |
| C × PC × Age Group | −10.04 | 5.50 | 0.019 | −0.05 | 1.75 | 0.186 |
Note: For both the raw RT and the standardized RT analyses, the model with random slopes for the main effect of C per participant was selected over models with slopes for the PC × C interaction or no random slopes at all. The AIC values of the competing models were: 436986.4 and 437287.9, respectively, in the raw RT analysis, and 90408.9 and 90933.6, respectively, in the standardized RT analysis. CSE = congruency sequence effect; AIC = Akaike Information Criterion.

The effect of congruency as a function of previous trial congruency in early adolescents and adults in raw (A) and standardized RT (B) in the flanker task. Error bars represent ±1 SE. SE = standard error.
Furthermore, greater intraindividual variability in RT as measured by CV was found in adolescents compared with adults. A 2 × 2 × 2 ANOVA revealed main effects of Age Group, F1,57 = 32.17, P < 0.001 and Current Trial Congruency, F1,57 = 509.87, P < 0.001; an interaction between these 2 factors, F1,57 = 26.36, P < 0.001 and a nominally significant CSE, F1,57 = 4.28, P = 0.043. Descriptive data for this analysis are shown in Supplementary Figure 2. Adolescents showed much higher variability in general than adults. Performance was also more variable on congruent trials than on incongruent trials in both age groups, but the difference between the 2 trial types was greater in adolescents than in adults.
EEG Findings
Time Domain—N2 Amplitude
The CSE was observed in changes in N2 amplitude, but there was no difference in this effect between early adolescents and adults. Stimulus-locked ERPs at electrode FCz for all 4 conditions (cI, iI, cC, iC), in both age groups are shown in Figure 2A. Statistical analyses (Table 2) revealed a main effect of Current Congruency as a greater negative deflection was observed on incongruent trials compared with congruent trials in the N2 time range (Fig. 2B). The Previous Trial Congruency × Current Congruency interaction was also significant, suggesting the presence of the CSE. Neither effect was modulated by age, although Age Group had a significant main effect, as early adolescents showed greater negative deflections than adults in the N2 time window across conditions.
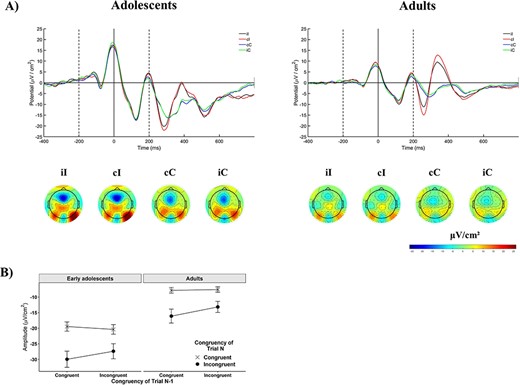
Event-related activation in the time domain. (A) Event-related potentials (ERPs) at electrode FCz as a function of previous trial congruency and current trial congruency in the 2 age groups. On both figures the first dashed line indicates the onset of the distractors, the bold line at time 0 the onset of the target, and the second dashed line the offset of both the target and distractors. Scalp maps show mean amplitude calculated from a 30-s time window around the group-specific grand-average peak latency (290 ms for adults, 300 ms for adolescents). (B) The effect of congruency as a function of previous trial congruency, or the CSE, on mean amplitude at electrode FCz in the time domain. Note that these are negative values. Error bars represent ±1 SE.
The results of the ANOVAs examining N2 amplitude, theta power, and ITPC in the flanker task across age groups
| N2 amplitude | Theta power | ITPC | |||||||
|---|---|---|---|---|---|---|---|---|---|
| Term | F | P | ηp2 | F | P | ηp2 | F | P | ηp2 |
| Congruency (C) | 42.82 | <0.001 | 0.81 | 132.65 | <0.001 | 0.97 | 26.81 | <0.001 | 0.76 |
| Previous Congruency (PC) | 8.55 | 0.005 | 0.09 | 27.86 | <0.001 | 0.37 | 0.25 | 0.620 | 0.004 |
| Age Group | 34.56 | <0.001 | 0.92 | 0.19 | 0.666 | 0.10 | 4.01 | 0.050 | 0.47 |
| C × PC (CSE) | 9.67 | 0.003 | 0.15 | 28.34 | <0.001 | 0.33 | 2.19 | 0.145 | 0.04 |
| C × Age Group | 0.57 | 0.453 | 0.06 | 5.09 | 0.028 | 0.56 | 5.84 | 0.019 | 0.40 |
| PC × Age Group | 0.87 | 0.356 | 0.01 | 0.31 | 0.58 | 0.01 | 0.55 | 0.461 | 0.01 |
| C × PC × Age Group | 0.16 | 0.691 | 0.003 | 3.56 | 0.064 | 0.06 | 0.03 | 0.868 | <0.001 |
Note: ηp2 = partial eta squared; CSE = congruency sequence effect. All degrees of freedom were 1,57.
Time–Frequency Domain—Midfrontal Theta Power
Similarly to N2 amplitude, the CSE was observed in midfrontal theta power as well, and did not differ significantly between early adolescents and adults. Changes in power at different time–frequency points in different conditions in the 2 groups are shown in Figure 3A. As seen in Table 2, power in the theta band was significantly increased following the presentation of incongruent compared with congruent targets. The main effect of Congruency also interacted with Previous Trial Congruency (CSE) and with Age Group (Fig. 3C). Early adolescents showed a smaller congruency effect than young adults in midfrontal theta power. The CSE did not interact with age.
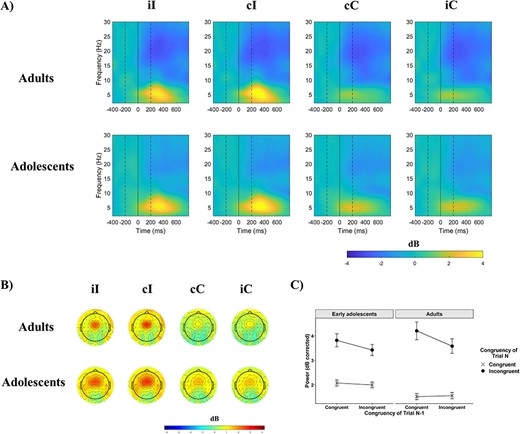
Event-related power. (A) Event-related power at electrode FCz as a function of previous trial congruency and current trial congruency in the 2 age groups. On all figures the first dashed line indicates the onset of the distractors, the bold line at time 0 the onset of the target, and the second dashed line the offset of both the target and distractors. (B) Scalp maps of mean power across 4–7 Hz and between 0 and 500 ms. (C) The effect of congruency as a function of previous trial congruency, or the CSE, on mean theta power at electrode FCz. Error bars represent ±1 SE.
Time–Frequency Domain—Phase Synchrony Across Trials
To characterize intraindividual variability at the neural level, the temporal consistency of theta oscillations across trials was investigated next as measured by ITPC. ITPC values across time–frequency points in the 4 conditions and across the 2 groups are shown in Figure 4A. Cross-trial synchrony increased on incongruent compared with congruent trials in the theta band; however, this increase was significantly smaller in early adolescents compared with young adults (Fig. 4C). This was due to higher temporal consistency on incongruent trials in adults than in early adolescents (P = 0.006). No CSE was observed in this outcome measure (Table 2). Because ITPC values are sensitive to differences in trial count across conditions and participants (Cohen 2014b), these analyses were reran twice to control for the potential biasing effect of differential trial numbers: once using ITPCZ instead of ITPC where ITPCZ = trial number × ITPC2 (Cohen 2014b), and once calculating ITPC after randomly subsampling the same number of trials (n = 93, the lowest conditional trial count across participants) across every condition for every participant 20 times and averaging the resulting data sets. Both analyses revealed the same pattern of findings as the raw ITPC analysis.
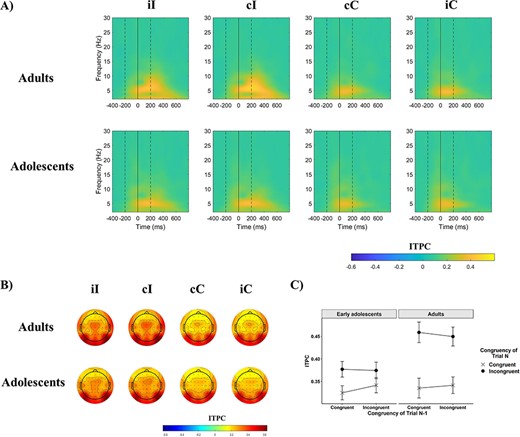
Event-related inter-trial phase clustering (ITPC). (A) Event-related ITPC at electrode FCz as a function of previous trial congruency and current trial congruency in the 2 age groups. On all figures the first dashed line indicates the onset of the distractors, the bold line at time 0 the onset of the target, and the second dashed line the offset of both the target and distractors. (B) Scalp maps of mean ITPC across 4–7 Hz and between 0 and 400 ms. (C) The effect of congruency as a function of previous trial congruency, or the CSE, on mean theta ITPC at electrode FCz. Error bars represent ±1 SE.
Time–Frequency Domain—Phase Synchrony Across Electrodes
Phase synchrony across electrodes was examined next to investigate if functional connectivity between midfrontal and prefrontal regions differed as a function of age and cognitive control demands; however we found it did not. PLI values across the 2 groups for both the FCz-F6 and the FCz-F5 electrode pairs are shown in Figures 5A,B, respectively. A 2 (Current Congruency) × 2 (Previous Congruency) × 2 (Age Group) × 2 (Channel, referring to the target electrodes F5 and F6) mixed ANOVA found that synchronization between midfrontal and lateral frontal sites was greater on incongruent compared with congruent trials, but no other statistically significant effects were found (Table 3). Like ITPC, PLI is also sensitive to differential trial numbers across conditions and participants. To control for this potential bias, trials were randomly subsampled 20 times to match in number across participants. Results were identical when PLI was calculated this way as once again only the main effect of congruency reached significance (P < 0.001) out of the effects of interest.
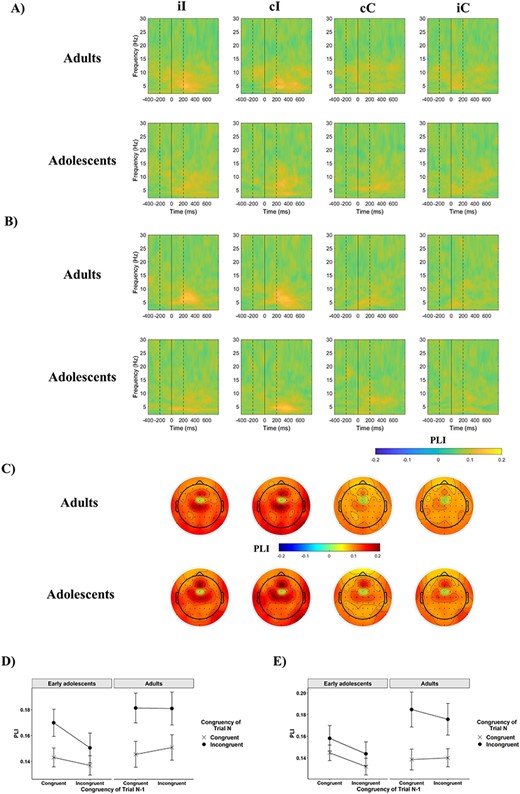
Event-related phase-based connectivity. (A,B) PLI values between electrode FCz and electrodes F6 (A) and F5 (B) as a function of previous trial congruency and current trial congruency in the 2 age groups. On both figures, the first dashed line indicates the onset of the distractors, the bold line at time 0 the onset of the target, and the second dashed line the offset of both the target and distractors. (C) Scalp topography of mean ISPC between electrode FCz and all other electrodes, across 4–7 Hz and between 0 and 500 ms. (D,E) The effect of congruency as a function of previous trial congruency, or the CSE, on mean theta PLI between electrode FCz and electrodes F6 (D) and F5 (E). Error bars represent ±1 SE.
The result of the ANOVA examining functional connectivity—PLI—in the flanker task across age groups
| PLI | |||
|---|---|---|---|
| F | P | ηp2 | |
| Congruency (C) | 12.38 | <0.01 | 0.53 |
| Previous Congruency (PC) | 2.77 | 0.10 | 0.07 |
| Age Group | 3.73 | 0.06 | 0.26 |
| Channel (Chan) | 0.64 | 0.43 | 0.04 |
| C × PC (CSE) | 1.17 | 0.28 | 0.02 |
| C × Age Group | 1.89 | 0.17 | 0.14 |
| PC × Age Group | 2.32 | 0.13 | 0.06 |
| C × PC × Age Group | <0.01 | 0.97 | <0.01 |
| C × Chan | <0.01 | 1.00 | <0.01 |
| PC × Chan | 0.28 | 0.60 | <0.01 |
| Chan × Age Group | <0.01 | 0.98 | <0.01 |
| C × PC × Chan | 0.08 | 0.78 | <0.01 |
| C × Age Group × Chan | 0.59 | 0.45 | 0.02 |
| PC × Age Group × Chan | 0.16 | 0.69 | <0.01 |
| C × PC × Age Group × Chan | 0.38 | 0.54 | 0.01 |
Note: The seed electrode was FCz, and the 2 target electrodes (channels) of interest were F5 and F6. All degrees of freedom were 1,57. PLI = Phase-lag index; CSE = congruency sequence effect, ηp2 = partial eta squared.
Brain–Behavior Correlations
First, the relationship between the CSE at the neural level and the CSE at the behavioral level was investigated (see Supplementary Table 3 for details). The correlation between the power-based (time–frequency domain) CSE and the raw RT-based CSE did not reach significance (Kendall’s τ = 0.04, P = 0.62). A weak negative relationship was detected between the ERP-based (time-domain) CSE and the raw RT-based CSE, Kendall’s τ = −0.19, P = 0.037. Time-domain and time–frequency domain CSEs were weakly positively correlated, Kendall’s τ = 0.19, P = 0.038.
Behavioral variability was negatively related to ITPC values in all conditions (Kendall’s τs of −0.30, −0.08, −0.22, and −0.09 for iI, iC, cI, cC, respectively), but the associations only reached statistical significance in the 2 incongruent conditions, iI and cI, (P = 0.001 and 0.015, respectively). Only the correlation in condition iI remained significant after controlling for age, Kendall’s τ = −0.20, P = 0.030.
Discussion
In the present study, we investigated the neural correlates of conflict-related dynamic changes in cognitive control as indicated by the CSE in young adolescents and adults, using a confound-minimized version of the classic flanker task. Our main objective was to examine whether age-related changes are apparent in the ability to flexibly modulate control at the neural level, which is to be expected given the protracted maturation of control-related brain areas (Gogtay et al. 2004; Ordaz et al. 2013). We focused on midfrontal neural correlates of control processes, namely the N2 ERP component, theta power, and interareal theta phase synchrony, as these measures have clearly been linked to dynamic cognitive control processes in previous studies (Cohen 2014a; Larson et al. 2014). We found no significant age differences in the magnitude of the CSE in either neural outcome measure suggesting similar reactive adjustments of control in adolescents and adults. Notably, however, adolescents did show different dynamics in the theta band compared with adults in response to conflict on the current trial displaying smaller differentiation in theta power between congruent and incongruent trials and higher variability in the timing of oscillations on conflicting trials. This suggests that the still maturing cognitive control system of adolescents initially responds deficiently to the increased control demands of conflict compared with adults.
Cognitive Control at the Behavioral Level
At the behavioral level, both early adolescents and young adults showed evidence of dynamic modulations of control (i.e., the CSE) in response speed and accuracy. The magnitude of these modulations was significantly greater in adolescents than in adults in raw RT only, but this age effect disappeared after controlling for baseline speed differences between groups by standardizing RTs. This pattern of results matches the findings of Smulders et al. (2018) who only detected an age-related decrease in the CSE in RTs before but not after controlling for average response speed, using a Simon task that contained feature repetitions. The null finding in standardized RT is also in line with other previous studies using deconfounded designs that found no age differences in the magnitude of the CSE in the transition from adolescence to adulthood (Cragg 2016; Gyurkovics et al. 2020). It is important to keep in mind, however, that the lack of a significant finding cannot be interpreted as evidence for the lack of an effect, as more highly powered studies might still be able to observe developmental changes in the future. The most cautious interpretation we can offer is that in terms of behavior, there appear to be no substantial and robust age differences in the magnitude of reactive control modulations after controlling for general age-related speeding.
Cognitive Control at the Neural Level
At the neural level, the purported neural markers of cognitive control we investigated were all modulated by response conflict: the amplitude of the N2 was greater on incongruent trials compared with congruent trials (Larson et al. 2014), and both the power and temporal consistency of theta oscillations increased in the midfrontal region on incongruent compared with congruent trials (Hanslmayr et al. 2008; Nigbur et al. 2011, 2012; Cohen and Donner 2013; Cohen 2014a). Synchronization between midfrontal and lateral frontal sites also increased in response to conflict (Hanslmayr et al. 2008; Cohen and Cavanagh 2011; Cohen 2014a; Gulbinaite et al. 2014). All of these conflict-related modulations occurred before a correct response was made, suggesting that midfrontal regions (e.g., the ACC) are indeed involved in conflict resolution processes, possibly in the detection of conflict (Botvinick et al. 2001, 2004) or more generally, of signals of need for control (Cavanagh and Frank 2014; Cavanagh and Shackman 2015) and that theta rhythm generation is a key aspect of the oscillatory activity supporting these processes (Cohen 2014a; Helfrich et al. 2019; Duprez et al. 2020). The PLI findings also show that theta oscillations were involved in the communication between midfrontal and lateral frontal regions (Hanslmayr et al. 2008; Cohen and Cavanagh 2011; Gulbinaite et al. 2014), possibly reflecting the signaling of the increased need for control on incongruent trials.
The conflict effect was also modulated by the congruency of the previous trial in N2 amplitude and midfrontal theta power, that is, the CSE was observed in these outcomes. As stimulus-driven learning and memory confounds were controlled for in our task, these findings provide strong support for the idea that these frontocentral electrophysiological measures can capture the dynamic modulation of top-down control processes (Cohen 2014a; Larson et al. 2014; Clayton et al. 2015). Notably, the modulatory effect of previous trial congruency was most pronounced in incongruent trials in the neural measures, whereas the behavioral measures showed diverging patterns: the CSE in task accuracy was similar to the neural CSE patterns, whereas the CSE in RT was driven by modulations in congruent as opposed to incongruent trials. This complex picture is probably the result of floor effects in N2 amplitude, theta power, and error rates on congruent trials regardless of previous trial congruency and a potential ceiling effect on RT on incongruent trials, as the task was relatively easy for both age groups. Nevertheless, all of these patterns can be considered to be indicative of sequential modulations of control in the paradigm that was used.
Contrary to power and amplitude measures, phase-based measures did not show reliable CSEs. As for ITPC, this could mean that the timing of theta oscillations on trial N is unaffected by conflict on trial N-1, and modulations are only evident in the amplitude of the ongoing oscillatory activity. The lack of a CSE in interareal phase synchrony is more surprising given the conflict monitoring theory’s clear predictions regarding communication between midfrontal and lateral frontal sites (the ACC and the DLPFC to be exact) being impacted by trial history as well as the current trial. It is possible that this modulation was too subtle and would have been detected in a more highly powered design. Future studies are needed to explore when, for example, in the periresponse period (Cohen and Cavanagh 2011; Buzzell et al. 2019) versus the poststimulus period (Gulbinaite et al. 2014; Buzzell et al. 2019) and where midfrontal–lateral frontal communication can be best observed in the flanker and other tasks, if at all, as support for the assumption that electrodes F5 and F6 represent activity in the DLPFC is less strong than for the assertion that frontocentral electrodes such as the FCz reflect ACC-mediated activity.
Concerning our focal question regarding the development of dynamic control adjustments, we found that the CSE was not significantly modulated by age in either N2 amplitude or theta power, paralleling our behavioral findings and strengthening our conclusion that the ability to reactively adjust control reaches adult-like levels early on. There was, however, an interaction between age and the effect of current trial congruency in midfrontal theta power, whereby adolescents showed a smaller congruency effect in this outcome measure compared with adults. Future studies are needed to investigate if this finding is replicable; however if it is, it is not clearly in line with the notion that adolescents are more susceptible to conflict than adults on the neural level as originally predicted (Hämmerer et al. 2014; Lo 2018); rather, they suggest that adolescents may not respond to the occurrence of conflict adequately, potentially due to some limitation of their conflict detection system posed by their still-maturing cognitive control networks, leading to smaller differentiation between congruent and incongruent trials as evident in theta dynamics in this study. It is unlikely that the reduced theta congruency effects reflect more optimized neural performance in adolescents (e.g., less interference), given that these age effects were not accompanied by faster, less error-prone, or more consistent behavioral performance on incongruent trials in adolescents compared to adults. The observed effects could instead mean that early adolescents were unable to recruit adequate control processes when conflict occurred, or they inflexibly engaged such processes even when that was unnecessary, on congruent trials (for a similar idea, see Chevalier et al. 2013; Chevalier 2015). Importantly, and somewhat surprisingly, it appears that even though the 2 age groups differed in their initial response to current trial conflict on the neural level, both groups then modulated control levels similarly—or more precisely, not significantly differently—in response to the conflict signal as suggested by the CSEs in N2 amplitude, theta power, and RT that did not differ between early adolescents and adults.
The conclusion that adolescents respond differently to conflict on the current trial than adults is further supported by our finding that the congruency effect was also smaller in the younger age group compared with adults in neural variability as measured by ITPC. Adolescents showed lower consistency in the timing of midfrontal theta oscillations across incongruent trials compared with adults suggesting that the trial-by-trial temporal coordination of cognitive control processes may be deficient in this age group (Papenberg et al. 2013; Liu et al. 2014). Alternatively, the condition by age group interaction could have been an effect of both groups being close to the floor in cross-trial consistency on congruent trials (i.e., theta oscillations were only minimally synchronized in this condition); thus, an age-related decrease in this measure could only be evident on incongruent trials in adolescents. Behavioral variability as captured by RT CV provides some support for this notion, as it was particularly high on congruent trials in adolescents, although importantly RT variability was also higher in the incongruent conditions in adolescents compared with adults. Behavioral and neural variability were only weakly interrelated in our sample after controlling for age; however, this could simply reflect a lack of power for correlational analyses, which were not the primary focus of our study. In sum, findings at the behavioral level and in theta dynamics all suggest that the engagement and coordination of control processes in response to conflict is immature in adolescence, although this is not clearly reflected in the magnitude of cross-trial adjustments. These age-related neural changes were not evident in the time-domain EEG signal, underlining the importance of considering time–frequency dynamics in developmental work (Bowers et al. 2018).
Finally, age had no significant effect on functional connectivity (PLI) between frontal and lateral frontal sites, a finding that provides no clear support for or against the idea that network integration, the functional collaboration of different networks in the brain, is still undergoing changes during adolescence (Luna et al. 2015). It is possible that changes in functional connectivity from early adolescence to young adulthood are more evident during rest than task performance (Marek et al. 2018) or in more posterior locations than the frontal cortico-cortical connections that were the focus of our hypotheses (Hwang et al. 2013). Nevertheless, our findings regarding cross-electrode and cross-trial theta dynamics suggest that many aspects of the theta-based cognitive control network are not substantially dissimilar in adolescents and adults (Buzzell et al. 2019).
Conclusion
The present study found sequential modulation of conflict-related effects (the CSE) in the amplitude of the N2 ERP component and midfrontal theta power using a confound-minimized conflict task in a sample of adolescents and young adults, underlining the importance of midfrontal regions and theta oscillations in conflict detection and control mobilization processes. The CSE was not modulated by age in either one of these outcomes suggesting that the ability to dynamically modulate control levels across trials following conflict reaches adult-like levels early on, at least in the flanker task. Notably, however, adolescents did show smaller differentiation between low- and high-conflict trials in the power and temporal consistency of theta oscillations. This could mean that the rapid engagement and coordination of control processes is still immature at this stage of development. Future studies are necessary to replicate this finding and to establish its functional significance by examining, for instance, how adolescents perform in speeded, real-world control demanding situations compared with adults.
Funding
The University Prize Scholarship of the University of Sheffield (to M.G.)
Notes
The authors would like to thank Dr Tom Stafford for his valuable input throughout the project, Drs Elizabeth Milne and Nicolas Chevalier for their helpful comments on an earlier draft of the manuscript, and Zaihirah Quddus for her help with data collection. Conflict of Interest: None declared.
Current address: Beckman Institute for Advanced Science and Technology, University of Illinois, Room 2217, 405 N. Mathews Avenue, Urbana, IL 61801, USA