


Abstract
Naming a color can be understood as an act of categorization, that is, identifying it as a member of a category of colors that are referred to by the same name. But are naming and categorization equivalent cognitive processes and consequently rely on same neural substrates? Here, we used task and resting-state functional magnetic resonance imaging as well as behavioral measures to identify functional brain networks that modulated naming and categorization of colors. We first identified three bilateral color-sensitive regions in the ventro-occipital cortex. We then showed that, across participants, color naming and categorization response times (RTs) were correlated with different resting state connectivity networks seeded from the color-sensitive regions. Color naming RTs correlated with the connectivity between the left posterior color region, the left middle temporal gyrus, and the left angular gyrus. In contrast, color categorization RTs correlated with the connectivity between the bilateral posterior color regions, and left frontal, right temporal and bilateral parietal areas. The networks supporting naming and categorization had a minimal overlap, indicating that the 2 processes rely on different neural mechanisms.
Introduction
Does the human ability to efficiently categorize visual stimuli rely on language? Color categorization, that is, our ability to group colors into ensembles, such as green, yellow, and red, has served as a case-in-point of this debate (for reviews see Witzel 2018; Lindsey and Brown 2019; Siuda-Krzywicka et al. 2019a). Studies showed that language regions operate when people categorize colors (Ting Siok et al. 2009) and that color naming may be necessary for the visual system to respond to color categorically (Thierry et al. 2009; Athanasopoulos et al. 2010; Brouwer and Heeger 2013). Yet, other studies did not find evidence for the engagement of language or language regions in color categorization (see e.g., Bird et al. 2014; Persichetti et al. 2015; for review see Siuda-Krzywicka et al. 2019a). In patients with naming deficits due to brain damage, performance in certain color categorization tasks can be significantly better than in color naming (Roberson et al. 1999; Haslam et al. 2007; Siuda-Krzywicka et al. 2019b). Particularly, a patient with color anomia due to a left ventro-occipital lesion had severely impaired color naming and close-to-normal performance in color categorization (Siuda-Krzywicka et al. 2019b). The dissociation between lexical color processing and intact color categorization strongly suggests that different brain circuits support categorization and naming.
Here we assessed whether color categorization and naming involve distinct brain circuits by combining resting-state functional connectivity and behavioral measures. Individual patterns of connectivity show pronounced intersubject variability, specific enough to allow identifying individual subjects by their connectivity fingerprints (Finn et al. 2015). Moreover, for a wide variety of cognitive functions, correlations exist between individual behavioral scores and the connectivity of the involved brain regions. People who are more proficient at a given task, as measured with accuracy or response times (RTs), show stronger functional or structural connectivity between regions required to perform the task (see Thiebaut de Schotten et al. 2011 for visuospatial attention; Finn et al. 2015 for fluid intelligence; Galeano Weber et al. 2017 for working memory; Stevens et al. 2017 and López-Barroso et al. 2020 for reading efficiency; Rosenberg et al. 2020 for sustained attention). The strength of brain connectivity may be sensitive to even small behavioral differences, such as the amount of words read per minute (López-Barroso et al. 2020). Therefore, demonstrating a correlation between behavioral measures and functional connectivity can be used to identify brain areas involved in a given task.
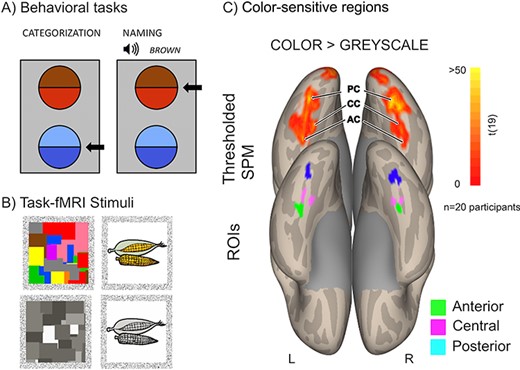
Behavioral assessment and task fMRI. (A) Example displays in the color categorization and color naming tasks. Arrows indicate correct responses. (B) Example stimuli in the task fMRI localizer experiment. (C) Color-sensitive regions defined with a contrast of color versus gray scale. Top row: SPM map thresholded at P = 0.001 voxelwise and P = 0.05 clusterwise (with nonparametric 3DClustSim correction). Bottom row: ROIs.
Following this approach, we used resting-state functional connectivity to verify whether RT variability in color naming and color categorization is linked to neural variability in identical or in distinct brain systems. To this end, we first identified occipitotemporal color-sensitive regions (Lafer-Sousa et al. 2016) and assessed individual performance in a nonverbal color categorization task and a verbal color naming task. We then studied the functional connectivity of those color regions, focusing on the left color regions, linked to color naming in lesion studies (reviewed in Siuda-Krzywicka and Bartolomeo 2019). We showed that distinct, nonoverlapping resting-state networks are correlated with RTs in color naming and in color categorization. Moreover, we showed that this dissociation fits with the brain lesions and the connectivity pattern observed in a patient with color anomia but spared color categorization (Siuda-Krzywicka et al. 2019b). Our results support the hypothesis that color naming and categorization are supported by distinct neural circuits in the human brain.
Materials and Methods
Participants
Twenty participants (6 females, aged 49.5 ± 7.24 years) took part in the study. All were right-handed according to the Edinburgh Inventory (Oldfield 1971), had normal or corrected-to-normal vision, and showed normal color vision on the Ishihara color plates test. The present research was promoted by the Inserm (CPP C13-14) and approved by the Ile-de-France I Ethical Committee. Before participating in this research, all participants signed an informed consent form. Eighteen participants performed behavioral color categorization and a color naming tasks (Fig. 1A, Siuda-Krzywicka et al. 2019b).
Behavioral Assessment of Color Categorization and Color Naming
Participants took part in a behavioral color categorization and color naming tasks. The details on both procedures can be found in Siuda-Krzywicka et al. (2019b). Briefly, each stimulus consisted in a bipartite disc, comprised of 2 colors (Fig. 1A). The categorical membership of the 2 colors as well as their perceptual distance were controlled through preliminary naming experiment and distances in CIELUV space. Each trial started with the presentation of a central, black fixation cross (1 deg visual angle) for 500 ms. Then 2 bipartite discs appeared, one above the other, aligned with the central meridian of the screen. In the color categorization task, subjects had to identify the disc containing colors from the same category. In the color naming task, the trial started with the auditory presentation of a prerecorded color name and the subjects’ task was to indicate the bipartite disc containing the named color. It is important to note here that this task would be better described as “color name matching”, because the participants did not produce a color name. However, the crucial component for the present study is the mandatory retrieval of a correct name as a response to a visual stimulus. This component is common to both our name matching task and the classical naming task. We thus decided to use the term “color naming” throughout the manuscript for the sake of simplicity and brevity.
Subjects responded by pressing the upper arrow key with their right hand to indicate the upper disc or the lower key for the lower disc. There was no time limit for responses. There were 157 trials in each experimental block. Subjects performed 2 experimental blocks of each task, but only data from the second block of each task are reported and correlated with brain connectivity measures. RTs were log transformed, and trials 3 standard deviations (SDs) above or below the mean RTs were excluded, subject-wise, from the analysis. RTs were z-scored before relating to connectivity measures.
Task fMRI
Behavioral Procedure
The task functional magnetic resonance imaging (fMRI) localizer procedure followed the classical work in the field of functional specificity in the human brain (Kanwisher 2010) and adapted from Mongelli et al. (2016). For the color localizer, we used pictures from 5 categories (see Fig. 1B): chromatic and achromatic Mondrians and objects in congruent color (e.g., a yellow banana), incongruent color (e.g., a blue banana), and gray scale (e.g., a gray banana). For the domain localizer, we used 6 categories of achromatic pictures: faces, tools, houses, pairs of words, pairs of numbers, and body parts. In both localizer experiments, stimuli were presented in thirty 8-s blocks alternating with 7.8 s of rest. Each stimulation block included 8 pictures from 1 category of stimuli, displayed for 600 ms and followed by a 400-ms blank screen. Participants were asked to press a button with their right thumb whenever a picture was identical to the previous one, which was the case for 20% of stimuli (1–3 repetitions/block). For details see Siuda-Krzywicka et al. (2019b).
Acquisition Parameters
We used a multiband echo-planar imaging (EPI) sequence sensitive to brain oxygen level–dependent (BOLD) contrast (45 contiguous axial slices, 2.5-mm isotropic voxels, in-plane matrix ¼ 80 80; time repetition (TR) ¼ 1022 ms; angle ¼ 62, time echo (TE) ¼ 25 ms). For the color localizer, 482 volumes were acquired, for the domain localizer 576. Five additional BOLD volumes with reverse phase encoding direction were also acquired for each localizer.
Data Preprocessing and Statistical Analysis
Functional images were realigned, treated with the FSL “Topup” toolbox in order to correct EPI distortions due to B0 field inhomogeneity (Andersson et al. 2003), normalized to the standard Montreal Neurological Institute (MNI) brain space and spatially smoothed with an isotropic Gaussian filter (6-mm full-width at half-maximum, FWHM).
First-level analysis was implemented in SPM12 software (https://www.fil.ion.ucl.ac.uk/spm/software/spm12/). Data were high-pass filtered and modeled by regressors obtained by convoluting the experimental conditions and the button presses with the canonical SPM hemodynamic response function (a combination of 2 gamma functions, with a rise peaking around 6 s followed by a longer undershoot). Individual contrast images were computed in order to identify 1) color-sensitive regions (colored minus gray-scale images), 2) the Visual Word Form Area (VWFA, words minus numbers), and 3) the object-sensitive lateral occipital cortex (LOC, Tools minus an average of Faces and Places). Those images were smoothed with an isotropic Gaussian filter (6-mm FWHM) and entered into a second-level whole-brain 1-sample t-test.
Resting-State fMRI
Image Acquisition
We acquired a 10-min series of whole-brain resting-state BOLD sensitive images (gradient-echo EPI sequence, 45 slices, slice thickness = 3 mm, Field of View 2203 220 mm, A > > P phase encoding direction, TR = 2990 ms, TE = 26 ms, flip angle = 90 deg).
Data Preprocessing
Data preprocessing and statistical analysis was performed with the CONN v.17 functional connectivity toolbox (Whitfield-Gabrieli and Nieto-Castanon 2012). We used standard preprocessing steps including slice-time correction, realignment, segmentation of structural data, normalization into standard stereotactic MNI space, and spatial smoothing using a Gaussian kernel of 6-mm FWHM. To account for the fMRI signal attenuation, after slice-time correction, realignment, motion-correction, and normalization, functional scans were subjected to intensity-based masking (Peer et al. 2016; see also Siuda-Krzywicka et al. 2019b). We then used the Artifact Detection Tool (https://www.nitrc.org/projects/artifact_detect/) to identify scans exceeding 3 SD in mean global intensity and scan-to-scan motion that exceeded 0.5 mm. We regressed out those scans as nuisance covariates in the first-level analysis, together with the head motion parameters (3 rotation and 3 translation parameters). Physiological and other spurious sources of noise were estimated with the CompCor method (Behzadi et al. 2007; Whitfield-Gabrieli et al. 2009; Chai et al. 2012); they were then removed together with the movement- and artifact-related covariates mentioned before. We applied a temporal band-pass filter of 0.008–0.09 Hz.
The anterior and posterior middle temporal gyrus (MTG) regions of interests (ROIs) were defined based on the Harvard–Oxford atlas implemented in the CONN toolbox. For the anterior temporal lobe (ATL), ROI identified in a patient with color anomia, a binary mask was created from a map reported in Siuda-Krzywicka et al. (2019b) (Fig. 4B).
Statistical Analysis
Seed-to-voxel whole-brain connectivity first-level maps were created for each participant. The average BOLD time course was extracted from 6 ROIs corresponding to the posterior color (PC), central color (CC), and anterior color (AC) region in each hemisphere. The individual Z-maps were entered to a second-level group analysis. In the group analysis, an F test refers to a series of 1D contrasts, each corresponding to 1 seed testing against the null hypothesis that the effect of a given ROI equals to 0. To generate functional connectivity maps representing the unique connectivity patterns for each color region, we used semipartial correlation coefficients. We calculated the connectivity values from a given seed, regressing out the time courses of all other seeds.
We analyzed the correlations between behavior and functional connectivity by setting up a linear regression model with Fisher-r-to-z-converted connectivity values (bivariate correlation coefficients) as dependent variable, in each voxel for whole-brain analyses, or averaged within a given brain region for ROI analyses. Participants’ age, gender, and categorization or naming log-transformed RTs were used as predictors. For the ROI analysis, we additionally performed bootstrapping and calculated bootstrapped confidence intervals (CIs) on the resulting regression coefficients for the RTs.
Unless stated otherwise, we applied nonparametric cluster size thresholding at P < 0.05 uncorrected.
Results
Color Categorization and Color Naming Behavior
In the color categorization task (Fig. 1A, see Materials and Methods section), the participants were mean = 89 ± SD = 4% accurate and on average responded in 2.08 ± 0.64 s. In the color naming task, they responded with 99 ± 1% accuracy with an average RT of 1.12 ± 0.2 s. There was virtually no variance in color naming accuracy (variance σ2 = 0.0002), preventing statistical inference on this variable, as well as comparisons with color categorization accuracy. For the test–retest reliability scores for the behavioral measures, see Supplementary Figure S2A,B.
Color-Sensitive Regions in the Brain Localized with Task fMRI
All participants participated in a task fMRI experiment in which they viewed images of colored and gray-scale objects and abstract Mondrians (Fig. 1B and Materials and Methods section). A group-level contrast of colored minus gray-scale images revealed a medial ventro-occipital cluster of activity ranging from the early visual areas to the parahippocampal cortex (PHC). Color signals in the early visual cortices do not correspond to the perceptual color space in primates (Brouwer and Heeger 2009; Bohon et al. 2016); therefore, for the subsequent analysis we focused on the areas anterior to the early visual cortices (anterior to MNI y = −80). Congruent with previous reports (Lafer-Sousa et al. 2016), we identified 3 color-sensitive regions in both hemispheres, namely: a PC region (MNI 30 −72 −10 and −32 −76 −16), corresponding to areas V4/VO1; a CC region (MNI −32 −56 −12 and 34 −50 −20), adjacent to the anterior border of area VO2 and an AC region (MNI −34 −44 −22 and 22 −44 −20) at the border of the anterior fusiform and parahippocampal gyri (Fig. 1C). This allowed us to define 6 regions that served as seeds for the subsequent connectivity analyses. Each seed consisted in the 50 voxels with the highest activation (β-value) in the averaged SPM map (Fig. 1C) located within 8 mm of the above peaks (Materials and Methods section).
Resting-State Connectivity of the Color-Sensitive Regions
We first investigated the overall functional connectivity of the 6 color-sensitive seeds defined before, using a whole-brain omnibus F test (Fig. 1C, see Materials and Methods section). Connected regions encompassed the entire occipital cortex, including both ventral and dorsal aspects and more distant brain areas in the bilateral superior temporal gyri (STG) and frontal cortex (Fig. 2A; P = 0.001 voxelwise, P = 0.05 False Discovery Rate (FDR)-corrected clusterwise).
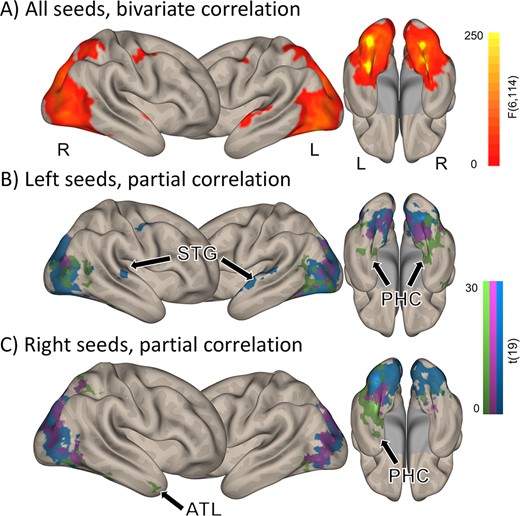
Resting-state connectivity of the 6 ROIs. (A) Brain regions connected to at least one of the 6 color seeds, as computed with an F test. (B–C) Unique connectivity patterns as assessed with partial correlations, for the left- (B) and right-hemispheric (C) seeds. Voxelwise P < 0.001, clusterwise P < 0.05 FDR corrected. Arrows indicate STG, PHC, and the ATL.
To characterize the unique connectivity pattern of each seed, we used partial correlations. For each seed, we identified connected regions while partialling out the contribution of all other seeds (see Materials and Methods section). This analysis revealed a significant and unique pattern for each color seed (Fig. 2B,C; P = 0.001 voxelwise, P = 0.05 FDR-corrected clusterwise), beyond its immediate surrounding. Particularly, the left PC seed was connected to the left STG (Fig. 2B), whereas the AC seeds in both hemispheres were connected to the ventral temporal lobes and the PHC.
Color Naming and Functional Connectivity of the Left-Hemispheric Color-Sensitive Regions
To investigate how individual differences in color naming RTs relate to the connectivity pattern of left-hemispheric seeds, we set up a linear regression model. In this model, voxelwise connectivity values (bivariate correlation coefficients) with left color seeds served as dependent variable, and participants’ age, gender, and mean log-transformed RTs in the color naming task as predictors (see Fig. 1A and Materials and Methods section). For clarity, we converted regression β-coefficients for color naming RTs to partial correlation coefficients, controlling for the effects of age and gender (see Materials and Methods section).
Figure 3A shows the correlation maps of the left color seeds, that is, regions whose connectivity with the left color seeds was correlated with color naming RTs (see Materials and Methods section for details). Shorter color naming RTs corresponded to stronger connectivity between the left color seeds and the left-predominant MTG, the left angular and precentral gyri, as well as left frontal areas (P = 0.01 voxelwise, P = 0.05 clusterwise, for right-sided seeds see Fig. 3B). To investigate the specific effect of each of the left color seeds, we performed t tests comparing the correlation maps of 1 color seed to the average correlation map of the remaining 2. The left posterior seed connectivity was more correlated with color naming RTs in the left anterior MTG, the left angular gyrus, and anterior frontal regions (Fig. 3C and Supplementary Fig. S1B, P = 0.005 voxelwise and 0.05 clusterwise; for the corresponding map of the left anterior seed, see Supplementary Fig S1C). These left middle temporal clusters overlapped with the regions that were functionally disconnected from color-sensitive visual cortex in a patient with color anomia (see Fig. 4A and Siuda-Krzywicka et al. 2019b). Accordingly, participants who were faster at naming colors had stronger functional connectivity between the left posterior seed and the anterior temporal clusters disconnected in this patient (Fig. 4A–C, r(14) = −0.65, P = 0.009, see Materials and Methods section).
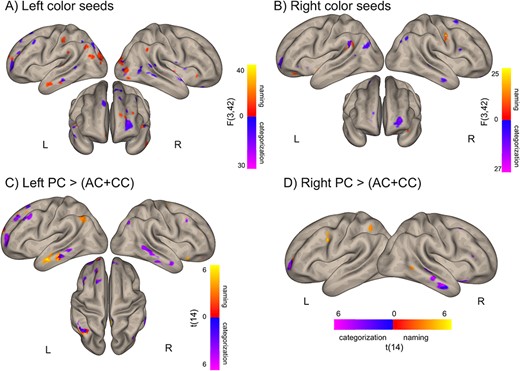
Distinct networks for color categorization and color naming. (A,B) Brain regions where the connectivity (bivariate correlation coefficients) to at least one of the left (A) or right (B) color seeds correlated with color naming (red-yellow) or categorization (blue-purple) RTs (F test, see Materials and Methods section). (C,D) Brain areas where correlation with naming or categorization RT is stronger for the PC seeds than for the AC and CC seeds in the left (C) and right (D) hemisphere. Voxelwise thresholds: (A,B) 0.01 (C,D) 0.005; nonparametric clusterwise threshold: P < 0.05 uncorrected.
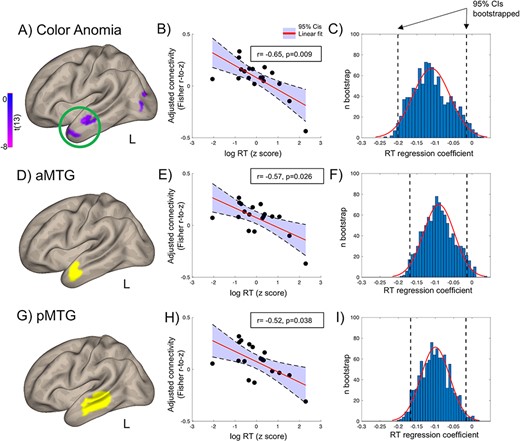
ROI analysis. Color naming RTs correlated with the left PC connectivity (bivariate correlations, adjusted for participants’ age and gender) with: (A–C) brain regions disconnected from color-sensitive cortex in a color anomic patient (green circle in A, Siuda-Krzywicka et al. 2019b); (D–F) the left anterior MTG; (E–I) the left anterior MTG. Boxes in (B,E,H) depict partial correlation coefficients of RTs correlated with PC–ROI connectivity, controlling for age and gender. (C,F,I) Bootstrapped regression estimates. RT effects in all 3 ROIs were significant with bootstrapping, note 95% confidence intervals limits below 0. The anatomical ROIs come from the Harvard–Oxford Atlas (Desikan et al. 2006).
Analyses using anatomically defined ROI confirmed the above voxelwise results (Fig. 4D–I and Materials and Methods section): Shorter color naming RTs corresponded to stronger connectivity between the left posterior seed and the left MTG (r(14) = −0.57, P = 0.026 and Fig. 4D–F for its anterior portion, and r(14) = −0.52, P = 0.038, Fig. 4G–I for its posterior portion).
We then investigated whether the link between naming RTs and functional connectivity was specific to seeds located in color-sensitive cortex. To this end, we computed the correlation of naming RTs with the connectivity of the left MTG with the left LOC (MNI −50 −68 −6) and with the VWFA (MNI −44 −40 −20, see Supplementary Fig. S1C). Neither of those correlations were significant (see Supplementary Tables S1 and S2). This supports a specific involvement in color naming of the coupling between the left PC seed and the left MTG.
Color Categorization and Functional Connectivity of the Left Color-Sensitive Regions
Following the same method as in the previous section, we studied the correlation between individual RTs from the color categorization task (Fig. 1A) with the functional connectivity of color seeds. To compare resting-state networks involved in color naming to the networks involved in color categorization, we focused on the left color seeds and the PC seed in particular. Figure 3A presents the overlap between categorization and naming correlation maps involving the left seeds. Shorter categorization RTs corresponded to stronger connectivity between the left color seeds and the left superior frontal gyrus, the left superior parietal cortex, bilateral inferior frontal, and temporal areas as well as the occipital pole (Fig. 3A, medial occipital connectivity not presented, P = 0.01 voxelwise; P = 0.05 clusterwise). Compared with the other 2 left color seeds, the posterior seed’s connectivity was more correlated with RTs in the left anterior middle frontal gyrus and the right MTG (Fig. 3C, P = 0.005 voxelwise and P = 0.05 clusterwise, for the corresponding map of the left anterior seed, see Supplementary Fig. S1D).
Importantly, the networks identified for the naming and categorization tasks were different. First, regions where left seeds connectivity correlated with categorization RTs were distributed across both hemispheres, whereas regions correlated with naming RTs predominated in the left hemisphere (Fig. 3A,C). Second, there was a minimal overlap between regions involved in the 2 tasks, even when thresholding maps at P = 0.01 voxelwise (Fig. 3A).
Exploratory Analysis of Color Naming and Categorization Effects on Functional Connectivity of Right Color Seeds
To explore possible overlaps between categorization and naming brain networks stemming from the right color seeds, we repeated the same analyses, but using the connectivity patterns of right seeds as the dependent variable. In Figure 3B we plotted the 2 correlation maps and their overlap (P = 0.01 voxelwise and P = 0.05 clusterwise). Color categorization RTs correlated with right-sided color cortex connectivity to distributed frontal regions (left inferior and anterior middle frontal gyri, right superior frontal gyrus), right supramarginal, angular, and MTGs (Fig. 3B). Regions where right color seeds connectivity correlated with color naming RTs were limited to the left angular, right postcentral, and left orbitofrontal gyri (Fig. 3B). Interestingly, left and right posterior seeds showed stronger color categorization RTs modulation of connectivity with similar left frontal and right temporal regions (see purple clusters in Fig. 3C,D, P < 0.005 voxelwise, P < 0.05 clusterwise).
Discussion
We investigated the functional connectivity patterns of the 3 color-sensitive regions lying in the bilateral ventral occipitotemporal cortex, namely the PC, CC, and AC regions. We showed that those regions have distinct connectivity patterns that encompass both early visual cortices and high-level supramodal frontal and temporal areas (see Supplementary Fig. S4 for the potential effects on anatomical distances on color connectivity maps). These distinct connectivity patterns indicate that the 3 color regions may have different functional profiles, an idea put forward in the literature of high-level color processing (Conway 2018; Siuda-Krzywicka and Bartolomeo 2019). Here, we show that the connectivity of the color regions shows different spatial patterns of correlation with RTs in naming and categorization tasks.
Color Categorization Without Language
To our knowledge, we present here a first attempt at identifying the neural substrate of color naming and categorization using brain connectivity measures. We showed, on the one hand, that color naming speed was related to the connectivity between the left middle temporal and angular gyri and a very specific sector of the visual cortex, namely the left PC region. On the other hand, color categorization speed was related to the connectivity between left frontal, right temporal, bilateral parietal areas, and the bilateral PC regions. Consistent with our previous report (Siuda-Krzywicka et al. 2019b), all the structures involved in categorization (apart from the left PC region) were spared in a severely color anomic patient with spared color categorization. Overall, we demonstrate that different neural systems underlie naming and categorization and that the 2 processes can show dissociated impairments (see also Garcin et al. 2018b for categorization deficits in frontal patients without naming impairments).
Color categories could rely on domain-general mechanisms of semantic knowledge organization, rather than being a purely perceptual or linguistic process (reviewed in: Siuda-Krzywicka et al. 2019a). The frontal portions of color categorization networks identified in this study agree with findings in humans and macaques (Lafer-Sousa and Conway 2013; Bird et al. 2014; Haile et al. 2019) and suggest that color categorization may rely on brain systems engaged in attention and task demands (see Supplementary Fig. S3 for potential effects of response inhibition on the present results). In addition, other, behavioral evidence in humans suggests that attention could explain the category effect on color discrimination, that is, easier discrimination of equidistant colors stemming from different categories, as opposed to same category colors (Witzel and Gegenfurtner 2015). The right temporal component of the categorization network reported here is congruent with a recent finding that cortical thickness of the right ATL was modulated by individual differences in RTs in a noncolor categorization task (Garcin et al. 2018a). Based on the above, we would like to propose that color categorization can be viewed in the framework of controlled semantic cognition (Lambon Ralph et al. 2017). In this framework, semantic cognition depends on the interaction between executive processes subtended by frontal regions and semantic content resulting from the interplay between anterior temporal semantic “hubs” and sensory “spokes” providing perceptual inputs. PC regions could play the role of spokes and provide perceptual color input to the right temporal cortex holding the content of color categories. Frontoparietal regions would play a crucial role in accessing, retrieving, and executively manipulating color categorization through attention allocation and adaptation to task demands. This model does not entail a contribution of language and could therefore explain categorical responses to color in both humans and nonhuman primates and consequently provide a universal, language-independent neural framework for color categorization (Siuda-Krzywicka et al. 2019a).
A Color Naming Hub?
We showed that color naming speed correlates with the connectivity between the left PC region and the left MTG. This result prevailed only for the left PC region, and we found no such correlation in the neighboring lateral occipital complex or the VWFA (see Supplementary Fig. S1A and Supplementary Table S4). The MTG cluster revealed in our analyses overlapped with regions disconnected from color-sensitive visual cortex in a patient with color anomia (Siuda-Krzywicka et al. 2019b), and the participants’ color naming speed correlated strongly with the connectivity of the PC region and this disconnected region (see Fig. 4A–C). These converging results indicate that the communication between the left PC region and the left MTG is causally related to color naming abilities. We suggested that the left-sided color-sensitive regions may act as a cortical naming hub linking color perception with color names (Siuda-Krzywicka and Bartolomeo 2019; Siuda-Krzywicka et al. 2019b). The current results allow us to narrow down this hypothesis to the PC region, which would serve as the color naming hub and whose lesions would lead to color anomia.
Note that the left PC region was not connected with the left MTG when averaging all subjects (without accounting for the color naming speed, see Fig. 2). This is due to the large variability in connectivity strength between our participants. As visible in Figure 4B,E,H, individual connectivity ranged from positive to negative values, yielding no significantly positive connectivity for the group as a whole. According to our results, the strength of this connectivity modulates naming speed. Hence, we predict that color naming experts, who are trained by their profession to identify and communicate colors by names, should show higher connectivity between the left PC region and left MTG.
Using individual rather than group-level ROIs would have been appropriate in probing the individual link between connectivity and response speed. However, the duration of the activation experiment did not provide sufficient power to obtain reliable individual color ROIs in each participant. The group-level ROIs that we used were highly significant, indicative of good intersubject stability, and consistent with the current state of the literature (see Fig. 1C and Lafer-Sousa et al. 2016).
Using RTs as a Measure of Individual Variability in Color Naming and Color Categorization
We used RTs in color naming and categorization as a proxy for participants’ color categorization and color naming ability. This index may also be sensitive to individual motivation, visuomotor processing speed, or domain-general language processing speed. However, those parameters are unlikely to account for our results. Indeed, we limited the analyses to networks seeded from color-sensitive regions, ensuring that effects were specific to cortical color processing. Also supporting the specificity of our findings, we found no correlation between color naming RTs and the connectivity of neighboring occipital areas such as the VWFA or the LOC (Supplementary Table S4). Moreover, we included in the analyses only the responses from the second block of the tasks (see Materials and Methods section), in order to discard individual differences in how quickly participants mastered the task.
Differences in categorization and naming RTs could also reflect differences in the precise setting of the boundaries between color categories. Color categories and color names vary substantially across cultures and languages (e.g., Roberson et al. 2005). Even within 1 culture, people vary in their choice of labels, when they describe colored items (e.g., Lindsey and Brown 2014; Brown et al. 2016; Gibson et al. 2017; Kuriki et al. 2017) or when they sort colors into categories (reviewed in: Witzel 2018). RTs in categorization tasks are modulated by categorical membership of colors: people are faster in categorizing and naming colors with clear category membership than colors that are more ambiguous (Bornstein and Monroe 1980; Zimmer 1982). In the present study, the category membership of colored stimuli was carefully controlled in an independent color naming experiment (see details in Siuda-Krzywicka et al. 2019b). As there was a full consensus on the category membership of our stimuli, it is more likely that individual differences in color naming and categorization RT reflected the speed with which colors reach the verbal lexicon and domain-general categorization networks, for the 2 tasks respectively. This interpretation is consistent with previous reports on links between RTs and brain connectivity measures (López-Barroso et al. 2020) and between RTs and the anatomy of brain structures relevant to categorization (Garcin et al. 2018a).
Conclusions
Our findings show that color categorization and color naming are processed in separate brain networks, providing clear pathophysiological background to dissociations observed in patients with brain damage (reviewed in: Siuda-Krzywicka and Bartolomeo 2019). Our results suggest a novel answer to the long standing debate on the role of language versus perception in color categorization (Siuda-Krzywicka et al. 2019a). Color categorization would depend on a specific network, involving frontoparietal executive regions, right temporal regions, and the bilateral, PC regions. This network, which goes far beyond color-sensitive regions of the visual cortex, is distinct from the color naming network, which comprises the left PC region and the left MTG.
Notes
The authors would like to thank Tal Seidel-Malkinson for advice and discussion and Myriam Taga and Emma Chabani for their help with experimental design. Conflict of Interest: None declared.
Funding
Institut du Cerveau (ICM); Institut national de la santé et de la recherche médicale (INSERM); Centre national de la recherche scientifique (CNRS); the Agence Nationale de la Recherche program “Investissements d’avenir” (grant ANR-10-IAIHU-06); Ecole des Neurosciences Paris Ile de France to K.S.K; the Deutsche Forschungsgemeinschaft “Cardinal Mechanisms of Perception” (grant SFB TRR 135 to C.W).