


Abstract
Sex chromosome aneuploidies, a group of neurogenetic conditions characterized by aberrant sex chromosome dosage (SCD), are associated with increased risks for psychopathology as well as alterations in gray matter structure. However, we still lack a comprehensive understanding of potential SCD-associated changes in white matter structure, or knowledge of how these changes might relate to known alterations in gray matter anatomy. Thus, here, we use voxel-based morphometry on structural neuroimaging data to provide the first comprehensive maps of regional white matter volume (WMV) changes across individuals with varying SCD (n = 306). We show that mounting X- and Y-chromosome dosage are both associated with widespread WMV decreases, including in cortical, subcortical, and cerebellar tracts, as well as WMV increases in the genu of the corpus callosum and posterior thalamic radiation. We also correlate X- and Y-chromosome-linked WMV changes in certain regions to measures of internalizing and externalizing psychopathology. Finally, we demonstrate that SCD-driven WMV changes show a coordinated coupling with SCD-driven gray matter volume changes. These findings represent the most complete maps of X- and Y-chromosome effects on human white matter to date, and show how such changes connect to psychopathological symptoms and gray matter anatomy.
Introduction
Alterations in sex chromosome dosage (SCD) are known to have both neuroanatomical and behavioral consequences in humans. Specifically, structural magnetic resonance imaging (sMRI) studies in individuals with sex chromosome aneuploidies (SCAs), a collectively common (Nielsen and Wohlert 1991; Hong and Reiss 2014; Samango-Sprouse et al. 2016) set of neurogenetic conditions characterized by variations in SCD, have demonstrated notable changes in cortical and subcortical structures relative to typically developing euploidic controls (Bryant et al. 2011, 2012; Lepage et al. 2014; Lin et al. 2015; Raznahan et al. 2016; Reardon et al. 2016; Mankiw et al. 2017; Nadig et al. 2018). Moreover, these structural changes appear to be concentrated within systems subserving domains of cognition and behavior that are impacted in SCA conditions, including those responsible for language/socio-emotional processing (Raznahan et al. 2016), higher order cognition (Reardon et al. 2016), and motor control (Mankiw et al. 2017), as well as pathways relevant to psychopathological and neurodevelopmental disorders, which are commonly comorbid with SCA (Nadig et al. 2018). However, to date, most studies of regional brain anatomy have focused on SCD-associated alterations in gray matter structures, without an accompanying comprehensive examination of potential SCD-associated alterations in white matter structures. Such an evaluation would not only help provide a more complete characterization of altered brain organization in SCA conditions, but may also help to address more general questions regarding the coordination of gray and white matter changes in neurogenetic disorders, as well as the potential relevance of these changes for symptomatology.
There is preliminary evidence for SCD modulation of regional white matter volume (WMV) and fractional anisotropy (FA) from studies comparing individual SCA karyotype subgroups to controls, including: 45, X monosomy (Turner’s Syndrome: Yamagata et al. 2012; Zhao and Gong 2017) 47, XXY syndrome (Klinefelter’s syndrome: Bryant et al. 2011; Lentini et al. 2013), and 47, XYY syndrome (Bryant et al. 2012; Lepage et al. 2014). These changes have also been empirically linked to behavioral dimensions (i.e., increased FA in the superior longitudinal fasciculus was associated with scores on a cognitive subdomain in girls with Turner’s syndrome; Yamagata et al. 2012). These studies on individual SCA subgroups suggest that alterations in both X- and Y-chromosome dosage may influence white matter tracts within the human brain, and that those changes may have functional correlates. However, to date, there are no available reports that harness multiple SCA groups to simultaneously model the effects of SCD variation on local white matter anatomy.
Measuring neuroanatomical differences across a range of SCA subgroups (and therefore in a range of SCD contexts) has a few important advantages over studies in one syndrome. Specifically, this approach allows any changes to be more directly tied to chromosomal—rather than confounding gonadal or hormonal—effects (by permitting, for example, XY-XXY, XY-XXXXY, and XXY-XXXXY comparisons; Raznahan et al. 2016). Additionally, a cross-SCA approach facilitates examination of the similarities and differences between the effects of X- versus Y-chromosome dosage—which is important because previous studies have revealed notable overlap in X-chromosome- and Y-chromosome-driven changes in structure (Bryant et al. 2012; Raznahan et al. 2016: Reardon et al. 2016; Mankiw et al. 2017; Nadig et al. 2018; Xenophontos et al. 2020) and function (Ross et al. 2009; Lee et al. 2012). Finally, anatomical alterations that are observed across all SCAs would represent candidate convergent phenotypes for examination in neurogenetic disorders involving gene-dosage abnormalities outside of the sex chromosomes (Owen et al. 2014; Kikinis et al. 2017; Villalón-Reina et al. 2020).
A more complete understanding of SCD-associated white matter changes also has relevance for several open questions in basic neuroscience. First, because disparity in X- and Y-chromosome dosage is the foundational genetic difference between XY males and XX females, understanding SCD effects on local white matter tracts may inform our mechanistic understanding of known regional WMV sex-differences that have been reported in typically developing populations (Lenroot et al. 2007; Mills et al. 2016; Ritchie et al. 2018). Second, extending analysis of SCD effects on gray matter (Raznahan et al. 2016; Reardon et al. 2016; Fish et al. 2017; Mankiw et al. 2017; Nadig et al. 2018) to include examination of white matter would enable a test for the potential coordination of genetic influences on the two major tissue classes of the brain (Raznahan et al. 2016; van Hemmen et al. 2016; Arnold 2020). Previous reports demonstrating that the relative ratios of global gray and white matter differ across evolutionary time (Zhang and Sejnowski 2000; Herculano-Houzel et al. 2010), diverge between males and females (Gur et al. 1999; Lüders et al. 2002), have different developmental trajectories (Lenroot et al. 2007; Mills et al. 2016), and show distinct changes as a function of brain size (Barnes et al. 2010) in humans might suggest limited spatial coherence in the patterning of white and gray matter alterations in SCA conditions. Conversely, congruent SCD effects on regional GMV and WMV might be predicted from prior work suggesting shared genetic influence on white and gray matter structures in typically developing populations (Kochunov et al. 2011; Shen et al. 2016). Such congruence might also arise from joint involvement of gray matter regions and the white matter tracts connecting them. Comprehensive examination of white and gray matter changes as a function of SCD would help to resolve these questions related to the patterning of genetic effects on the human brain.
Thus, here, using a unique dataset of individuals with varying X- and Y-chromosome dosage (80 XX, 89 XY, 28 XXX, 58 XXY, 26 XYY, 20 XXYY, 5 XXXXY), we build off our previous work on SCD-associated gray matter changes in the human brain to explore potential SCD-associated alterations in white matter structure. We use voxel-based morphometry (VBM) on sMRI scans. To provide a comprehensive view of regional WMV changes across individuals with varying SCD, we first model the effects of both X- and Y-chromosome dosage on voxelwise WMV. To directly examine the association between anatomical differences and known clinical consequences of SCA [i.e., increased risk for ADHD, anxiety, and depression: Hong and Reiss 2014; van Rijn 2019] we next correlate these SCD-driven WMV changes with measures of internalizing and externalizing psychopathology. Finally, to produce an integrated understanding of gray and white matter alterations across variation in SCD, we model regional GMV changes as a function of SCD in this cohort, and then determine the degree of spatial congruence between SCD-driven WMV and GMV changes.
Materials and Methods
Participants
Our core sample included 306 youth (aged 5–25) with varying SCDs: 137 individuals with SCA (28 XXX, 58 XXY, 26 XYY, 20 XXYY, and 5 XXXXY) and 169 age-matched euploidic controls (80 XX and 89 XY). Written informed consent was obtained from all participants, and the study was approved by the National Institutes of Health (NIH) Institutional Review Board (Clinical trial reg. No. NCT00001246, clinicaltrials.gov; Protocol number: 89-M-0006). Demographic and clinical characteristics are displayed in Table 1.
Participant characteristics
| Characteristic | SCA Subgroup | ||||||
|---|---|---|---|---|---|---|---|
| XX | XY | XXX | XXY | XYY | XXYY | XXXXY | |
| Sample size | 80 | 89 | 28 | 58 | 26 | 20 | 5 |
| Age (years) | |||||||
| Mean | 12.8 | 12.8 | 12.3 | 12.8 | 12.4 | 14.1 | 12.8 |
| SD | 5.07 | 4.61 | 5.68 | 4.93 | 4.91 | 5.45 | 4.82 |
| Range | 5.39–25.13 | 5.24–25.5 | 5.02–24.78 | 5.21–25.97 | 5.71–23.05 | 5.07–22.96 | 7.66–17.17 |
| Tanner stage | |||||||
| 1 | 20 | 24 | 7 | 18 | 9 | 7 | 2 |
| 2–3 | 25 | 28 | 12 | 22 | 11 | 6 | 1 |
| 4–5 | 34 | 34 | 9 | 17 | 6 | 7 | 1 |
| Unknown | 1 | 3 | 0 | 1 | 0 | 0 | 1 |
| FSIQ* (n = 291) | |||||||
| Mean | 116 | 115 | 92.5 | 96.5 | 91.0 | 86.8 | 55.7 |
| SES* (n = 305) | |||||||
| Mean | 47.2 | 47.8 | 40.9 | 55.2 | 58.8 | 46.2 | 68.8 |
| CBCL/ABCL Internalizing (n = 221) | |||||||
| Mean | 41.6 | 42.8 | 59.4 | 61.9 | 64.8 | 64.4 | 64.0 |
| SD | 6.35 | 7.78 | 11.6 | 10.7 | 9.82 | 9.16 | 5.89 |
| CBCL/ABCL Externalizing (n = 221) | |||||||
| Mean | 42.0 | 43.4 | 53.8 | 56.9 | 63.4 | 57.4 | 56.0 |
| SD | 7.31 | 8.40 | 12.7 | 10.8 | 9.31 | 8.6 | 15.2 |
Note: SES, socioeconomic status (from Hollingshead 2-factor index of parental occupation and education level). SD, standard deviation. Not all participants had FSIQ, SES, or CBCL/ABCL data; the counts for each measure denote the number of participants with complete data for that item, and from whom which the presented means were calculated.
*P < 0.01 for omnibus test of variation across subgroups.
The SCA group was recruited with the help of the NIH website and parental support groups. Supernumerary X-/Y-chromosome carriage was confirmed with karyotype tests. Exclusionary criteria for SCA participants included acute head injuries or neurological conditions that resulted in gross brain abnormalities, and mosaicism (with nonmosaicism confirmed through visualization of 50 metaphase spreads in peripheral blood). Euploidic controls were recruited through an ongoing longitudinal NIH study on typical brain development (Giedd et al. 2015). Exclusionary criteria for control participants included receipt of special education services or mental health treatment, use of psychiatric medication, or diagnosis of medical conditions that impact the nervous system.
During their visits to the NIH, participants also underwent cognitive assessments, physical examinations, and neuropsychiatric evaluations (see Table 1). Of note, these cohorts have previously been used to examine sex and SCD effects on cortical anatomy, subcortical anatomy, and behavioral outcomes (Lin et al. 2015; Raznahan et al. 2016; Reardon et al. 2016; Fish et al. 2017; Mankiw et al. 2017; Nadig et al. 2018; Warling et al. 2020; Xenophontos et al. 2020).
Image Acquisition and Processing
All participants had T1-weighted sMRI scans with contiguous 1.5-mm axial slices, obtained on the same 1.5-T General Electric SIGNA scanner using a 3D spoiled gradient recalled echo sequence and the following image parameters: echo time, 5 ms; repetition time, 24 ms; flip angle, 45; acquisition matrix, 256 × 192; number of excitations, 1; field of view, 24 cm.
Following visual inspection of native T1 scans to exclude images with motion artifacts, we performed VBM analysis using Statistical Parametric Mapping software (SPM12; http://www.fil.ion.ucl.ac.uk/spm) in Matlab. Images were corrected for magnetic field inhomogeneity and segmented into GM, WM, cerebrospinal fluid (CSF), skull, dura, and background (Ashburner and Friston 2005) categories. To encode spatial information with consideration to neighboring voxels, iterative weighting using hidden Markov random fields was applied in conjunction with a priori tissue probability maps (Zhang et al. 2001). Intersubject registration was achieved through the generation of custom subject-based templates, resampling to 1.5 × 1.5 × 1.5 mm3 voxels using the Diffeomorphic Anatomical Registration through Exponentiated Lie algebra procedure (Ashburner 2007), and transformation to Montreal Neurological Institute (MNI) space. Probability maps of tissue classes were modulated (multiplied by the Jacobian determinant of the deformation field from template to individual space) and smoothed using a 4-mm full-width at half-maximum (FWHM) Gaussian kernel, which calculated the voxelwise WMV and GMV values used in the following analyses. All normalized tissue probability maps also passed visual inspection for artifacts or inaccurate segmentation or normalization.
Statistical Analyses
SCD-Associated Local WMV Changes
This model was selected after running supplementary analyses that tested for, and ruled out, gonadal sex*chromosomal dose-interaction effects, and X chromosome dose*Y chromosome dose-interaction effects (which have been described in previous research: Raznahan et al. 2016), as well as ruling out age*sex chromosomal dose-interaction effects, and after confirming that the results were not modified when total tissue volume (i.e., tWMV + tGMV) was used as a covariate in place of tWMV. Voxelwise t-statistics associated with the β1 and β2 coefficients were corrected for multiple comparisons across voxels using the significance level of family-wise error (FWE < 0.05), as determined by AFNI 3dClustSim (following the May 2015 bug fix; Cox 1996), resulting in a t-map showing voxelwise WMV changes significantly associated with increased X-chromosome dosage, and a t-map showing voxelwise WMV changes significantly associated with increased Y-chromosome dosage. Anatomical labels of these significant regions were identified using a stereotaxic probabilistic DTI-based white matter atlas in the same (MNI) space (Mori et al. 2008).
We also examined potential spatial conjunction between X- and Y-dosage effects, using two methods. First, we completed a minimum t-conjunction analysis: we selected and visualized voxels that showed significant (i.e., surviving statistical correction) WMV changes with both increased X-chromosome dosage and increased Y-chromosome dosage, and that showed significant WMV changes in the same direction (i.e., increased WMV with increased X-/Y-chromosome dosage or decreased WMV with increased X-/Y-chromosome dosage), in a conjunction t-map. Additionally, we saved and reported the lower t-value between the original X- or Y-dosage map. Second, we calculated a spatial correlation (Pearson’s r) of the unthresholded X-dosage-associated t-map and the unthresholded Y-dosage-associated t-map. This r value was compared to a null distribution of r values computed by correlating X-dosage-associated t-maps and Y-dosage-associated t-maps following permutation of SCA labels across participants 1000 times. Finally, given the potential for overlap of X- and Y-dosage effects, we also examined the effects of total supernumerary SCA (i.e., pooled increases in X- or Y-dosage) on WMV, and compared them with the findings of our main model (see Supplementary Material).
Here, the internal and external metrics reflect the continuous internalizing or externalizing CBCL t-scores. Again, we applied the FWE < 0.05 significance level to correct for multiple comparisons. Surviving voxels (again, also visualized) were those showing significant interaction effects between X- and/or Y-chromosome dosage and internalizing and/or externalizing pathology on local WMV. Any surviving voxels were further filtered to include only those that showed significant interaction effects and significant main effects of X-/Y-chromosome dosage. Not all participants had CBCL or ABCL data, and so were excluded from this analysis (i.e., here, total n included = 221).
Coordination between SCD-Associated WMV and GMV Changes
As in the voxelwise WMV analyses, voxelwise t-statistics associated with the β1 and β2 coefficients were corrected for multiple comparisons across voxels using the FWE < 0.05 significance level, and t-statistics associated with surviving coefficients were visualized—resulting in two t-maps, one displaying voxelwise GMV changes significantly associated with X-chromosome dosage, and one displaying voxelwise GMV changes significantly associated with Y-chromosome dosage. We determined consistency between X- and Y-chromosome dosage effects on local GMV using the methods described above (i.e., using a minimum t-conjunction analysis, which generated a finalized conjunction t-map, as well as a Pearson’s correlation of the unthresholded X-chromosome-dosage associated t-map and the Y-chromosome-dosage associated t-map, which was compared with a null distribution of t-map correlations drawn from 1000 permutations of SCA labels across participants).
After the GMV analyses had been completed, we quantitatively interrogated the congruence between the SCD-associated WMV changes and SCD-associated GMV changes, based on known patterns of structural connectivity in the human brain. To do this, we harnessed an independent tractography atlas, the IIT Atlas (Zhang and Arfanakis 2018). The IIT Atlas contains a probabilistic white matter connectivity matrix that shows the absolute number of white matter tracts, which connect each pair of gray matter regions in the classical Desikan-Killinay cortical parcellation scheme (Desikan et al. 2006). Using this matrix, which was generated from a 72-subject healthy adult cohort entirely separate from our participant cohort, we identified each pair of cortical regions that had at least 50% of their connecting fibers passing through voxels showing statistically significant WMV changes as a result of increased X- and Y-chromosome dosage (i.e., voxels present in the conjunction WMV t-map). Next, we used a winner-take-all rule to transform the conjunction t-map from the GMV scaling results from MNI space to Desikan-Killiany space: each Desikan-Killiany parcel was compared with the conjunction t-map, and was assigned a “positive” designation if the majority of its voxels overlapped with voxels showing increased GMV with increased SCD, and a “negative” designation if the majority of its voxels overlapped with voxels showing decreased GMV with increased SCD. Finally, we assessed for significant overlap between the cortical regions identified using the WMV-led process and the cortical regions identified using the GMV-led process using Fisher’s exact tests.
Results
SCD Effects on Local WMV
The primary regression models revealed striking changes in local WMV as a function of both X-chromosome (Fig. 1A) and Y- chromosome (Fig. 1B) dosage (and after controlling for tWMV, age, and gonadal sex). These alterations were widespread throughout the brain and were regionally variable, with some areas showing increased WMV with increased X- and/or Y-dosage, and some areas showing decreased WMV with increased X- and/or Y-dosage. Notably, spatial correlation analysis revealed a high degree of overlap in X- and Y-chromosome effects on local WMV [r = 0.75, pperm = 0.001; Fig. 1C and D]. Increased X- and Y-dosage were both linked to increased WMV in the genu of the corpus callosum, as well as in the posterior thalamic radiation. Overlapping areas where mounting X- and Y-dosage both correlated with decreased WMV included the superior and anterior corona radiata, anterior and posterior limbs of the internal capsule, the external capsule, the inferior fronto-occipital fasciculus, sections of the corticospinal tract, the medial lemniscus, and the middle, lateral, and superior cerebellar peduncles (see Table 2 for the complete list of cortical regions showing WMV alterations with increased X- and Y-chromosome dosage). These changes were largely bilateral. Permutation testing confirmed the results were due to a statistically significant spatial conjunction between X- and Y-chromosome related changes in regional WMV (see Fig. 1D). Thus, there was a marked convergence of SCD effects on voxelwise WMV in terms of both spatial patterning (i.e., location within the brain) and “direction” of effect (i.e., increase vs. decrease in WMV), regardless of chromosomal identity. Supplemental analyses also indicated that these results were consistent when pooled SCD (i.e., increased X- or Y-dosage) was used as the independent variable in place of X-/Y-dosage (see Supplementary Material; Supplementary Fig. S1).
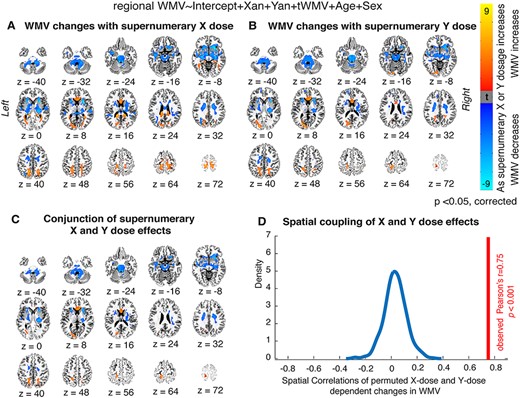
Local WMV changes as a function of X- and Y-chromosome dosage. (A, B) Thresholded t-maps, where colored regions represent cortical and subcortical tracts showing statistically significant WMV changes with (A) increasing supernumerary X-chromosome dosage, or (B) increasing supernumerary Y-chromosome dosage (P < 0.05 for all tracts after correction for multiple comparisons; blue represents areas where WMV decreases as chromosome dosage increases, and orange represents areas where WMV increases as chromosome dosage increases). (C) Conjunction t-map showing the high degree of overlap between areas where X-chromosome dosage affects WMV and areas where Y-chromosome dosage affects WMV (blue represents regions where WMV decreases with both mounting X- and mounting Y-chromosome dosage, and orange represents regions where WMV increases with both mounting X- and mounting Y-chromosome dosage). (D) Density plot demonstrating that the observed cross-voxel correlation between X- and Y-chromosome effects on local WMV is greater than 1000 correlations generated by randomly permuting SCA labels across participants.
Regions showing significant WMV changes with increased SCD (visualized in Fig. 1C)
| Anatomical region | Effect | MNI coordinates for X–Y convergence | Peak t in each region | Volume (mm3) | ||
|---|---|---|---|---|---|---|
| x | y | z | ||||
| External capsule (right) | Decrease | 25.5 | 16.5 | 3 | −7.4346 | 723 |
| Anterior corona radiata (right) | Decrease | 16.5 | 21 | −10.5 | −6.9957 | 589.5 |
| Fornix (cres)/Stria terminalis (right) | Decrease | 25.5 | −25.5 | −3 | −6.3649 | 399 |
| Cerebral peduncle (right) | Decrease | −7.5 | −36 | −22.5 | −6.267 | 268.5 |
| Corticospinal tract (right) | Decrease | 27 | −22.5 | −1.5 | −6.2017 | 480 |
| Superior cerebellar peduncle (left) | Decrease | 6 | −37.5 | −24 | −6.1625 | 291 |
| Medial lemniscus (left) | Decrease | 7.5 | −36 | −25.5 | −5.9859 | 277.5 |
| External capsule (left) | Decrease | −24 | 16.5 | 7.5 | −5.8788 | 427.5 |
| Posterior limb of internal capsule (left) | Decrease | 24 | −21 | −1.5 | −5.8567 | 712.5 |
| Anterior corona radiata (left) | Decrease | −24 | 18 | 9 | −5.814 | 363 |
| Inferior cerebellar peduncle (right) | Decrease | −7.5 | −36 | −25.5 | −5.7833 | 235.5 |
| Medial lemniscus (right) | Decrease | −10.5 | −19.5 | −22.5 | −5.6306 | 300 |
| Posterior limb of internal capsule (right) | Decrease | −22.5 | 12 | 10.5 | −5.5811 | 481.5 |
| Inferior fronto-occipital fasciculus (left) | Decrease | −18 | 12 | −12 | −5.5501 | 375 |
| Superior corona radiata (right) | Decrease | 21 | −10.5 | 36 | −5.4137 | 1369.5 |
| Anterior limb of internal capsule (left) | Decrease | 22.5 | 18 | 7.5 | −5.4057 | 195 |
| Body of corpus callosum | Decrease | 18 | −10.5 | 36 | −5.2973 | 300 |
| Middle cerebellar peduncle | Decrease | −15 | −30 | −25.5 | −5.205 | 3489 |
| Anterior limb of internal capsule (right) | Decrease | −10.5 | −21 | −21 | −5.1441 | 889.5 |
| Inferior cerebellar peduncle (left) | Decrease | 10.5 | −42 | −40.5 | −5.0247 | 228 |
| Uncinate fasciculus (right) | Decrease | 31.5 | 4.5 | −15 | −4.9017 | 96 |
| Cerebral peduncle (left) | Decrease | 22.5 | −19.5 | −4.5 | −4.8948 | 832.5 |
| Uncinate fasciculus (left) | Decrease | −34.5 | −1.5 | −12 | −4.8377 | 115.5 |
| Sagittal stratum (left) | Decrease | −37.5 | −13.5 | −13.5 | −4.7554 | 237 |
| Superior corona radiata (left) | Decrease | −16.5 | −3 | 37.5 | −4.7273 | 1323 |
| Pontine crossing tract | Decrease | −1.5 | −22.5 | −22.5 | −4.6415 | 540 |
| Retrolenticular part of internal capsule (right) | Decrease | −22.5 | −15 | −1.5 | −4.6096 | 199.5 |
| Body of corpus callosum | Decrease | −18 | −4.5 | 34.5 | −4.5974 | 217.5 |
| Sagittal stratum (right) | Decrease | 36 | −13.5 | −12 | −4.509 | 171 |
| Superior cerebellar peduncle (right) | Decrease | −9 | −43.5 | −40.5 | −4.4001 | 165 |
| Fornix (cres)/Stria terminalis (left) | Decrease | −34.5 | −15 | −15 | −4.2786 | 142.5 |
| Corticospinal tract (left) | Decrease | 12 | −19.5 | −22.5 | −4.0624 | 234 |
| Posterior corona radiata (right) | Decrease | 27 | −25.5 | 19.5 | −3.746 | 214.5 |
| Superior longitudinal fasciculus (right) | Decrease | 30 | −33 | 34.5 | −3.6206 | 195 |
| Posterior thalamic radiation (left) | Increase | −28.5 | −67.5 | 3 | 4.3449 | 124.5 |
| Genu of corpus callosum | Increase | 12 | 27 | 4.5 | 5.3552 | 1141.5 |
Psychopathological Correlates for X-Chromosome Associated WMV Changes
To explore potential clinical correlates of these anatomical changes, we examined interaction effects between X- and Y-chromosome dosage and internalizing and externalizing psychopathologies on voxelwise WMV. We found significant interaction effects associated with increased X- and increased Y-chromosome dosage, although they differed between chromosomes with regard to their spatial location and direction. WMV in the anterior limbs of both the left and right internal capsules decreased as X-chromosome dosage increased, and these WMV decreases were attenuated in individuals with more severe externalizing pathology (Fig. 2A). Put another way, lowered WMV in these regions correlated with less severe externalizing pathology across individuals, and this relationship was more dramatic in individuals with a greater number of supernumerary X-chromosomes. There were no significant interactions between X-chromosome-linked WMV changes and internalizing psychopathology scores. For the Y-chromosome, WMV in the genu of the corpus callosum increased as dosage increased, and those increases were attenuated in individuals with more severe internalizing pathology (or, increased WMV in these regions was associated with a greater severity of internalizing pathology, and this relationship was more dramatic in individuals with a greater number of supernumerary Y chromosomes; Fig. 2B). There were no significant interactions between Y-chromosome linked WMV alterations and externalizing scores.
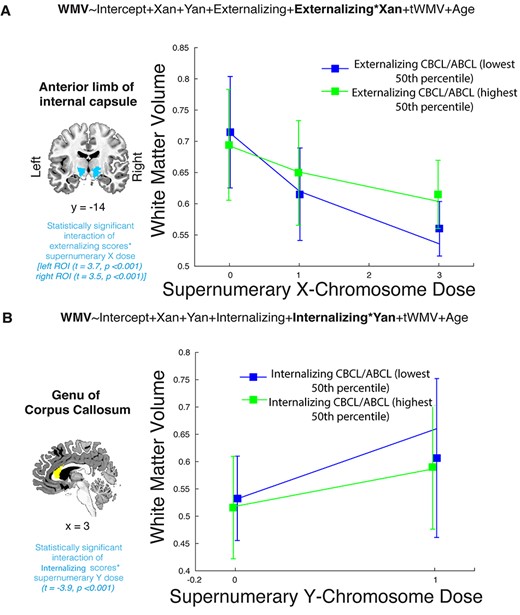
Correlation between SCD-driven changes and internalizing and externalizing psychopathology. (A) Significant interaction effect of externalizing psychopathology on the relationship between WMV in the anterior limbs of the internal capsules and supernumerary X-chromosome dosage. As X-chromosome dosage increased, WMV decreased, but this relationship was attenuated in individuals with more severe externalizing psychopathology. These interactions were significant in both the left (t = 3.7, P < 0.001) and right (t = 3.5, P < 0.001) internal capsules, but only the left-side line graph is shown here. (B) Significant interaction effect of internalizing psychopathology on the relationship between WMV in the genu of the corpus callosum and supernumerary Y-chromosome dosage (t = −3.9, P < 0.001). WMV in this region increased with mounting Y-chromosome dosage, but this relationship was less dramatic in individuals with greater internalizing psychopathological symptoms. In both cases, line graphs were generated based on the mean WMV of all voxels within the respective regions of interest, with error bars indicating standard deviation. Models were run using continuous measures of externalizing and internalizing psychopathology from the CBCL and ABCL, but are placed in highest and lowest 50th percentile categories here for visualization purposes. Supernumerary X- and Y-dosages refer to X and Y dosage counts that are above gonadal baseline (i.e., 0 in graph 2A encompasses XX and XY individuals, 1 encompasses XXY and XXX individuals, 2 encompasses XXYY individuals, and 3 encompasses XXXXY individuals).
Spatial Conjunction between SCD-Associated WMV and GMV Changes
Finally, to integrate our WMV results with GMV findings, we examined the relationship between SCD-associated regional WMV changes and SCD-associated regional GMV changes. This first required modeling SCD-linked GMV alterations in our dataset. As with white matter, altered X- and Y-chromosome dosage was associated with regionally heterogeneous GMV changes, with widespread subcortical, cerebellar regions showing decreases in GMV while select regions in the occipital and temporal lobes showed increases in GMV (Fig. 3A and B). Again, there was a striking correlation between X- and Y-chromosome effects on regional GMV [r = 0.78, P = 0.001; Fig. 3C], which was confirmed to be due to close coherence of chromosomal effects (rather than chance) through permutation testing (Fig. 3D). Further, the spatial patterning of these SCD-associated GMV changes was broadly in line with previous findings (i.e., Raznahan et al. 2016).
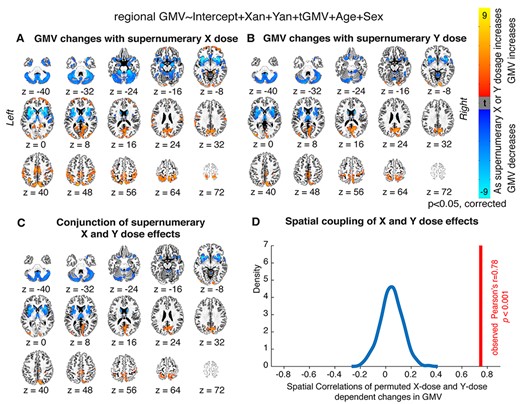
Local GMV changes as a function of X- and Y-chromosome dosage. (A, B) Thresholded t-maps, where colored regions represent cortical and subcortical regions showing statistically-significant GMV changes with (A) increasing supernumerary X-chromosome dosage, or (B) increasing supernumerary Y-chromosome dosage (P < 0.05 for all regions after correction for multiple comparisons; blue represents regions where GMV decreases as chromosome dosage increases, and orange represents regions where GMV increases as chromosome dosage increases). (C) Conjunction t-map showing the high degree of overlap between areas where X-chromosome dosage affects GMV and areas where Y-chromosome dosage affects GMV (blue represents regions where GMV decreases with both mounting X- and mounting Y-chromosome dosage, and orange represents regions where GMV increases with both mounting X- and mounting Y-chromosome dosage). (D) Density plot showing that the observed cross-voxel correlation between X- and Y- chromosome effects on regional GMV is greater than 1000 correlations drawn from random permutations of SCA labels across participants.
After modeling the SCD-associated GMV changes, we probed the spatial and directional coherence between those changes and SCD-associated WMV alterations. Fisher’s exact tests revealed that there was indeed close coordination between areas where WMV increased with mounting X- and Y-chromosome dosage and areas where GMV increased with mounting X- and Y-chromosome dosage (odds ratio = 5.3, P = 0.02; see Fig. 4A and B), as well as close overlap between areas where WMV decreased with mounting SCD and areas where GMV decreased with mounting SCD (odds ratio = 2.7, P = 0.04; see Fig. 4C and D). For example, the posterior thalamic radiation, a tract that showed SCD-associated WMV increases, courses through the posterior parietal and occipital cortices—which themselves showed SCD-linked GMV increases—and, in line with the SCD-associated WMV decreases in many subcortical tracts, mounting X-/Y-chromosome dosage was linked to GMV reductions in the basal forebrain, insula, and other subcortical regions.
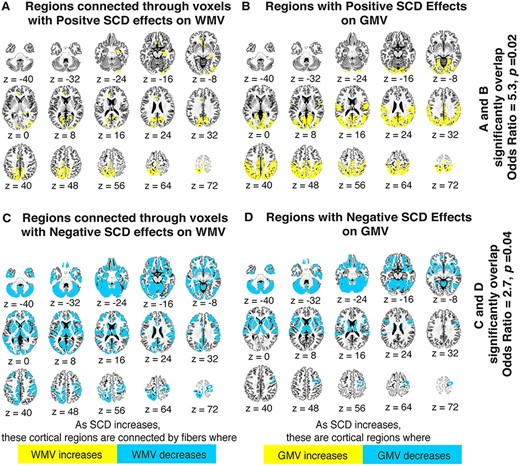
Coordination of regional WMV and GMV changes with SCD variation. (A) Yellow gray matter regions are those connected by white matter tracts that have at least 50% of their voxels scaling positively with increased X-and Y-chromosome dosage. (B) Yellow gray matter regions are those showing significant volumetric increases with increased X- and Y-chromosome dosage. (C) Blue gray matter regions are those connected by white matter tracts with at least 50% of their voxels scaling negatively with increased X- and Y-chromosome dosage. (D) Blue gray matter regions are those showing significant volumetric decreases with increased X- and Y-chromosome dosage. Fisher’s exact tests demonstrated a significant overlap between maps A and B (odds ratio = 5.3, P = 0.02), as well as between maps C and D (odds ratio = 2.7, P = 0.04), suggesting a strong congruence between SCD effects on white and gray matter in the human brain. Maps are presented in Desikan-Killiany space, and were generated with the help of IIT Atlas resources (see methods for details).
Discussion
Using a unique sample of youth with varying SCD, we comprehensively characterize, for the first time, the effects of X- and Y-chromosomal variation on regional WMV in the human brain. We find that increased X- and Y-chromosome dosage drives regionally heterogeneous changes in local WMV, and that there is a high degree of spatial overlap in the effects of the two chromosomes. Additionally, we demonstrate an association between X-chromosome-linked WMV changes in the internal capsule and severity of externalizing psychopathological symptoms, as well as an association between Y-chromosome-linked WMV changes in the corpus callosum and internalizing psychopathological symptoms. Finally, we show that the spatial patterning of SCD-driven WMV alterations overlaps with that of SCD-associated GMV changes, implying a commonality between SCD effects on white and gray matter structures. We discuss each of these findings in further detail below.
SCD-Driven Changes in Local WMV
Our voxelwise results revealed a great deal of spatial congruence between the impacts of X- and Y-chromosomes on local WMV after adjusting for total WMV. We demonstrate increased WMV in the genu of the corpus callosum and posterior thalamic radiation, but decreased WMV in many tracts—including the corona radiata, internal and external capsules, fronto-occipital fasciculus, cerebellar peduncles, corticospinal tracts, and medial lemniscus—as a function of both increasing X- and increasing Y-chromosome dosage. Taken together, these findings suggest that increased SCD generally corresponds with wide-reaching WMV decreases (spanning intrahemispheric, subcortical, cortico-cortical, and brainstem pathways)—with the exception of a few notable regions (i.e., the genu of the corpus callosum and the posterior thalamic radiation, which showed WMV increases with mounting SCD). These localized changes are broadly in line with prior cortical findings in discrete SCA subgroups. Decreased WMV in the frontotemporal regions (including the inferior fronto-occipital fasciculus, the internal capsule, and the external capsule), as well as increased WMV in the corpus callosum, have been previously correlated with increases in both Y- and X-chromosome dosage (in XYY syndrome: Bryant et al. 2012; Lepage et al. 2014, and XXY/Klinefelter’s syndrome: Bryant et al. 2012; Lentini et al. 2013, respectively). There are some distinctions between our findings and previous results: For example, increased Y-chromosome dosage has previously been tied to increases in WMV underlying the superior parietal lobes (Lepage et al. 2014), which we did not observe. Overall, however, our study, which incorporated a larger sample size and a greater range of SCD contexts than prior work, helps solidify the idea that increases in SCD drive a set of spatially stereotyped WMV changes in both cortical and subcortical regions. Finally, there is a mixed pattern of spatial convergence and divergence between our findings and those in other neurogenetic disorders (i.e., 22q11.2 deletion syndrome: Bakker et al. 2016; Roalf et al. 2017; Villalón-Reina et al. 2020, 16p11.2 deletion syndrome: Owen et al. 2014). Overlapping areas of white matter changes include the corpus callosum, the posterior thalamic radiations, the inferior fronto-occipital fasciculus, the sagittal stratum, and the internal and external capsules (Owen et al. 2014; Bakker et al. 2016; Villalón-Reina et al. 2020), raising the possibility of shared white matter changes across different gene dosage disorders. Divergent (or apparently syndrome-specific) areas of white matter alteration may include the forceps major, the cingulum (22q11.2 deletion syndrome: Roalf et al. 2017) and the supratentorial fibers (16p11.2 deletion syndrome: Owen et al. 2014). More studies with larger sample sizes could help more comprehensively characterize WMV changes that cohere across diverse neurogenetic conditions.
Understanding the neurobiological and genetic underpinnings of these WMV alterations is also of interest. As our design exclusively involved volumetric-based analyses, we can only speculate as to potential microstructural changes underlying the WMV shifts. Possible mechanisms may include alterations in axonal myelination (Wang et al. 2008; Paus and Toro 2009), changes in axonal diameters (Changizi 2001), or alterations in axonal branching (Zhang and Sejnowski 2000), but future work incorporating multimodal (i.e., diffusion tensor) imaging data, or detailed histological examinations, is needed to make definitive conjectures. Our results can, however, provide important insights into potential genetic drivers of WMV alterations in varying SCD contexts. The demonstration of WMV changes across distinct chromosomal— but identical gonadal —contexts suggests these alterations are linked to genetic, rather than secondary metabolic or hormonal, effects (Raznahan et al. 2016). Our findings can also nominate specific genes that may underlie these anatomical changes. The high degree of spatial convergence of X- and Y-chromosomal effects on regional WMV, as well as the overlap between both X-related effects and Y-related effects and the effects of pooled (i.e., X- or Y-dosage increases; see Supplementary Material) raises the possibility that genes shared between both sex chromosomes may drive SCD-associated changes. These shared genes comprise two main subgroups: pseudoautosomal region (PAR) genes that lie in the recombinant regions of the X- and Y- chromosomes (Otto et al. 2011), and X-/Y-homolog genes that lie outside the pseudoautosomal regions (i.e., “gametologs”; Bellott et al. 2014). Gametologs—which appear to be evolutionarily conserved (Bellott et al. 2014), have high degrees of expression sensitivity to changes in SCD (Raznahan et al. 2018), and are often coexpressed with genes involved in key cellular functions (Raznahan et al. 2018)—may be the more likely candidates to underwrite these convergent WMV changes. Following similar reasoning, gametologs have been previously proposed to underlie convergent X- and Y-chromosomal effects on gray matter structures in SCA conditions (Raznahan et al. 2016, 2018; Warling et al. 2020; Xenophontos et al. 2020)—and a common genetic mediator for SCD-driven gray and white matter changes would cohere with the close spatial coordination between SCD-linked alterations in these two tissue types that we observed. Gametolog mediation of SCD effects also offers a potential explanation for well-established findings from independent research groups that X- and Y-chromosomes have partially overlapping impacts on neuroanatomical structures (Bryant et al. 2012; Raznahan et al. 2016: Reardon et al. 2016: Mankiw et al. 2017; Nadig et al. 2018; Xenophontos et al. 2020) and behavior (Ross et al. 2009, 2012; Lee et al. 2012), despite their notable size and gene content differences (Skaletsky et al. 2003; Ross et al. 2005). However, it is important to note that future laboratory work is still needed to directly support these conjectures: there could be other explanations, such as SCD-linked GMV changes driving downstream WMV changes, rather than a shared genetic mediator underlying both GMV and WMV alterations.
Clinical Implications
Our study also points to potential clinical implications of these anatomical shifts. SCA is associated with increased rates of mood and neurodevelopmental disorders, including anxiety, depression, and ADHD (Hong and Reiss 2014; van Rijn 2019), and WMV changes have previously been advanced as potential neurobiological substrates of these clinical outcomes (Bryant et al. 2011; Lepage et al. 2014). Here, we demonstrate an interaction between externalizing (i.e., disruptive, aggressive, and/or antisocial) behaviors and X-chromosome driven WMV shifts in the internal capsules, as well as an interaction between internalizing (i.e., related to anxiety or depressive symptoms) behaviors and Y-chromosome driven WMV changes in the genu of the corpus callosum. These findings represent the first direct empirical link between supernumerary SCD-induced white matter changes and clinically relevant symptoms (which have previously only been demonstrated in Turner’s syndrome; Yamagata et al. 2012). It seems feasible that disruptions in these two highly integrative fiber bundles (Hofer and Frahm 2006; Fabri et al. 2014; Mithani et al. 2020) could directly underwrite psychopathological symptoms in SCA conditions. However, these relationships should also be interpreted with caution: recent work that attempts to replicate previously demonstrated structural-functional findings has revealed the limitations of linking behavioral domains to discrete cortical structures in neuroimaging studies with relatively small sample sizes (Boekel et al. 2015; Genon et al. 2017; Kharabian Masouleh et al. 2019; Marek et al. 2020). Previous sMRI work has also produced seemingly incongruent structural-functional results (i.e., greater regional GMV correlating with worse performance on cognitive tasks; Genon et al. 2017). Finally, despite the high degree of spatial overlap in X- and Y-chromosome-driven WMV changes, we found distinct symptom–structure relationships for the two chromosomes. Additionally, in both cases, relationships between WMV and X-/Y-chromosome dosage were attenuated in individuals experiencing more severe psychopathological symptoms, which may not have been the most expected result. Thus, rather than drawing definitive structure–function inferences, we argue that our results add new evidence to the idea that variations in symptom severity within SCAs may partly relate to variations in white matter organization. Larger patient cohorts, or multimodal imaging approaches, could help validate relationships between psychopathology and the specific white matter regions and tracts that we have identified.
Integration with GMV Results
Finally, in addition to shedding light on functionally salient WMV changes, our work also illuminates new connections between SCD-dependent WMV and SCD-dependent GMV changes. Specifically, our results demonstrate a strong consonance between both the direction (i.e., volumetric increases vs. decreases) and spatial patterning of WMV and GMV changes with mounting SCD. We found SCD-linked GMV decreases in the basal ganglia, cerebellar lobules, and subsections of the temporal lobe, which was congruent with the widespread WMV decreases we observed, alongside GMV increases in parts of the parietal and occipital lobe, which cohered with WMV increases in the posterior thalamic radiation. As with WMV changes, there was a significant overlap between the X-chromosome induced and Y-chromosome Induced GMV changes—and the findings from our VBM approach also tracked closely with those from a prior study in this cohort, which used surface-based morphometry to examine local gray matter changes in a range of SCD contexts (Raznahan et al. 2016). In particular, our regional VBM results appear to cohere with the spatial pattern of changes previously noted in surface area more so than the changes previously noted in the other subcomponent of GMV, cortical thickness (Raznahan et al. 2016). Taken together, these results are consistent with the idea that interindividual variation in surface area is the primary source of interindividual variation in GMV—in both disease and health contexts (Frye et al. 2010; Winkler et al. 2010).
The observed concordance between GMV and WMV changes in the brain suggests a coordinated coupling between white and gray matter alterations with increasing SCD. Although prior work has separately identified sex-based differences in both white and gray matter structures in euploidic populations (Kanaan et al. 2012; Ruigrok et al. 2014; Ritchie et al. 2018), and separately demonstrated alterations in both white and gray matter structures with variation in SCD (Bryant et al. 2011, 2012; Lentini et al. 2013; Lenroot et al. 2014; Lepage et al. 2014; Reardon et al. 2016; Fish et al. 2017; Mankiw et al. 2017), no previous study has directly examined the potential overlap between regional GMV and WMV changes as a function of either sex or SCD. A relative lack of coordination between SCD-induced white and gray matter changes might have been suggested by some existing neuroanatomical evidence, including the knowledge that: (i) global white and gray matter scale differently as a function of brain size in healthy populations (Barnes et al. 2010); (ii) global white and gray matter have divergent developmental trajectories in healthy populations (Lenroot et al. 2007; Mills et al. 2016); and (iii) the regional GMV and WMV changes previously identified in individual SCA conditions appear to be fairly spatially distinct (Lentini et al. 2013; Lepage et al. 2014). However, our results do fit with several other robust lines of research, including (i) studies showing a high degree of coordination between regional gray and white matter changes over the course of typical development (Bray et al. 2015; Whitaker et al. 2016; Moura et al. 2017; Cafiero et al. 2019); (ii) studies showing spatial correspondence between gray and white matter pathologies in other neurological disorders (Faria et al. 2016; Han et al. 2018); and (iii) perhaps most notably, studies that have demonstrated shared underlying genetic influences on white and gray matter structures (Kochunov et al. 2011; Shen et al. 2016). Although this shared genetic influence has previously only been localized to autosomal genes (Kochunov et al. 2011), as discussed above, a common sex chromosomally-mediated genetic driver could explain the close correlation between the GMV and WMV changes that we observed. Thus, our findings support an integrated model where supernumerary X- and Y-chromosomes appear to exert chromosomally mediated effects not only on the cortical and subcortical structures (Raznahan et al. 2016), but also on the white matter tracts that interconnect them. These findings pave the way for future work which could (i) replicate our results in larger SCA datasets and/or in datasets incorporating a greater range of SCD variation (e.g., cohorts that include patients with Turner’s syndrome); (ii) determine possible correlations between sex-based differences in gray matter structures and sex-based differences in white matter structures in typically developing populations; and (iii) examine potential correspondence between white and gray matter changes in other neurogenetic diseases.
Limitations and Future Directions
Our results should be considered alongside several caveats. First, ascertainment bias is a well-known limitation in studies on SCA cohorts, as patients presenting with more severe phenotypes are more likely to be clinically recognized and enrolled in research (Bardsley et al. 2013; van Rijn 2019). Thus, our sample may not be representative of the full SCA population. Second, high-FSIQ individuals are relatively overrepresented in our control participant cohort (Table 1). This could be due to ascertainment biases or population-level inflation of IQ scores over time (i.e., the “Flynn Effect”; Flynn 1987), as our sample was collected over a multidecade period, but is worth mentioning, particularly given that cognitive deficits are a known association with SCA. Third, our examination of links between SCD-driven WMV changes and psychopathology was not exhaustive for all symptoms associated with SCA conditions—studying the potential relationship between WMV alterations and cognitive impairments in SCA (Bryant et al. 2011; Printzlau et al. 2017), for example, would also have merit. It is additionally worth noting that the CBCL and ABCL represent only one questionnaire-based approach to measuring psychopathology. Thus, future work in this area could incorporate multiple measures of internalizing and externalizing pathology and/or generate psychopathological factor scores based on data from multiple instruments. Fourth, we enrolled a cross-sectional participant cohort, but longitudinal studies are needed to help elucidate any relevant developmental trajectories for SCD-driven WMV changes (Green et al. 2014). Fifth, our study only employed VBM methods on sMRI images. Of particular relevance for our examination of spatial commonality between SCD-driven WMV and GMV alterations, segmentation errors at GM–WM boundaries are a known risk in VBM processing pipelines (Goto et al. 2013, 2017)— but the topological distinctness of our results (i.e., we correlated changes in white tracts that connect gray matter regions, not necessarily white matter tracts directly underlying gray matter regions) means this was unlikely to have a strong influence on our findings. Also of relevance to our examination of coordination between WMV and GMV changes is that the IIT Atlas WM–GM connectivity matrix we used for this analysis was generated using an adult cohort (mean age: 31 ± 13 years; range: 18–59 years), which only partly overlaps with the age range of our sample. Thus, normative changes in white matter connectivity between midchildhood and early adulthood could theoretically modulate the observed degree of connectivity-based congruence between SCA effects on regional WMV and GMV. An important goal for future work would be directly examining how the spatial patterning of SCA effects on GMV and WMV relates to the spatiotemporal patterning on WMV connectivity in health. Finally, moving beyond VBM-based analyses to a combined use of structural, diffusion tensor, and/or functional imaging methods could provide further insight into the biological underpinnings and behavioral implications of structural white matter changes in SCA patients.
Conclusions
Despite the above limitations, our study provides several important advances for understanding of neuroanatomical changes associated with aberrant SCD. First, we characterize a spatially stereotyped set of regional white matter regions that show volumetric changes with increased X- and Y- chromosome dosage. Second, we present preliminary evidence for an interaction between those anatomical changes and psychopathology, adding empirical evidence that white matter alterations may underlie clinical symptoms associated with abnormal SCD. Third, we show that SCD-induced WMV changes are highly spatially overlapped with SCD-induced GMV changes, suggesting a role for sex chromosomes in shaping neuroanatomical structures that is (i) genetically mediated, and (ii) coordinated across both major tissue classes of the brain. These findings enhance our understanding of SCAs as neurogenetic disorders in their own right, and as models for pathogenic effects of gene dosage variation on the human brain more generally.
Funding
Intramural Research Program of the National Institute of Mental Health (NIH Annual Report Number: ZIAMH002949; Protocol: 89-M-0006; ClinicalTrials.gov Number: NCT00001246).
Notes
The authors thank the patients and their families for participating in this study, as well as the Association for X and Y Chromosome Variations (https://genetic.org) for their assistance with recruitment. Conflict of Interest: None declared.
References
Author notes
Authors Allysa Warling and Mani Yavi have contributed equally