


Abstract
Although prior studies have demonstrated that genetic factors play the dominant role in the patterning of the pediatric brain, it remains unclear how these patterns change over time. Using 1748 longitudinal anatomic MRI scans from 792 healthy twins and siblings, we quantified how genetically mediated inter-regional associations change over time via multivariate longitudinal structural equation modeling. These analyses found that genetic correlations for both lobar volumes and cortical thickness are dynamic, with relatively static effects on surface area. While genetic correlations for lobar volumes decrease over childhood and adolescence, in general they increase for cortical thickness in the second decade of life. Quantification of how genetic factors influence maturational coupling improves our understanding of typical neurodevelopment and informs future molecular genetic analyses.
Introduction
Typical human brain development is an extraordinarily complex process requiring a combination of thus far largely unknown factors. Although once considered a relatively static structure after 6 years of age (Jernigan et al. 2011), anatomic MRI studies of have confirmed the notion that the cerebral cortex is highly dynamic throughout childhood and adolescence (Giedd and Blumenthal 1999; Gogtay and Giedd 2004; Sowell et al. 2004; Jernigan et al. 2011). Structural maturation proceeds in a coordinated and locally heterogeneous manner, with a complex, nonrandom correlational structure that is related both to known white matter connectivity and functional networks (Raznahan et al. 2011, 2012; Alexander-Bloch et al. 2013).
In addition to rapid, highly patterned structural changes relative to adults, the pediatric brain also demonstrates a high degree of interindividual variability for practically every region thus far measured (Lange et al. 1997). More than a decade of imaging genetic studies have shown that a large fraction of individual differences in most pediatric brain structures can be attributed to genetic factors (Peper et al. 2007; Schmitt et al. 2007; Jansen et al. 2015) and genetic influences on brain structure are dynamic in childhood (Wallace et al. 2006; Peper et al. 2009; Schmitt et al. 2014). Furthermore, multivariate studies have shown that different brain regions share common genetic etiologies for volumes (Schmitt et al. 2010), surface area (Chen et al. 2012), and cortical thickness (Schmitt et al. 2008; Chen et al. 2013). However, it remains unclear how common genetic effects between brain regions change over time, that is, how genetic factors influence maturational coupling.
In the current study, we use one of the largest genetically informative longitudinal pediatric imaging datasets and combine multivariate and longitudinal neuroanatomic modeling to examine how genetic covariance patterns change over childhood and adolescence.
Materials and Methods
Subjects
792 typically developing children, adolescents, and young adults from 410 families were recruited at the Child Psychiatry Branch of the National Institute of Mental Health (NIMH). The sample included pediatric, adolescent, and young adult monozygotic twins (MZ, N = 249), dizygotic twins (DZ, N = 131), siblings of twins (N = 110), and singleton (N = 302) family members (summarized in Table 1). Details of this sample have been described elsewhere (Schmitt et al. 2014). Briefly, parents of prospective participants were interviewed by phone and asked to report their child’s health, developmental, and educational history. Subjects were excluded if they had taken psychiatric medications, had been diagnosed with a psychiatric disorder, had undergone brain trauma, or had any condition known to affect gross brain development. Inclusion criteria were a minimum gestational age of 29 weeks and a minimum birth weight of 1500 g. Approximately 80% of families who responded to study advertisements met inclusion criteria. For twin subjects, zygosity was determined by DNA analysis of buccal cheek swabs using 9–21 unlinked short tandem repeat loci for a minimum certainty of 99%, by BRT Laboratories and Proactive Genetics. We obtained verbal or written assent from the child and written consent from the parents for their participation in the study. The NIMH Institutional Review Board approved the protocol.
Demographic characteristics of the sample
| MZ | DZ | Siblings of twins | Singletons | Total | |
|---|---|---|---|---|---|
| Sample size | 249 | 131 | 110 | 302 | 792 |
| Mean age at first scan (years SD) | 11.2 (3.8) | 9.6 (3.5) | 12.0 (4.4) | 11.7 (5.1) | 11.3 (4.4) |
| Mean scan interval (years SD) | 2.4 (0.66) | 2.4 (0.67) | 2.3 (0.86) | 2.3 (0.85) | 2.4 (1.1) |
| Gender | 117 F (47%) | 62 F (47%) | 61 F (55%) | 136 F (45%) | 376 F (47%) |
| 132 M (53%) | 69 M (53%) | 49 M (45%) | 166 M (55%) | 416 M (53%) | |
| SES (Hollingshead Index SD) | 44.4 (18.6) | 43.2 (15.1) | 43.0 (18.0) | 40.6 (20.3) | 42.6 (18.7) |
| Handedness | 215 R (88%) | 107 R (82%) | 88 R (82%) | 269 R (90%) | 679 R (87%) |
| 16 M (7%) | 14 M (11%) | 7 M (7%) | 17 M (6%) | 54 M (7%) | |
| 14 L (6%) | 10 L (8%) | 12 L (11%) | 14 L (5%) | 50 L (6%) |
MRI Acquisition
All MRI images were acquired on the same General Electric 1.5 Tesla Signa Scanner located at the National Institutes of Health Clinical Center in Bethesda, Maryland. A 3-dimensional spoiled gradient recalled echo sequence in the steady state sequence was used to acquire 124 contiguous 1.5-mm thick slices in the axial plane (TE/TR = 5/24 ms; flip angle = 45 degrees, matrix = 256 × 192, NEX = 1, FOV = 24 cm, acquisition time 9.9 min). A Fast Spin Echo/Proton Density weighted imaging sequence was also acquired for clinical evaluation. A total of 1748 MRI datasets were acquired. Up to 8 MRI scans were performed per individual, with sibships containing up to 5 members. The mean interval between scans was 2.4 years.
Image Analysis
All MR images were imported into the CIVET pipeline for automated structural image processing (Ad-Dab’bagh et al. 2006). Briefly, the native MRI scans were registered into standardized stereotaxic space using a linear transformation (Collins et al. 1994) and corrected for non-uniformity artifacts (Sled et al. 1998). The registered and corrected volumes were segmented into white matter, gray matter, cerebrospinal fluid, and background using a neural net classifier (Zijdenbos et al. 2002). The gray and white matter surfaces were fitted using deformable surface-mesh models and nonlinearly aligned toward a template surface (MacDonald et al. 2000; Robbins et al. 2004; Kim et al. 2005). The gray and white matter surfaces were resampled into native-space. The tissue classification information was combined with a probabilistic atlas to provide volumetric region of interest (ROI) measures (Collins et al. 1995). Lobar volumes were included in this analysis for each hemisphere separately. Cortical thickness was measured in native-space using the linked distance between the white and pial surfaces (MacDonald et al. 2000; Lerch and Evans 2005) and assigned to specific regions using a probabilistic atlas (Collins et al. 1999). Measures of cerebral surface area were estimated for the same ROI, defined as the sum of the areas of the triangles for within each ROI (Im et al. 2008).
Statistical Analysis
Each subject’s neuroanatomic measures were imported into the R statistical environment for analysis (R Core Development Team 2016). The data were reformatted such that each record represented family-wise (rather than individual-wise) data. The subsequent dataset contained up to 8 measures per ROI per individual and up to 5 individuals per family for each ROI. Genetic modeling was performed in OpenMx, a structural equation modeling package fully integrated into the R environment (Boker et al. 2011; Neale et al. 2016). Volumetric, cortical thickness, and surface area measures were analyzed separately.
For each pairwise combination of ROIs, a genetically informative quadratic latent growth curve model was constructed (Neale and McArdle 2000; McArdle et al. 2004) which represents the “bivariate” extension of the single-ROI model described previously (Schmitt et al. 2014). A traditional longitudinal growth curve model uses repeated measures to estimate changes in means and variances with time (Duncan and Duncan 2004). Compared to other longitudinal methods, latent growth curve models have the advantage that they allow for direct age-based predictions, are robust to missing data cells, and are customizable to unique data structures (Mcardle and Epstein 2013). In order to understand changes in the patterns of genetic relationships between neuroanatomic structures, the variances and covariances between the 3 latent growth curve factors per individual were decomposed into additive genetic (A), common environment (C), and specific environment components (E). Each of these components was specified as a Cholesky decomposition, which factors any symmetric positive definite matrix into a lower triangular matrix of free parameters postmultiplied by its transpose (Neale and Cardon 1992).
The rich family structure in the present data made it possible to employ an extended twin design (Posthuma and Boomsma 2000; Posthuma et al. 2000), which significantly increased statistical power. Because the study design acquired panel rather than cohort longitudinal data, the age at scan was integrated into the model as a dynamic (e.g., definition) variable to individualize growth curve predictions (Mehta and West 2000). Models were fitted by maximum likelihood, which is efficient and yields asymptotically unbiased parameter estimates. In order to test the statistical significance of genetic covariance with time, submodels were constructed which removed the free parameters modeling changes in ROI–ROI covariance (while retaining the mean effects); differences in log-likelihood between these models generally follow a χ2 distribution with degrees of freedom equal to number of parameters removed (Neale and Cardon 1992; Visscher 2004; Dominicus et al. 2006). Because several prior studies have shown little role of the shared environment on the variance of brain structures in children (e.g., Wallace et al. 2006; Peper et al. 2007; Lenroot et al. 2009), we attempted to simplify our models by the removal of shared environmental parameters. For all pairwise combinations of ROIs, shared environmental factors were not statistically significant for either main effects or changes over the age range studied even without correction for multiple testing. Subsequent analyses were performed using the AE submodel. Control of multiple comparisons was performed via false discovery rate (Genovese et al. 2002). A q-value threshold was set at 0.05.
Trends in genetic correlations were displayed for each pairwise combination of ROIs. Likelihood based 95% confidence intervals for rG were calculated in OpenMx for all pairwise combinations of ROIs (Neale and Miller 1997). Dynamic correlation matrices were then constructed to observe how genetic inter-relationships change over time.
Results
For volumes and cortical thickness, there were significant genetic effects for all pairwise combinations of ROIs (P < 0.0001) even after adjusting for multiple testing (Fig. 1). The most significant relationships tended to be between an ROI and its contralateral homolog. Volumetric correlations were in general very high (>0.80), with cortical thickness also high but overall lower when compared with volumes, ranging from approximately 0.70–0.80. Genetic correlations between measures of surface area were still lower, with most ROI pairs ranging from 0.40 to 0.60, again with the notable exception of contralateral homologs. Most main effects of genetic factors on surface area were statistically significant, with the most significant effects seen between pairwise combinations of the frontal, temporal, and parietal lobes (Fig. 1). After adjusting for multiple testing, a few ROI pairs involving the cingulate cortex did not reach statistical significance (Supplementary data).
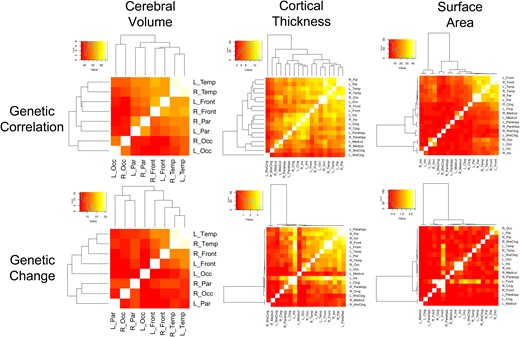
Statistical significance of genetically mediated maturational coupling for cerebral volumes, cortical thickness, and surface area. The heatmaps display −log10P-values for all pairwise combinations of ROIs; the top row shows statistical significance of absolute genetic effects on pairwise genetic covariance, while the bottom row shows statistically significant changes in genetic covariance over childhood and adolescence. On the margins, dendograms from hierarchical cluster analyses are provided.
Trajectories of change in rG for volumes are provided in Figure 2. There were statistically significant changes in genetic correlation over childhood and adolescence for all ROI pairs. ROI trajectory patterns were similar for contralateral ROI pairs (e.g., right parietal-right occipital vs. left parietal-left occipital), as well as similar cross-trait cross-hemispheric combinations of ROIs (e.g., right parietal-right occipital versus left parietal-right occipital). Overall, genetic correlations tended to decrease over time by approximately 10–20% between nonhomologous ROI pairs. Global changes in correlational trajectories are more apparent when viewed dynamically (Supplementary Movie 1).
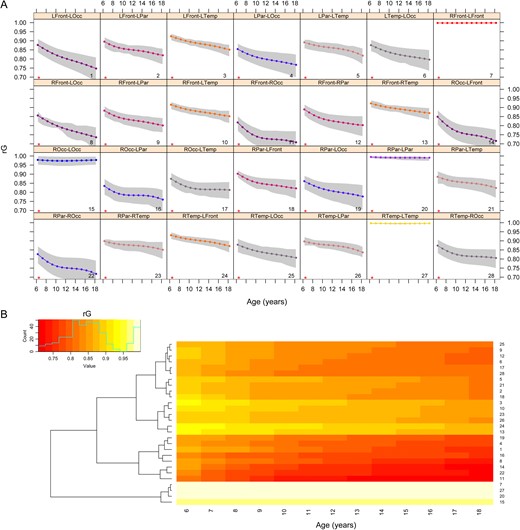
Age-related changes in genetic correlations (rG) for cerebral volumes. Panel A displays changes in genetic correlations for all ROI pairs, with 95% confidence intervals shown in gray. Asterisks identify ROI pairs with significant age-related changes after FDR-correction. The heatmap (B) shows the same trajectories sorted via hierarchical cluster analysis. The numbers on the right correspond to the numbers in each panel of A. A dynamic version of these results available in Supplementary Movie 1.
Patterns of change in cortical thickness genetic correlations were more complex than with volumes (Fig. 3). In early childhood, there were 3 clear clusters of genetic correlations: (1) bilateral lobar structures, (2) bilateral parahippocampal gyrus and insula, and (3) cingulate ROIs. Like with volumes, the strongest genetic correlations tended to be with contralateral homologs. There also were strong genetic correlations between temporal cortical thickness and insular and limbic structures. In the second half of the first decade, rG between lobar measures and cingulate and parahippocampal ROIs slightly decreased. Genetic correlations between regions then steadily increased by up to 50% starting in the second decade. Increased genetically mediated maturational coupling was particularly apparent between the cingulate cortex and other ROI. As with volumes, changes over time were best appreciated when viewing the data dynamically (Supplementary Movie 2).
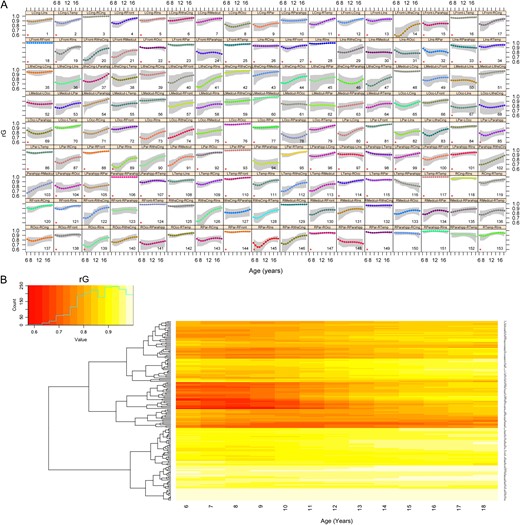
Age-related changes in rG for cortical thickness with 95% confidence intervals shown in panel A. Asterisks identify ROI pairs with significant age-related changes after FDR-correction. A heatmap of the same results are shown in Panel B. Supplemental Movie 2 presents the same data dynamically.
In addition to having lower absolute genetic correlations, relationships between surface area ROIs were in general more static than either for volumes or cortical thickness (Supplementary Fig. S1). There were no ROI pairs that demonstrated statistically significant change after correction for multiple testing. When examining the maximum likelihood estimates, most ROI pairs had either unchanged or slightly decreasing genetic correlations. The notable exception was for several ROI pairs involving the insular cortex, where there were increases in the maximum likelihood estimates. Genetic correlations for surface area can be viewed dynamically in Supplementary Movie 3.
Discussion
The current study provides evidence that the genetic contributions to maturational coupling significantly change in childhood and adolescence for both cerebral volume and cortical thickness. These results are not unexpected and have been predicted in the literature (Raznahan et al. 2011; Irimia and Van Horn 2013), although to the best of our knowledge the current study is the first to address this question directly. In addition to providing additional insights on how cerebral patterning takes place, these findings have pragmatic implications in the hunt for specific molecular genetic biomarkers.
We found that genetic correlations between lobar cerebral brain volumes generally decrease over childhood and adolescence, although they remained high throughout the age range studied. Our prior work has shown that volumetric ROI are highly correlated in childhood, predominantly secondary to a dominant shared genetic factor (Schmitt et al. 2010). Given that genetic correlations between volumes are decreasing, the observed correlations may reflect residual global genetic effects that occurred earlier in life, possibly near or even before birth. Gilmore et al. (2010) demonstrated that the heritability of brain volumes is high even in neonates, although the extant literature suggests heritability increases for most volumetric brain regions over childhood and adolescence (Batouli et al. 2014). Future multivariate imaging genetic studies targeting neonates may help elucidate whether shared/global genetic effects are even more dominant near birth than they are later in childhood.
In contrast to volumes, genetic correlations between cortical thickness ROIs generally increased over the age range studied. These findings parallel our prior observations in the same sample that the heritability of cortical thickness increases over time (Schmitt et al. 2014). Our results are particularly interesting given that complex patterns of maturational coupling have been observed over this age range in nongenetic samples (Raznahan et al. 2011), as well as relationships between structural neuroanatomic covariance and brain function (Alexander-Bloch et al. 2013). It has been previously hypothesized that the observed changing patterns of neuroanatomic covariance may be driven by shared neurodevelopmental influences (Zielinski et al. 2010); the current study provides evidence that these influences may, at least in part, be genetically mediated. In contrast, genetic correlations between measures of surface area are lower and tend to be more static than for either cerebral volumes or cortical thickness.
Limitations
There are several limitations to the current study which should be considered when interpreting these findings. First, while our sample is large by imaging standards, for twin research our sample size is modest. The strong statistical significance of our findings is therefore reassuring. Second, the ROI are large; spatial resolution is therefore limited. The numeric optimization used in the current study is computationally intense, and thus studying all pairwise combinations of a large number of ROIs represents a substantial (although not insurmountable) technical challenge. Future investigations into group differences in patterns of genetic maturational coupling (e.g., based on sex or socioeconomic status), although intriguing, would test the limits of our current methodology. As computational demands increase with increasing model complexity, more computationally efficient methods (Carlin et al. 2005; Dite et al. 2008) may prove useful. Further research using smaller ROI would also be of value, and also would benefit from improved computational speeds. Third, the current study does not directly examine the dynamic neuroanatomic network structure implicit in our findings. Characterization of temporal networks represents an area of active research (Bassett et al. 2013), and future investigations should quantify the role of genetic influences on changes with time via structured graph theoretical analyses.
Funding
Research was supported by NIH grants MH-20030 and K01-ES026840.
Notes
Conflict of Interest: None declared.