


Abstract
Physiological and behavioral studies in cats show that corticotectal inputs play a critical role in the information-processing capabilities of neurons in the deeper layers of the superior colliculus (SC). Among them, the sensory inputs from functionally related associational cortices are especially critical for SC multisensory integration. However, the underlying mechanism supporting this influence is still unclear. Here, results demonstrate that deactivation of relevant cortices can both dislocate SC visual and auditory spatial receptive fields (RFs) and decrease their overall size, resulting in reduced alignment. Further analysis demonstrated that this RF separation is significantly correlated with the decrement of neurons’ multisensory enhancement and is most pronounced in low stimulus intensity conditions. In addition, cortical deactivation could influence the degree of stimulus effectiveness, thereby illustrating the means by which higher order cortices may modify the multisensory activity of SC.
Introduction
Across several species, the superior colliculus (SC or optic tectum, in non-mammalian vertebrates) of the midbrain receives multiple streams of sensory information from a broad range of both cortical and subcortical sources (Sparks, 1986; McHaffie et al. 1988; Stein and Meredith, 1993; May, 2006; Ghose and Wallace, 2014). It has been intensively studied as an essential component of the neural circuitry controlling orienting movements of the eyes, the ears, and the head via descending projections to several motor nuclei (Sparks, 1986; Stein and Meredith, 1993). The intermediate and deep layers of the SC receive multiple sensory inputs from a variety of cortical and subcortical areas, and constituted several sensory maps, and therefore, is considered as a critical part of the circuitry for sensory guided orienting decision (Sparks et al. 2000; Krauzlis et al. 2004; Lo and Wang, 2006). Different unisensory maps (visual, auditory, tactile) present in the deep layers of SC are roughly spatially co-registered. Multisensory neurons, with somata found in the deeper laminae of SC, possess unisensory RFs for effective modalities that are similarly overlapped and co-registered. This is an important feature allowing both integration and then translation of the combined sensory information into effective motor commands (Sparks, 1986; King, 2004).
RF spatial coincidence of different modalities in SC multisensory neurons appears to be wholly dependent upon sensory experience (Wallace and Stein, 2007). SC neurons in neonatal animals possess visual and auditory RFs of broad size with poor spatial tuning. Both modalities normally show substantial contraction and consolidation into spatial register with one another over time (Wallace and Stein, 1997). Animals deprived of visual experience by dark-rearing exhibit neurons in the deeper layers of SC whose visual and auditory RFs fail to contract and become co-registered with each other (Wallace and Stein, 2007). To a lesser degree, this deficit of RF refinement also occurs in the SC of animals reared in an omnidirectional noise environment (Xu et al. 2014, 2015). Further reinforcing the understanding that RF refinement is contingent on the spatial coincidence of multiple unisensory stimuli, purposefully exposing dark-reared animals to spatially mismatched visual–auditory stimuli, leads to the development of SC neurons with spatially disparate unisensory RFs (Wallace and Stein, 2007). In similar manner, early studies conducted in barn owls showed that large spatial mismatches were induced in the optic tectum by raising owls in displacing prisms mounted in spectacle frames in front of the eyes to offset visual RFs from unmodulated auditory RF development (Knudsen and Brainard, 1991).
Given the breadth and complexity of the neural projections to SC, it is still unclear what neural circuitry is necessary to maintain SC RF spatial congruence. To investigate, a cat model was selected for its extensive, direct cortical projections to SC from both the anterior ectosylvian sulcus (AES) and the rostral lateral suprasylvian sulcus (McHaffie et al. 1988; Stein and Meredith, 1993; Fuentes-Santamaria et al. 2009; Chabot et al. 2013). While both projections influence SC multisensory integration (Wallace and Stein, 1994; Wilkinson et al. 1996; Alvarado et al. 2007; Jiang et al. 2007), AES is believed to possess the strongest modulation (Stein and Stanford, 2008). Functionally, AES has been divided into three areas: the auditory field of the anterior ectosylvian region (FAES) (Meredith and Clemo, 1989; Clarey and Irvine, 1990), the anterior ectosylvian visual area (AEV) (Mucke et al. 1982; Olson and Graybiel, 1987), and the fourth somatosensory area (SIV) (Clemo and Stein, 1983; Burton and Kopf, 1984). Not exclusively unisensory, each AES functional subdomain has been found to possess multisensory information, especially at the borders (Wallace et al. 2006). While lacking SC's precise spatiotopic layout but possessing a similar range of sensory content, AES is also thought to play a role in orienting and alerting behavior (Wilkinson et al. 1996).
In this study, we used reversible cortical deactivation to examine the influence of AES on the spatial registration of auditory and visual modalities upon individual SC multisensory neurons. In addition to assessing whether (and how) temporary removal of AES influences the congruence of visual and auditory RFs in SC multisensory neurons, we also analyzed the correlation between any changes in RF congruence and the change in multisensory enhancement (ME) in each case. Our results show that a properly functioning AES is vital for the maintenance of congruence of visual and auditory spatial RFs in SC multisensory neurons.
Materials and Methods
General Procedures
Experiments were done in 6 adult cats (age: 1~2.5 years; weight: 2.5~4 kg; male: n = 3; female n = 3) raised under standard housing conditions. All experimental procedures were performed in compliance with the Guide for the Care and Use of Laboratory Animals of East China Normal University and approved by the local ethical review committee of East China Normal University. All experiments were conducted in an anesthetized and paralyzed semichronic preparation on a weekly basis in each of the animals (see details below). The frequency of recording sessions and the features examined during each session were selected and implemented to both minimize the number of animals used and to reduce discomfort.
Surgical Preparation
Aseptic surgical techniques for implanting deactivation coils were similar to those previously described (Yu et al. 2013; Yu et al. 2016; Jiang et al. 2001; Alvarado et al. 2007). Animals were pretreated with dexamethasone sodium phosphate [1 mg/kg, intramuscular (i.m.); Jinhua MuZiJia Veterinary Medicine Company, Zhejiang, China] 12 h prior to surgery. On the day of surgery, the animal was sedated with ketamine hydrochloride (20~25 mg/kg, i.m.; HengRui Medicine Co. Ltd, Jiangsu, China), and acepromazine maleate (0.05 mg/kg, i.m.; Ennopharm Co. Ltd, Shanghai, China). Next, the animal was placed in the stereotaxic apparatus (Jiang-wan II type, The Second Military Medical University, Shanghai, China). Anesthesia for surgery was maintained via intravenous (i.v.) injection of sodium pentobarbital (Sigma; loading dose: 5 mg/kg; maintaining dose: 3 mg/kg/h). During surgery, body temperature was maintained around 37.5°C using a heating pad. Blood pressure, heart rate, and core temperature were monitored continuously (Top 1800 Digital Vital Signs Monitor; Dongtang Technology Co. Ltd, Beijing, China).
Craniotomies were made to expose AES unilaterally. The overlying dura was reflected, and the sulcal walls were gently retracted to allow the careful placement of the prepared stainless steel cryogenic coils in the depths of the sulcus (tubing inner diameter, 0.6 mm; outer diameter, 0.8 mm, Lomber et al. 1999; Jiang et al. 2001). The portion of cryogenic coil inserted into AES is a rounded rectangle of approximately 4 × 10 mm, specifically shaped to fit the curvature of the target sulcus. Considering the area covered by the cooling device and responses recoded from electrodes implanted in AES (n = 15), we concluded that the majority of neurons in the 2 relevant subregions (FAES; AEV) were deactivated during cooling. Deeper regions (e.g., SIV) showed the effects of partial deactivation in diminished neural responses. After implantation, the dura was returned to its normal anatomical position and covered over with saline-saturated gelfoam (Kuai Kang, Guangzhou, China) and the craniotomy was sealed with dental cement. The stems and the well were then secured to the skull with stainless steel screws and orthopedic cement. The protruding stems of the cooling coils (needed for connection to the coolant flow during AES deactivation) were fully housed within a protective stainless steel well with a removable cap. A second stainless steel recording well was secured to the skull over the SC access craniotomy. This arrangement allowed the head to be secured during recording later without obstructing the face and ears. Prophylactic antibiotic treatment (Baytril: 4 mg/kg; Bayer AG, Leverkusen, Germany) was administrated for 7 days after surgery. Postsurgical analgesics were administrated as needed. After a recovery period of no less than 10 days, the animals were then able to begin neurophysiological recording.
Recording Procedures
Animals were used for SC neuron recording sessions no more frequently than once per week. Immediately prior to each recording session, animals were lightly anesthetized with ketamine hydrochloride (20–30 mg/kg, i.m.) and acepromazine maleate (0.05 mg/kg, i.m.) prior to being intubated by mouth. Following successful intubation, the animals were then moved to a double-walled shielded room for electrophysiological recordings, in which the inner walls were coated with a convoluted polyurethane foam to reduce echoes and environmental noise. A head-holding system (RWD Life Science, Shenzhen, China) was used to keep the animal comfortably in a natural recumbent position. The intubation tube was connected to an ALC-V8A respirator (Shanghai ALCOTT Biotech Co. Ltd., Shanghai, China) for artificial respiration during the paralysis, which was initially induced by an injection of gallamine triethiodide (6~8 mg/kg, i.v.; Shanghai Dongfang, Shanghai, China) to prevent movement during recording. Throughout the experiment, anesthesia, paralysis, and hydration were maintained via a continuous intravenous infusion of ketamine hydrochloride (6–8 mg/kg/h) and gallamine triethiodide (3~4 mg/kg/h) in 5% dextrose solution (3–6 mL/h) through the saphenous vein. Blood pressure, heart rate, SpO2 (>90%), and respiratory CO2 level (4–5%) were monitored continuously throughout the experiment (Top 1800 Digital Vital Signs Monitor; Dongtang Technology Co. Ltd.). Body temperature was kept near 37.5 °C throughout the procedure using a heating pad. The animal's pupils were dilated with ophthalmic atropine sulfate (Shanghai General Pharmaceutical Co. Ltd., Shanghai, China), and the eyes were fitted with contact lens (Web Science Technology Development Co. Ltd., Wuhan, China) to correct the refractive error introduced by paralysis.
Conventional electrophysiological methods were used for single-neuron recording (Xu et al. 2012, 2014; Yu et al. 2016). In brief, glass coated, epoxy-insulated tungsten electrodes (impedance: 1–3 MΩ at 1 KHz; H-J Winston, Clemmons, NC, USA) were slowly lowered to the surface of the midbrain SC manually and then advanced via a hydraulic microdrive (Model: 50-12-1 C; FHC, Bowdoin, ME, USA). The electrode signals were band-pass filtered (300 Hz–10 kHz), amplified (×10,000, Model 1700 amplifier; A-M system, WA, USA), digitized (NI USB-6363; National Instruments, Austin, TX, USA) at 20 kHz, and then recorded on a PC workstation. At the end of each recording session, the animal was recovered to stable respiration and coordinated locomotion and then returned to its home cage.
Deactivation of AES
Focal cortical deactivation was effected via cryogenic cooling. This technique was chosen for its speed of action, its reliable reversibility, and its restricted impact on the SC having already been well-documented (Jiang et al. 2001; Lomber and Malhotra, 2008; Yu et al. 2013, 2016). As shown in Figure 1A, unilateral deactivation of AES ipsilateral to the SC studied was induced by circulating refrigerated water (near 0°C) through the implanted coil until the temperature of the adjacent tissue stabilized at a level below that required for normal AES functioning (Jiang et al. 2001). Figure 1B shows the visual responses recorded in the AES of one animal, the middle panel showing that the cooling process has completely deactivated the AES neuron's responses 5 min after cryogenic inactivation was initiated. AES reactivation was effected by emptying the coil of refrigerated water and allowing passive rewarming to take place. Data collection could then resume after rewarming for a minimum of 5 min, as evidenced by the restoration of AES responsiveness in the upper panel. The same sequence of AES deactivation and rewarming/reactivation was undertaken while recording individual neural responses in SC, as shown in Figure 1C. After initial pilot testing confirmed the lack of cryogenic cooling's impact upon SC neural responses following AES rewarming, we did not record SC responses after AES reactivation, primarily to allow for more extensive RF spatial testing.
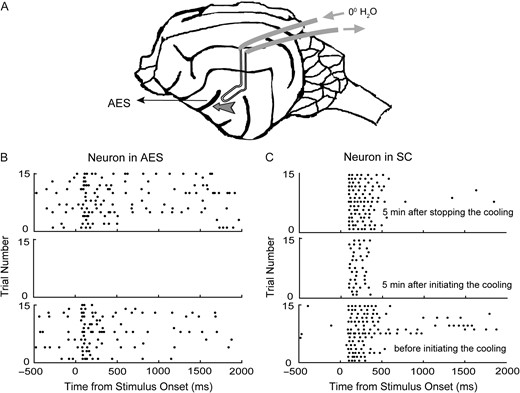
Cryogenic blockade of cortical activity induced via implanted cooling loops. Cartoon A shows a schematic of the brain and cooling loop placement. The cooling loop was inserted into the AES during surgery (denoted by the arrow). Detachable tubes were used to circulate refrigerated water through the previously implanted loop (normally closed/sealed) to deactivate adjacent cortical tissue during the course of a recording session. Raster plots B and C show 2 neurons’ visual responses recorded before (bottom row), during (intermediate), and after (top) cortical deactivation. In each raster panel, each dot represents one spike, and each line of dots represents the neuron's response to 1 trial exposure. Note that all visual responsiveness and spontaneous activity in the AES neuron (B) were extinguished during active cooling and visual responses in the SC neuron were diminished during cortical deactivation.
Stimulus Presentation and RF Mapping
While advancing the electrode during a recording session in the SC, each neuron detected via its spontaneous activity was qualitatively evaluated for its responsiveness to sensory stimulation. Monitoring the recording amplifier with headphones, neurons encountered were given a manual presentation of visual (flashed or moving spots or bars of light from a hand-held ophthalmoscope) and auditory (clicks, claps, whistles, and hisses) stimuli to determine a rough visual and auditory RF. A multisensory neuron was then defined if the neuron responded discernably to both visual and auditory stimuli presented individually.
Following this assessment, quantitative sensory tests were performed on multisensory neurons that consisted of computer-triggered auditory and visual stimuli presented alone and in combination. The visual test stimuli consisted of a flash of white light (duration: 100 ms; intensity: 3–15 cd/m2) against a uniformly dark background (0.25 cd/m2), emitted from stationary light emitting diodes (LEDs). Auditory stimuli consisted of 100-ms duration broadband (20–20 kHz) noise bursts (on/off time: 5 ms) with intensities ranging from 40 to 70 dB sound pressure level (SPL) against an ambient background of 29–31 dB SPL, delivered by speakers (FS Audio, Zhejiang, China). SPLs were measured at the spatial center of the animal's head with a 0.25 inch condenser microphone (model 7016; ACO Pacific, Belmont, CA). Both LEDs and speakers were mounted onto a stainless steel hoop (radius: 60 cm) at azimuth locations ranging from −90° to 90° in 15° increments (midline being 0°). The hoop was placed 60 cm in front of animal's head and could be manually rotated in elevation from+75°(above) to −75°(below). The cross-modal test stimulus consisted of either a simultaneous presentation of visual and auditory stimuli or the visual stimulus preceded auditory stimulus by 50ms. Stimuli were presented in pseudorandom order with an interstimulus interval of 4 s.
Azimuthal spatial tuning profiles were examined by varying the location of a modality-specific stimulus. Visual or auditory stimulus emitted randomly from 1 LED or 1 speaker was presented in pseudorandom order at an intertrial interval of 4 s. The total number of individual stimulus presentations in each location ranged from 15–20 per location. The visual stimulus consisted of a 100-ms flash of light at an intensity of 8 cd/m2. The auditory stimulus given was 100-ms noise burst at 55 dB SPL. For a portion of the neurons tested, RF profiles were also measured at 3 different intensities (auditory: ~45 dB, ~55 dB, ~65 dB; visual:~4 cd/m2; ~8 cd/m2; ~12 cd/m2).
Data Acquisition and Analysis
Custom-built software (Matlab R2011b; Mathworks, Natick, MA, USA) controlled the stimulus parameters, timing, and structure of all trials presented. Raw neural signals were recorded and stored for offline analysis. Spike sorting was performed using Spike 2 software (CED version 6; Cambridge, UK). A threshold criterion of no less than 4-fold standard deviations (SDs) above background were used for identifying spike peaks. The detected waveforms were then clustered by the principal component analysis and sorted into individual units using an automated Bayesian sort routine. Relative spike timing data for single neurons were then obtained for all stimuli combination and used to construct both raster plots and peristimulus time histograms (PSTHs) using custom Matlab scripts.
For analysis, the mean spontaneous firing rate was calculated from a 500ms window immediately preceding the stimulus onset. Response onset was defined as the first spike time within a 10-ms bin at which the PSTH crossed above a virtual threshold of 2 SDs above the baseline rate and remained above this value for at least 20 ms. Response offset was set as the time point where activity returned to below 2 SDs from baseline activity for at least 20 ms. The mean stimulus-evoked response was then the average number of impulses across trials in the window from response onset to offset minus the number of spikes expected from the spontaneous firing rate. For a few cases where the neuron's response had a prolonged silent period between response onset and offset, such that the program failed to define the window according to the parameters stated above, the response window was set manually.
To examine the effects of multisensory integration, an index of ME was used. It was defined as %ME = [(CM − SMmax)/SMmax] × 100, where CM was mean response to visual–auditory stimuli per trial, and SMmax was mean response to the most effective modality-specific stimulus per trial. Data analysis was also performed using Matlab. Student t-test, paired t-test, analysis of variance, Pearson correlation test, and Mann–Whitney U test were used where appropriate to calculate mean differences. In all cases, statistical significance was defined as P < 0.05 and data are expressed as mean ± SD.
Results
A total of 114 visual–auditory multisensory neurons recorded in cat SC were examined in this study. All recorded neurons were in the deep layer of SC (1500–3800 nm below the surface of SC). Unisensory and multisensory response properties were first evaluated and then RF profiles in azimuth were mapped under control, AES deactivation, and in a limited set, AES reactivation conditions. In addition, 35 multisensory SC neurons were held for a sufficient period of time to permit full testing in low, intermediate, and high stimulus intensities for both visual and auditory RFs in the control and AES deactivation conditions (see details in Materials and Methods).
AES Deactivation Degraded the Congruence of Visual and Auditory RFs
Before AES deactivation, the majority of multisensory neurons tested in the deep SC (78%, 89/114) could be accurately fitted by a Gaussian function and expressed RF sizes of less than 150° azimuth. Their visual and auditory RFs were well registered spatially (t-score: 0.31 ± 0.19), thereby establishing the baseline for expected spatial alignments of unimodal RFs. More detailed analysis was then focused on these 89 neurons. A typical case is shown in Figure 2A (left columns), where the bell-shaped visual and auditory RFs overlapped well (t-score, 0.41) and centers of visual (14°) and auditory (26°) RFs were quite closely aligned. For the majority of cases (79%, 70/89), the auditory RF center was not completely aligned with (less than 5° separation between visual and auditory RF centers) but slightly displaced peripherally to its visual counterpart (Fig. 3A). The mean difference (auditory RF center − visual RF center) between visual and auditory RF centers was 9.4° ± 5.1° (paired t-test, P < 0.001; auditory RF center vs. visual RF center).
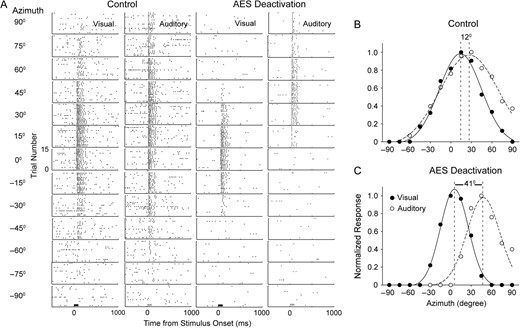
The impact of AES deactivation on visual and auditory RFs in an SC multisensory neuron. Shown in Panel A are the neuron's unisensory responses at different spatial locations during control (left columns) and AES deactivation (right columns) conditions. The bar underneath the lowest panels shows the stimulus presentation period (visual: dark; auditory: gray). Mean response magnitude per trial was measured in each spatial location and was normalized by the largest mean response detected in any spatial location. Plot B represents the unisensory auditory and visual receptive field alignment seen in SC without AES cooling (here, peak responsiveness offset by 12°). Plot C shows the impact of AES deactivation on SC receptive field alignment. In both plots B and C, the filled and unfilled circles represent the visual and auditory responses by location, respectively. The individual unisensory responses across the spatial range tested were fitted by a Gaussian representing the total response function (visual: solid; auditory: dashed). The vertical dash lines represents the RF centers (as measured from the Gaussian curves) and the number between the 2 lines represents the degrees of offset between the unisensory peaks.
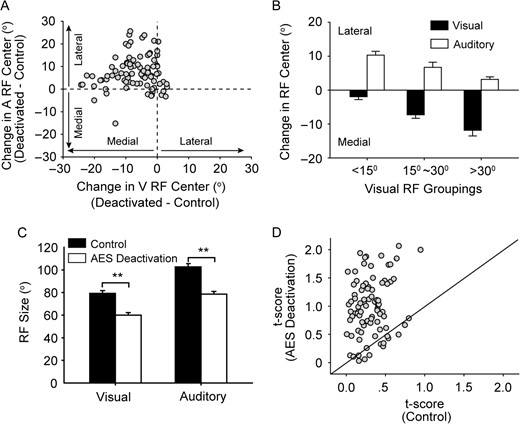
The effect of AES deactivation on SC RF alignment as a population. A: the change in visual (V) RF center was compared with the corresponding change in auditory (A) RF center. Note that visual RF center in most cases shifted toward the medial (nasal) side when AES was deactivated, and inversely, auditory RF center shifted toward the lateral side in most cases. Vertical and horizontal dash lines denote no visual and auditory RF center change, respectively. Bar graph B shows the mean spatial shift of RF center (deactivated versus activated) for neurons grouped by RF center location within the visual field; near central (<15°; Group 1), intermediate (15°–30°; Group 2); or more peripheral (>30°; Group 3). The error bars shown represent the standard error of the mean. Bar graph C summarizes the significant changes in horizontal RF size across the population, tested in both control (filled bar) and cortical deactivation (unfilled bar) conditions. In graph D, a comparison of t-scores is plotted between control and AES deactivation conditions.
With AES deactivation (Fig. 2A, right columns), the overlap between visual and auditory RFs substantially decreased (t-score: 1.32), which appeared to be caused by a shift of RF centers (Visual: 6°; auditory: 47°) and a contraction of RF size (visual: 33% decline; auditory: 44% decline). Across the population tested, AES deactivation resulted in 6.9° ± 6.6° of shift toward the nasal side for visual RFs and 7.2° ± 7.4° of shift toward the peripheral side for auditory RFs; Visual RFs in 53% (47/89) of cases and auditory RF in 71% (63/89) of cases have greater than 5° shift distance. Thus, the mean difference between visual and auditory RF centers was significantly increased from 9.4° ± 5.1° to 21.5° ± 9.4° following AES deactivation (paired t-test, P < 0.001). The change in visual RF center was compared with the corresponding change in auditory RF center (Fig. 3A). In nearly half of cases (44%, 39/89), RF center difference increased by more than 15°. To more precisely analyze this issue, neurons were classified into three groups according to the spatial position of the visual RF center measured prior to deactivation. It became evident that neurons (n = 32) with visual RF centers in the region of central space (−15° to 15° azimuth, mean visual RF center: 4.9° ± 6.9°) had largest auditory RF displacements but relatively small visual RF displacements when AES was deactivated (Fig. 3B). Inversely, neurons (n = 22) whose visual RF center was located more peripherally (>30°, mean visual RF center: 36.9° ± 6.5°) had the largest visual displacement upon AES deactivation. For neurons (n = 35) with a visual RF center between 15° and 30° (mean visual RF center: 23.8° ± 4.6°) had a similar degree of RF center displacement for both modalities.
Paralleling the finding in RF displacement, the mean visual and auditory RF size decreased with AES deactivation, as shown in Figure 3C. Visual RF size decreased from 79.3° ± 21.5° to 60.2° ± 20.9° when AES was deactivated with a similar change of auditory RF size from 102.1° ± 27.9° to 78.6° ± 23.4°. Further analysis showed that the displacement of the RF center was significantly correlated with the shrinkage of RF size across populations for each modality (V: r = 0.57; P < 0.001; A: r = 0.52; P < 0.001). Due to the combined effects of RF center displacement and decrement of RF size, the t-score greatly increased from 0.31 ± 0.19 in control recordings to 0.99 ± 0.52 during AES deactivation, documenting that AES deactivation significantly disrupted the overall congruence between visual and auditory RFs (Fig. 3D, paired t-test; P < 0.001). In the next section, we examined whether this decline in congruence between visual and auditory RFs significantly influenced the integrating capacity for visual and auditory cues.
Relationship between Changed RFs and Integrating Properties
Similar to previous reports (Jiang et al. 2001; Alvarado et al. 2007), the results here show that AES deactivation degrades SC neurons’ capability to integrate visual and auditory stimuli. An example case is shown in Figure 4A (and is the same neuron shown in Fig. 2). Compared with the responses recorded in the control condition, temporary inactivation of AES decreased responses to visual, auditory, and visual–auditory stimuli (visual and auditory stimuli were located in the overlapping area between visual and auditory RFs), which was consistent with a similar previous study (Alvarado et al. 2007). However, multisensory responses diminished more here, which result in an ME decrement from 46% to 17%. When AES was reactivated, both response magnitude and the ability to integrate multisensory cues were recovered to the pre-deactivation level. For the majority of population (62%, 55/89), AES deactivation caused a greater than 20% decline in ME, which was measured when visual and auditory stimuli were positioned in the overlapping area of RFs (n = 74) or in the central area of the corresponding RF if visual and auditory RFs were completely separated (n = 15). The ME comparison across the population is shown in Figure 4C, and the mean ME was declined to 29.6% ± 18.9% from 58.2% ± 27.9% during AES deactivation (paired t-test; P < 0.001) close to that found in a related study (Alvarado et al. 2007).
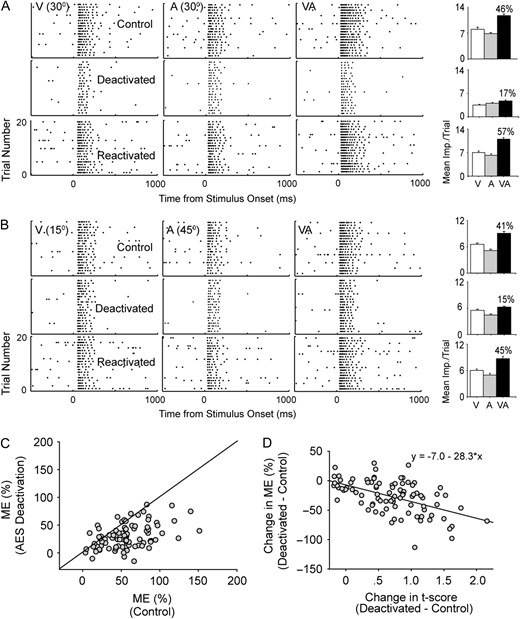
ME reductions caused by AES deactivation was significantly correlated with the separation of visual–auditory RFs. The panel sequence above shows the results of spatially paired (A) or unpaired (B) sensory stimulation. The raster sequences show the neuron's responsiveness to visual (left column), auditory (middle), and visual–auditory (right) stimuli under 3 conditions: control (top), during deactivation of AES (middle), and following recovery from deactivation (bottom). The number given in each raster plot represents the stimulus location in azimuth. The corresponding bar graphs show the mean magnitude of responses and the number above the bar represents the percent ME. Note that AES deactivation causes a decline in ME regardless of spatial pairing. Graph C shows the plot of ME for all neurons tested in control and AES deactivation conditions. Finally, in graph D, the change in ME between control and AES deactivation was plotted against its change in t-score. As unimodal RF spatial separation increases (represented by a gain in t-score), ME decreases reliably (R = 0.58). The line of best fit (formula above) illustrates the relationship.
We reasoned that this decrement in SC multisensory integration might be correlated with the separation of visual–auditory RFs. A previous report showed that SC neurons’ capacity to integrate multisensory cues develops only with proper registration between visual and auditory RFs (Wallace and Stein, 1997). To test this hypothesis, we compared the change in ME and the change in t-score (Fig. 4D). It was evident that the former was well correlated with the latter (r = −0.45, P < 0.001), suggesting that the more separated visual and auditory RFs were during the course of AES deactivation, the more reduced ME became.
One will raise the possibility that AES deactivation just causes a change in the integrating pattern of SC neurons such that integrating enhancement may still occur but is now dependent on achieving temporally coincident unimodal stimulation in the new RF centers because of RF separation. The data, as exemplified in Figure 4B, failed to support this idea. An analysis of the population of SC multisensory neurons tested for ME when test stimulus was positioned in the center of each corresponding new RF in both AES deactivated and reactivated conditions showed the similar decline from 53.6% ± 25.7% to 25.9% ± 15.5% (mean ME, n = 55, paired t-test; P < 0.001). This suggests that the deactivation of AES appears to generalize to ME reduction without respect to the placement of unimodal stimulus in the corresponding spatial RF.
Stimulus Effectiveness Influenced the Impact of AES on SC Multisensory Neurons
To further explore the conclusion given above, the effect of changing RF size by modulating stimulus intensities on neurons’ multisensory integration was examined in 35 neurons. It was generally the case for neurons tested that increasing stimulus intensity could broaden the size of unimodal RFs and increase the overlap between visual and auditory RFs regardless of AES deactivation. This effect is illustrated in Figure 5, where the separation level between auditory and visual RFs of this exemplar neuron, as denoted by t-score, increased during cortical deactivation at each level of intensity. This difference is more pronounced in the low (0.45 vs.1.89, t-score in control vs. AES deactivation) than intermediate (0.33 vs.1.04), and high (0.22 vs.0.66) stimulus intensities. Closer inspection revealed that the RF center did not substantially change with stimulus intensities, suggesting that the high RF congruence seen in the condition of high stimulus intensity during AES deactivation can be attributed to the relatively large RF size. Population comparison (Fig. 6A–C) supports this finding at low (0.54 ± 0.22 vs. 1.40 ± 0.67, t-score in control vs. AES deactivation), intermediate (0.36 ± 0.13 vs. 0.80 ± 0.36), and high (0.31 ± 0.14 vs. 0.44 ± 0.22) intensities (Fig. 6G).
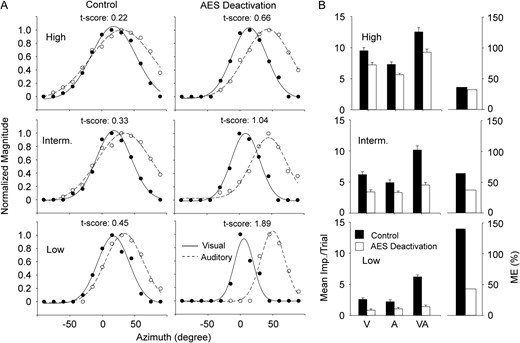
AES deactivation disrupts the spatial congruence of visual–auditory RFs and results in decreased ME despite stimulus intensity. Panel A shows the visual (solid line) and auditory RFs (dashed line) plotted across the testing range in both control (left column) and AES deactivation (right) conditions for high (top row), intermediate (middle), and low (bottom) stimulus intensities. Conventions are otherwise the same as Fig. 2. The bar graphs in panel B show the mean magnitude of neuron's responses to visual, auditory, and visual–auditory stimuli (left set) as well as ME (right set) in both control (filled) and AES activation (unfilled) conditions.
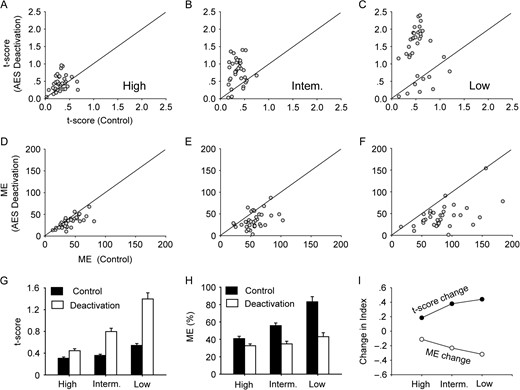
Population comparisons reveal the influence of AES on SC is modulated by stimulus intensity. Graphs A–C show t-scores in control versus AES deactivation conditions for low (A), intermediate (B), and high (C) stimulus intensity conditions. Similarly, ME comparisons are shown in graphs D–F. Bar graphs summarize the mean t-score (G) and mean ME (H) comparisons across different intensity conditions, showing that the effects of AES deactivation are still sensitive to all stimulus intensities but are most pronounced in low drive state. This idea is summarized in graph I, where indices of ME change (unfilled) and t-score change (filled) are given across stimulus intensities. The formulas used: t-score change index = (t-scorecontrol − t-scoredeactivation)/(t-scorecontrol + t-scoredeactivation); ME change index = (MEcontrol − MEdeactivation)/ (MEcontrol + MEdeactivation).
In agreement with the RF change, the change in ME expressed this similar pattern.
This phenomenon, called the multisensory principle of inverse effectiveness (Stein and Stanford, 2008), has been followed in our experimentation, in that, changes seen in ME were most pronounced in the low stimulus condition (Fig. 5B). The population data (Fig. 6D–F) confirm that when AES was deactivated, mean ME across the population decreased in each level of stimulus intensity but more (83.2% ± 34.7% to 43.9% ± 27.2%) in the low effective condition and less (intermediate: 55.8% ± 18.3% to 34.8% ± 18.2%; high: 40.9% ± 15.9% to 32.7% ± 12.7%) as the stimulus intensity increased (Fig. 6H). Thus, with the decline of stimulus intensities, both the extent of RF separation and ME decrement increased (Fig. 6I), suggesting that the effect of AES modulation on SC ME functions through altering the spatial congruence of unimodal RFs in SC.
Discussion
Using cryogenic cortical deactivation, this study was directed at understanding the influence of AES on SC. Of specific interest was whether deactivation of AES induced RF realignment between the different modalities represented in SC multisensory neurons and discovering whether this change was correlated with a change in multisensory integrative capability. The data presented here demonstrate that AES deactivation does result in increased spatial separation between visual and auditory RFs of SC multisensory neurons, providing insight into the mechanism of decreased SC neurons’ integrative capability. In addition, these findings follow existing understandings regarding the influence of AES on SC, namely that it varies with the effectiveness of stimuli and exhibits the most influence during low intensity stimulation. These findings provide the neural substrate for dynamic arrangement of unimodal RF location for SC multisensory neurons and help us more deeply understand the role of connected high-order association cortices on SC.
The results in this study revealed the slight separation between visual and auditory RFs of SC multisensory neurons, which is consistent with a previous study examining the same (Xu et al. 2014). However, this study, to the best of our knowledge, clearly demonstrates for the first time that visual RFs in individual SC neurons are normally arranged slightly central when compared to their auditory RF. Although previous studies examined the influence of association cortices on SC, these were primarily focused on only whether association cortices were important for SC multisensory integration and its development (Jiang et al. 2001; Alvarado et al. 2007; Yu et al. 2013; Rowland et al. 2014). This study further deepens our understanding of the role of association cortices on SC. At present, it is uncertain whether this function is accomplished via a direct corticocollicular pathway or is the result of an indirect multisynaptic route via the striatum and substantia nigra pars recticulata pathway (Rhoades et al. 1982; Faull et al. 1986; Harting et al. 1988) or some combination of both. Given the influential character of AES’ connection with SC, any other brain region that can affect AES is likely also influencing SC and its capacity to integrate multisensory stimuli. Also, as AES is divided roughly into unisensory domains, it could be tremendously insightful to selectively deactivate these AES areas individually and examine their influence on SC RF alignment and integrative capacity. At current, a lack of clearly defined anatomical bounds of these functional domains and the degree of surgical difficulty limit our ability to accomplish this, although it is an aim of our future work.
During cortical deactivation, multisensory SC neurons change both their unimodal RF center and size but retain the ability to realign their spatial tuning upon AES reactivation. This conserved unimodal capacity suggests that SC processing of a modality-specific stimulus may not be significantly affected by AES modulation. This postulate is further supported by an early behavioral study, in which deactivation of AES severely disrupted cats’ ability to use cross-modal cues to enhance their performance to locate and approach a given target (a behavior presumably involving the circuitry of the SC) but left unimpaired their ability to use modality-specific cues to do this task (Wilkinson et al. 1996). This effect also has been seen in the auditory system, where accurately determining the spatial location of sound sources was found to be heavily reliant on the posterior auditory cortical area (Lomber and Malhotra, 2008) and in the visual system, where the visual dorsal processing stream was found necessary for determining where an object was (Ungerleider and Haxby, 1994). Taken together, these results suggested that different cortical regions (or possibly different corticotectal projections) are involved in specific modality roles in cue localization tasks.
Although the exact biophysical reason for why RF separation causes a substantial degradation of SC ME is unclear, a partial explanation might be due to the failure of multisensory cues from the same objects and/or events to fall into an equivalent overlapping area of the visual and auditory RFs. For example, if a visual stimulus falls within its RF but the auditory stimulus falls outside its RF, the auditory stimulus will either have no effect on the neuron's response or will depress responses to the visual stimulus; an effect believed to be mediated via direct tectopetal inhibition (Kadunce et al. 1997). Previous work has demonstrated that RF structure in multisensory neurons is heterogeneous and plays an important role in both sensory responsiveness and multisensory integrative capacity (Krueger et al. 2009; Ghose and Wallace, 2014). However, AES deactivation appears to have the ability to degrade multisensory integration regardless of whether multisensory cues are spatially paired with respect to unisensory RFs.
After AES deactivation, responses to visual and/or auditory stimuli in many locations of azimuth were reduced, as shown in Figure 2. Despite this, multisensory integration was also degraded, which seems to run counter to the principle of inverse effectiveness. The reason for this effect, we believe, is that the multisensory principle of inverse effectiveness controls how multisensory inputs are combined in SC when RFs of different modalities are roughly well aligned to each other. In the absence of sufficient spatial co-registration of unimodal RFs, this integrating principle cannot govern cross-modal integration as expected. This hypothesis is also supported by previous findings that SC multisensory neurons in dark-reared animals lack functional registration between visual and auditory RFs and similarly fail to effectively integrate visual and auditory inputs across different intensities of stimuli (Wallace et al. 2004; Yu et al. 2013). In the control condition, SC multisensory neurons exhibit a high degree of spatial congruence between visual and auditory RFs, and integrate spatially paired visual–auditory stimuli largely according to the principle of inverse effectiveness. This is why ME is the lowest in the high stimulus condition although spatial congruency between visual and auditory RFs is the greatest.
In the SC, different sensory maps (visual, auditory, somatosensory) are dynamically registered with each other. Resolution of reference systems involving the localization of acoustic cues is based on head-centered coordinates, and visual cues are thought to be encoded on eye-centric references. Due to this shift in reference coordinates, the movement of the eyes or the head would naturally cause a mismatch between the different modalities. However, the brain has neural mechanisms to deal with these mismatches. For instance, auditory receptive fields in primate SC are able to shift with changes in eye position (Jay and Sparks, 1987). Visually guided modulations of auditory spatial processing have been widely observed in the context of bringing auditory information (head-centric) and visual information (eye-centric) into a common reference frame (Jay and Sparks, 1987; Knudsen and Brainard, 1991; Groh et al. 2001; Populin et al. 2004). A host of studies have shown higher order cortical areas modulating RF shifts of neurons in lower order cortical and subcortical areas through mechanisms of selective attention, which allocate neuronal processing resources to the most relevant subset of the information provided by an organism's sensors (Compte and Wang, 2006; Womelsdorf et al. 2006; Womelsdorf et al. 2008; ; Ballanger, 2009; Gregoriou et al. 2009). Accordingly, it is entirely possible that AES exerts attention-analogous top-down signals to influence SC RF location processing of different modalities and multisensory cue processing, which is an excellent goal for future experimentation.
Funding
National Natural Science Foundation of China (Grant No. 31300910 to L.Y. and No. 31400944 to J.X.); Shanghai Natural Science Foundation (Grant No.14ZR1411500 to J.X.); the Program of Introducing Talents of Discipline to Universities (Base B16018).
Notes
Conflict of Interest: None declared.
References
Author notes
X.J. and B.T. have contributed equally to this work.