


Abstract
Unlike most languages that are written using a single script, Japanese uses multiple scripts including morphographic Kanji and syllabographic Hiragana and Katakana. Here, we used functional magnetic resonance imaging with dynamic causal modeling to investigate competing theories regarding the neural processing of Kanji and Hiragana during a visual lexical decision task. First, a bilateral model investigated interhemispheric connectivity between ventral occipito–temporal (vOT) cortex and Broca's area (“pars opercularis”). We found that Kanji significantly increased the connection strength from right-to-left vOT. This is interpreted in terms of increased right vOT activity for visually complex Kanji being integrated into the left (i.e. language dominant) hemisphere. Secondly, we used a unilateral left hemisphere model to test whether Kanji and Hiragana rely preferentially on ventral and dorsal paths, respectively, that is, they have different intrahemispheric functional connectivity profiles. Consistent with this hypothesis, we found that Kanji increased connectivity within the ventral path (V1 ↔ vOT ↔ Broca's area), and that Hiragana increased connectivity within the dorsal path (V1 ↔ supramarginal gyrus ↔ Broca's area). Overall, the results illustrate how the differential processing demands of Kanji and Hiragana influence both inter- and intrahemispheric interactions.
Introduction
The Japanese writing system is composed of multiple scripts: Kanji and Kana. Words written in Kanji can be composed of one or more characters. In multiple character words, the meaning of the word can be inferred from that of the individual kanji. For example, “広告” (meaning “advertisement”) contains the character “広” (meaning “wide”) and “告” (meaning “inform”). However, regardless of how many Kanji a word contains, the Kanji themselves do not provide particularly reliable information regarding the pronunciation of the word. In addition, each Kanji character typically has multiple pronunciations, and the correct pronunciation is dependent on the context in which it occurs. For example, the 2 Kanji characters in “広告” are read /kou/ and /koku/, but when written individually which often requires a Hiragana suffix, they are read /hiro/ in “広い” and /tsu/ in “告げる.” These pronunciations and contexts have to be memorized when learning to read. In contrast, the 2 Kana scripts in modern Japanese, Hiragana and Katakana, use characters that do not have any inherent meaning on their own, but their pronunciation is almost completely regular, regardless of the context they occur in. Furthermore, Kana characters are in general less visually complex than the majority of Kanji. Given these differing characteristics, it is not surprising that there is a long history of examining differences in how Kanji and Kana are processed by the brain, with evidence of script differences first reported from the late 19th century onwards by Watanabe (1893, cited in Ichikawa et al. 2011), Miura (1901, cited in Iwata, 1984), and Asayama (1914, cited in Yamadori, 1998). The aim of the current study was to investigate the dynamics of neural processing during skilled Japanese reading of Kanji and Hiragana to test 2 competing hypotheses.
The first hypothesis is that Hiragana involves more left-lateralized brain activation than reading Kanji. This “interhemispheric” hypothesis is consistent with the classical view that left-lateralized brain function for alphabetic or syllabographic scripts (including Kana) is reduced in Kanji (Hatta 1977; Sasanuma et al. 1977). The second hypothesis argues that both Kanji and Hiragana are processed by a common set of essentially left hemisphere regions (Sugishita et al. 1978), but rely on different “intrahemispheric” paths (Iwata 1984; Sakurai 2004). Kana scripts (i.e. Hiragana and Katakana) are processed by a “visual form-to-sound” dorsal path through temporoparietal areas, particularly supramarginal gyrus (SMG; Ha Duy Thuy et al. 2004; Nakamura et al. 2005). In contrast, the Kanji script is processed by the visual form-to-meaning ventral path through left ventral occipito-temporal (vOT) cortex (Ha Duy Thuy et al. 2004; Nakamura et al. 2005).
These 2 hypotheses make testable predictions regarding the functional connectivity within the reading network. For example, the reduction in left lateralization for Kanji posited by the classical view predicts different interhemispheric functional connectivity patterns for Kanji and Hiragana. On the other hand, the left-lateralized model predicts different intrahemispheric functional connectivity patterns for Kanji and Hiragana (Iwata 1984; Sakurai 2004). Note the 2 accounts are not necessarily mutually exclusive and the script differences may manifest in either forward or backward connections.
To explore these possibilities, we used functional magnetic resonance imaging (fMRI) with dynamic causal modeling (DCM) to investigate the effective connectivity within the language network in native Japanese speakers. The regions-of-interest (ROIs) were bilateral vOT cortex, bilateral Broca's area, and left SMG—regions that were robustly activated during both the Kanji and Hiragana tasks. A bilateral model, designed to test for script differences in interhemispheric connectivity in visual areas or Broca's area and its right hemisphere homolog (Ha Duy Thuy et al. 2004; Ino et al. 2009), consisted of left and right vOT and left and right Broca's area. A unilateral model, designed to test for script differences in dorsal and ventral pathways, consisted of 2 left hemisphere paths from primary visual cortex (V1) to Broca's area, via vOT (ventral) and SMG (dorsal). In addition, we tested participants with a range of proficiency with Kanji as we hypothesized that the functional connectivity for Kanji may be affected by one's proficiency.
Materials and Method
Participants
Forty native Japanese speakers gave written informed consent to participate in this study. The data from 6 participants were excluded because of either excessive motion inside the scanner (i.e. motion greater than the dimensions of a voxel; n = 3 participants) or poor performance (i.e. accuracy <60% in one or more conditions; n = 3 participants). Consequently, only data from 34 participants (13 males, 21 females, aged 21–62 years) were included in the final analyses. We hypothesized that the level of proficiency with Kanji may affect the script's functional connectivity, so we tested 2 groups of native Japanese readers: Students studying at the University of Tokyo who were exposed to written Japanese on a daily basis (n = 15, 10 males, 5 females, aged 21–31 years) and Japanese ex-patriots who had lived outside of Japan for a minimum of 3 years and thus had reduced exposure to written Japanese (n = 19, 3 males, 16 females, aged 29–62 years).
All participants were native literate Japanese speakers born and educated in Japan through at least secondary school. All were right-handed except for one who was confirmed to be ambidextrous according to the Edinburgh Handedness Inventory (Oldfield 1971). None reported a history of reading difficulties or neurological problems. Testing in Tokyo was approved by the ethics committees of the Graduate School of Medicine, the University of Tokyo (#2968), and the ethics committee of the Brain Science Institute, Tamagawa University (C21-4). In London, ethical approval was granted by the NHS Berkshire Research Ethics Committee (06/Q1602/20).
Experimental Procedures
The participants' task was to view strings of characters and to decide whether the string formed an existing Japanese word or not. The task involved 60 words, each of which was presented twice—once in Kanji and once in Hiragana. An equal number of nonwords, divided evenly between Kanji and Hiragana, were included to ensure that participants adequately performed the task without simply adopting a “yes” bias (and consequently not reading the stimuli). The word stimuli were carefully matched for visual familiarity, conceptual familiarity (derived by summing familiarity ratings for the visual word and for its auditory form), and mora length (a measure of phonological complexity similar to syllable length; see Table 1; Amano and Kondo 2003a, 2003b). Kanji words had significantly fewer characters but more strokes than Hiragana words, which is an inevitable difference between the scripts. Both Kanji and Hiragana nonwords were created by combining random characters that together did not form a word and were matched with words for the number of strokes and characters.
Properties of word stimuli.
| Kanji words | Hiragana words | t(59) | P-value | |
|---|---|---|---|---|
| Visual familiarity | 4.49 | 4.65 | 0.706 | =0.483 |
| Conceptual familiarity | 4.63 | 4.65 | 0.082 | =0.934 |
| Number of characters | 2.03 | 2.98 | 8.844 | <0.001 |
| Number of strokes | 19.4 | 7.2 | 13.804 | <0.001 |
| Mora length | 2.9 | 2.9 | – | – |
Note: nonwords were matched 1:1 with the same script words for the number of strokes and the number of characters.
Each trial consisted of a fixation cross presented for 500 ms, followed by a horizontally written stimulus presented for 500 ms, and finally a jittered interstimulus interval of 1–4 s (mean = 2.5 s). Consequently, trials had an average length of 3.5 s. Stimuli were pseudorandomized and presented in a blocks of 15 trials (each block lasting 54 s), which included both “yes” and “no” responses in a pseudorandomized order. These were separated by 15 s blocks of fixation that served as an implicit baseline. Each of the 2 runs comprised 8 blocks of task and 8 blocks of rest and lasted 9 min and 12 s. Participants responded by making a button press with either their index or middle finger of their right hand to indicate “yes” or “no”. The response fingers were fully counterbalanced across participants. The stimuli were projected onto a screen and viewed via mirrors attached to the head coil. Participants practiced each task inside the scanner before the main runs began. No items that were used in the practice run occurred during the main experiment.
Participants completed an out-of-scanner assessment of their Kanji reading proficiency (Amano and Kondo 2003a, 2003b). The test required participants to transliterate 100 Kanji words into Hiragana in under 10 min. The Kanji used in this test varies from easy (e.g. “狸”, pronounced /tanuki/, meaning “Japanese raccoon dog”) to very difficult (e.g. “卓袱台”, pronounced /chabudai/, meaning “low dining table”). Higher scores indicate higher Kanji proficiency. For instance, 72% was the average score for Japanese people with higher education (Amano and Kondo 2003a, 2003b). The Kanji proficiency test data from one subject were unavailable as he/she did not follow the test instructions. The mean accuracy for the remaining subjects was 68% with individual scores ranging from 43% to 85%, confirming a wide range of Kanji proficiency across participants.
MRI Acquisition
For the subjects scanned in Tokyo, whole-brain imaging was performed on a Siemens 3-T MRI scanner at the Brain Science Research Center at Tamagawa University. The functional data were acquired with a gradient-echo echo-planar imaging (EPI) sequence (time repetition [TR] = 3000 ms; time echo [TE] = 25 ms; field of view (FOV) = 192 mm; matrix = 64 × 64; voxel size = 3 × 3 × 3 mm) with an ascending noninterleaved acquisition order. For participants in London, whole-brain imaging was performed on a Siemens 1.5-T MRI scanner at the Birkbeck-UCL Neuroimaging (BUCNI) centre. The functional data were acquired with a gradient-echo EPI sequence (TR = 3000 ms; TE = 50 ms; FOV = 192 mm; matrix = 64 × 64; voxel size = 3 × 3 × 3 mm) with an ascending interleaved acquisition order. In both cases, a run consisted of 187 volumes, and as a result the 2 runs together took 18.7 min. In addition, a high-resolution (1 mm3) T1-weighted anatomical scan was acquired for localizing the functional data on the individual's brain anatomy.
Behavioral Analyses
In the behavioral data, items whose accuracy was at chance (≤50%) were excluded from all analyses (n = 9). Although nonword trials are generally excluded from behavioral analyses, they were included in the current study because the input to the DCM is an entire time series, that is, words, nonwords, and fixation (see below). Reaction times (RTs) were recorded from the onset of the stimulus, and anticipatory responses (i.e. RTs <300 ms) were trimmed (0.05% of trials). To minimize the effect of outliers, median RTs per condition per subject were used in the statistical analyses (Ulrich and Miller 1994). The behavioral data were analyzed using a 2 × 2 repeated-measures analysis of variance (ANOVA) with lexicality (word and nonword) and script (Kanji and Hiragana) as independent factors. Accuracy and RTs were the dependent measures.
fMRI Data Preprocessing
The imaging data were processed using SPM8 (Wellcome Trust Centre for Neuroimaging, London, UK, http://www.fil.ion.ucl.ac.uk/spm/). The first 4 volumes of the Tokyo data (i.e. 3 T) were discarded in order to allow for T1 equilibrium, whereas only 2 volumes of the London data (i.e. 1.5 T) were discarded. All functional volumes were spatially realigned and unwarped to correct for artifacts caused by movement-by-inhomogeneinty interactions (Andersson et al. 2001). They were then spatially normalized to the MNI-152 space using a nonlinear registration procedure (Friston et al. 1995), maintaining the original resolution. Finally, the normalized images were smoothed with an isotropic 8-mm full-width at half maximum Gaussian kernel. Time series from each voxel were high-pass filtered (1/128 Hz cutoff) to remove low-frequency noise and signal drift.
First-Level Analyses
The preprocessed functional volumes were then entered into a first-level, fixed-effects analysis that combined the 2 runs from each participant. The onsets of stimuli were modeled as delta functions convolved with a canonical hemodynamic response function (Glover 1999), which provided regressors for the general linear model (GLM). There were 6 conditions (Kanji high visual familiarity words, Kanji low visual familiarity words, Hiragana high visual familiarity words, Hiragana low visual familiarity words, Kanji nonwords, and Hiragana nonwords). Note that the conditions contained both correct and incorrect trials because DCM analyses input the entire time series. Fixation served as an implicit baseline. Note that the effect of familiarity is reported in Twomey et al. (2012), but was not included as a modulatory factor in the DCM analyses for 2 reasons. First, this factor was only manipulated across word stimuli and not nonwords, and thus it was not possible to test its interaction with the lexicality factor. Secondly, focusing the DCM analysis on the script factor helped to maintain a reasonable complexity of our DCMs and a relatively manageable size of the DCM model space.
Second-Level Analysis and ROI Selection
Six contrasts were computed and entered into a second-level, 1 × 6 ANOVA with condition as a within-subject factor. The purpose of the second-level analysis was to identify clusters of activity for each of the ROIs. These included vOT cortex bilaterally, a bilateral region of Broca's area located specifically in pars opercularis (pOp) near the junction of the inferior frontal and precentral sulci, left primary visual cortex (V1), and a dorsal region of the left SMG anterior to the posterior ascending ramus of the Sylvian fissure. These sites were chosen because they allowed the creation of bilateral and unilateral models that could test the 2 hypotheses and importantly, each showed consistent, strong activation across conditions relative to fixation, which is important when choosing regions for DCM analyses. Each cluster was thresholded such that it best corresponded to the anatomical ROI as visualized on the mean brain of all participants (i.e. did not cross anatomical boundaries) and independently verified by 2 of the authors (K.J.K.D. and ‘Ō.P.J.) (see Fig. 1). In addition, the V1 ROI was restricted to the left hemisphere. Details of the location and size of the ROIs are shown in Tables 2 and 3. Additional analyses investigated the effects of lexicality and Kanji reading proficiency on activation (Supplementary Materials for Results).
ROIs used in bilateral models
| ROI | Center of gravity (MNI) | Number of voxels | ||
|---|---|---|---|---|
| Left vOT | −44 | −60 | −12 | 15 |
| Right vOT | 46 | −53 | −12 | 11 |
| Left pOp | −48 | 25 | 22 | 9 |
| Right pOp | 56 | 25 | 29 | 15 |
| ROI | Center of gravity (MNI) | Number of voxels | ||
|---|---|---|---|---|
| Left vOT | −44 | −60 | −12 | 15 |
| Right vOT | 46 | −53 | −12 | 11 |
| Left pOp | −48 | 25 | 22 | 9 |
| Right pOp | 56 | 25 | 29 | 15 |
ROIs used in unilateral models (all left hemisphere).
| ROI | Center of gravity (MNI) | Number of voxels | ||
|---|---|---|---|---|
| V1 | −5 | −80 | 10 | 29 |
| vOT | −44 | −60 | −12 | 15 |
| SMG | −51 | −41 | 55 | 18 |
| pOp | −48 | 25 | 22 | 9 |
| ROI | Center of gravity (MNI) | Number of voxels | ||
|---|---|---|---|---|
| V1 | −5 | −80 | 10 | 29 |
| vOT | −44 | −60 | −12 | 15 |
| SMG | −51 | −41 | 55 | 18 |
| pOp | −48 | 25 | 22 | 9 |
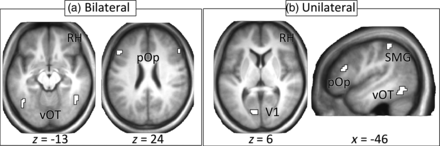
ROIs for (a) bilateral model and (b) unilateral model. RH = right hemisphere, vOT = ventral occipito-temporal cortex, pOp = pars opercularis, V1 = primary visual cortex, SMG = supramarginal gyrus.
All models contained 4 regions. The bilateral models were used to assess script differences in interhemispheric connectivity and were comprised of vOT and dorsal pOp in both the left and right hemispheres. The unilateral models were used to assess intrahemispheric script differences in connectivity and were comprised of V1, vOT, SMG, and dorsal pOp in the left hemisphere. Note that a single, unified model incorporating all bilateral and unilateral regions is currently computationally intractable. Furthermore, it is not necessary to investigate the 2 hypotheses in the same model, because the 2 accounts are independent. As a result, separate models can be used to test each hypothesis. Each subject's mean time series was extracted from these ROIs. Principal eigenvariates were extracted for each session separately within each ROI and adjusted to the F-contrast (i.e. effects of interest) of each subject. These data were entered into the 2 separate DCM analyses (see below).
DCM Parameter Estimation
DCM characterizes task-dependent neuronal interactions between regions. It has previously been used extensively to investigate the functional connectivity for reading alphabetic languages (Bitan et al. 2005; Mechelli et al. 2005; Booth et al. 2007; Chow et al. 2008; Heim et al. 2009; Seghier and Price 2010; Richardson et al. 2011). For example, Mechelli et al. (2005) used DCM to characterize differences in connectivity between English words and pseudowords. It is thus ideally suited to the investigation of possible differences in network connectivity for Japanese Kanji and Hiragana. The starting point is the selection of a fixed set of regions and their possible connections. Each combination of experimentally modulated connections corresponds to a model, which can then be compared with all other models in order to identify which model best predicts the data. In our case, for the bilateral and unilateral models, we wanted to establish which pattern of connectivity best described the interactions between regions that were activated by visual recognition of Japanese words. Complete details on DCM methodology can be found elsewhere (Friston et al. 2003; Seghier et al. 2010; Stephan et al. 2010).
All DCM analyses were carried out using the most recent version of DCM10 as implemented in SPM8. Briefly, for a given model, DCM estimated 3 different sets of parameters: (1) Input, or extrinsic, parameters that quantify how brain regions respond to external stimuli; (2) endogenous parameters reflecting the latent connectivity that characterizes the context-independent coupling between and within regions (i.e. including self-connections); and (3) modulatory parameters that measure changes in effective connectivity induced by experimental conditions. In this case, we investigated the modulatory effects of script and lexicality. All connectivity parameters are expressed in Hertz (Hz) within the DCM framework. For endogenous connections, positive values indicate that as activity increases in the originating region, the rate of change in activity in the target region also increases. In contrast, negative values for endogenous connections indicate that as activity increases in the originating region, the rate of change in activity in the target region decreases. For modulatory connections, positive values indicate stronger connectivity for Kanji, while negative values indicate stronger connectivity for Hiragana. All parameters (endogenous and modulatory) of the DCM model and their posterior probabilities were then assessed with Bayesian inversion by means of expectation–maximization algorithm (Friston et al. 2003). The word “posterior” is used here in a Bayesian sense, that is, the new values (parameters or probabilities) that resulted from the use of the observed fMRI data (the likelihood) to update our prior beliefs (DCM priors). Put another way, we have our priors and then anything computed later in the DCM Bayesian framework is called a posterior (i.e. new updated values given new evidence).
The DCM Model Space
Because the exact mechanisms behind the differential responses that we observed here are unknown, it was important to specify a range of alternative models and then to search for the best model in the model space (e.g. Leff et al. 2008; Seghier and Price 2010; Seghier et al. 2011). To keep a reasonable size for the model space, we limited each model to 4 regions and placed constraints on the possible circuitry of plausible DCM models. In the bilateral models, we omitted direct, interhemispheric connections between vOT and pOp. In the unilateral models, the top level in the hierarchy, pOp, received direct input from vOT and SMG, but not from V1. The driving regions (i.e. where the inputs enter the model) were bilateral vOT in the bilateral models and left V1 in the unilateral models. In both cases, the input consisted of a single input representing all trials. Importantly, within each analysis, all competing models have the same endogenous circuitry, but differ in modulated connections as detailed below. Additionally, the timing of the onset of each trial was individually adjusted for each ROI to match the specific slice acquisition time (Kiebel et al. 2007).
In order to model the data as accurately as possible, the differences between competing models are expressed by 2 modulatory factors, keeping the endogenous connectivity and driving inputs constant. The first factor investigated the connections that were influenced by Kanji relative to Hiragana, irrespective of lexical status (i.e. Kanji words and Kanji nonwords together). The second looked for connections that were differentially modulated by words relative to nonwords. In other words, the 2 sets of modulatory connections reflect the 2 × 2 design of the experiment. Consistent with activation studies where words and pseudowords activate a common network (Mechelli et al. 2003), there were no connections where words produced significantly different modulations than nonwords, so we only report the results of the Kanji versus Hiragana modulatory factor.
For each participant, in each session, we generated the 255 different models for the bilateral analysis and 1023 different models for the unilateral analysis that represented all possible ways of modulating the connections between the 4 regions (the difference in the number of models reflecting the greater number of connections in the unilateral model). These models varied from a DCM with only one modulated connection to a DCM with all connections modulated. Comprehensive model spaces such as these are advantageous during model comparison, because the evidence of any given model is relative to those models included in the comparison. Therefore, testing across a large number of models increases the reliability of the results obtained through model comparison procedures. However, when the model space contains large numbers of models, it is uncommon for one model to dominate all other models reducing the usefulness of Bayesian model selection (BMS; Penny et al. 2010). Instead, after estimating all models and their evidence, we used Bayesian model averaging (BMA) to make inferences on connectivity parameters. BMA can assess the full posterior density on parameters, where the contribution of each model to the mean effect is weighted by its evidence (Penny et al. 2010). Therefore, models with the highest evidence make the largest contribution, whereas the contribution of models with weak evidence is minimized. Each subject's models can be averaged, and the posterior probability of each connection computed (for a similar procedure see Seghier et al. 2011). The result of the model averaging was a single DCM in which the connection strengths corresponded to the weighted means of the evidence over the whole model space family of models. Each connectivity parameter was subsequently submitted to 1-sample t-test to test whether the connectivity parameters were significant across all 34 participants. Because of the posterior correlations among parameters (both modulatory and endogenous), Bonferonni correction is inappropriate. This is akin to standard GLM practice where no corrections for multiple comparisons are made for the number of contrasts (e.g. parameter tests). Although the 2 groups were scanned at differing field strength, this is not problematic for DCM. Indeed, the forward model in DCM can handle data acquired at different magnetic fields (Stephan et al. 2007). Both model specification and estimation are within subject, in other words, each DCM is based on the data from a single scanner. Although DCM depends on signal-to-noise (SNR) ratios (see simulations regarding BMS at different SNR by Penny 2012), this is not an issue in the context of the current study, because the BMS/BMA operate across models estimated on the same data (SNR = constant). More specifically, the model space is estimated in a subject-specific manner, and the use of random-effects BMS/BMA identifies consistent effects across all subjects irrespective of scanner. Finally, the significant connectivity parameters we report were consistent across both groups of participants (i.e. those scanned in Tokyo and London); in other words, the results were not driven by one or other group.
Finally, to assess how the reading networks varied as a function of Kanji ability, the Kanji proficiency test scores were correlated with modulatory connection strengths (i.e. connections strengths for Kanji relative to Hiragana) across individuals.
Results
Behavioral
The overall in-scanner accuracy for the lexical decision was 89%, indicating that participants were able to do the task satisfactorily. Participants were significantly more accurate for Hiragana (91%) relative to Kanji items (86%; F1,33 = 26.9, P < 0.001). There was also a trend for participants to be more accurate for nonwords (91%) relative to words (87%; F1,33 = 3.6, P = 0.067). There was no interaction between script and lexicality (F1,33 = 0.1, P = 0.764). Participants were faster responding to Hiragana items (847 ms) compared with Kanji items (904 ms; F1,33 = 27.3, P < 0.001) and for words (815 ms) compared with nonwords (937 ms; F1,33 = 17.3, P < 0.001). These effects were qualified by a significant interaction (F1,33 = 12.9, P = 0.001), reflecting the fact that although RTs were significantly slower for Kanji nonwords (985 ms) relative to Hiragana nonwords (889 ms; t(33) = 5.1, P < 0.001), there was no significant script difference when the stimuli were words (Kanji = 823 ms, Hiragana = 806 ms; t(33) = 1.7, P = 0.106). In addition, the post hoc Kanji proficiency test scores correlated significantly with participants' accuracy and RTs for Kanji words (accuracy: r(31) = 0.39, P = 0.023; RTs: r(31) = −0.40, P = 0.042), but not for Kanji nonwords (accuracy: r(31) = 0.18, P = 0.300; RTs: r(31) = −0.22, P = 0.213). In other words, increased Kanji proficiency was associated with faster and more accurate performance for Kanji words (but not nonwords) in the lexical decision task.
DCM Results: Bilateral Model
The aim of the bilateral model was to assess potential script differences in interhemispheric connectivity. The endogenous connectivity (i.e. across script) was significant and positive for the interhemispheric connections between left and right vOT and for the intrahemispheric connections from vOT to pOp in both hemispheres. In contrast, there were significant negative connections from pOp back to vOT in both hemispheres, from right-to-left pOp, and all self-connections (Fig. 2a and Table 4). The only remaining endogenous connection was that connecting left-to-right pOp which did not reach significance.
Endogenous connections in Hz at the group level in the bilateral model (all significant at P< 0.05)
| From (out) | ||||
|---|---|---|---|---|
| Left vOT | Right vOT | Left pOp | Right pOp | |
| To (in) | ||||
| Left vOT | −0.45 | 0.88 | −0.35 | — |
| Right vOT | 0.19 | −0.48 | — | −0.32 |
| Left pOp | 0.58 | — | −0.48 | −0.27 |
| Right pOp | — | 0.37 | ns | −0.48 |
| From (out) | ||||
|---|---|---|---|---|
| Left vOT | Right vOT | Left pOp | Right pOp | |
| To (in) | ||||
| Left vOT | −0.45 | 0.88 | −0.35 | — |
| Right vOT | 0.19 | −0.48 | — | −0.32 |
| Left pOp | 0.58 | — | −0.48 | −0.27 |
| Right pOp | — | 0.37 | ns | −0.48 |
vOT = ventral occipito-temporal cortex, pOp = pars opercularis.
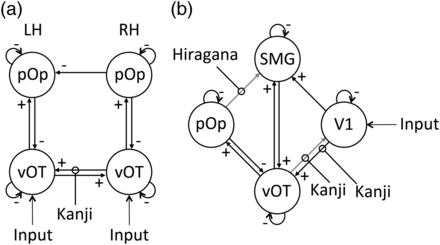
Illustration of the BMA results of the endogenous connectivity and the modulatory effects of script for the (a) bilateral model and (b) unilateral model. Significant endogenous connections are indicated by black arrows. A + or − sign indicating the relationship between regions. Significant modulatory connections are indicated by “lollipops.” A significant modulatory connection in the absence of a significant endogenous connection (denoted by a gray arrow with no + or − sign) suggests that the connection is highly specific to the modulation. LH = left hemisphere, RH = right hemisphere, vOT = ventral occipito-temporal cortex, pOp = pars opercularis.
Modulatory effects of script were found on the interhemispheric connections linking right-to-left vOT, with Kanji increasing the functional coupling relative to Hiragana (Table 5). Moreover, the strength of the right-to-left vOT connection was contingent on the proficiency of the participants, with high Kanji proficiency associated with increased right-to-left connectivity (r(31) = 0.38, P = 0.029). As can be seen in Figure 3, this relationship was similar for both Tokyo and London participants, demonstrating that the correlation was not driven by a single group (or scanner). No other connections showed significant modulatory effects or correlations with proficiency. In other words, this analysis confirmed that the 2 different scripts did indeed affect interhemispheric connectivity, with Kanji significantly increasing the connectivity from right-to-left vOT, particularly in the most proficient readers.
Modulatory connections in Hz (with standard error of the means in parenthesis) at the group level in the bilateral model
| Connection | Strength (SEM) | t-value | P-value |
|---|---|---|---|
| Right vOT → Left vOT | 0.149 (0.053) | 2.80 | 0.009 |
| Left vOT → Right vOT | 0.042 (0.022) | 1.87 | 0.070 |
| Connection | Strength (SEM) | t-value | P-value |
|---|---|---|---|
| Right vOT → Left vOT | 0.149 (0.053) | 2.80 | 0.009 |
| Left vOT → Right vOT | 0.042 (0.022) | 1.87 | 0.070 |
vOT = ventral occipito-temporal cortex; SEM = standard error of the mean.
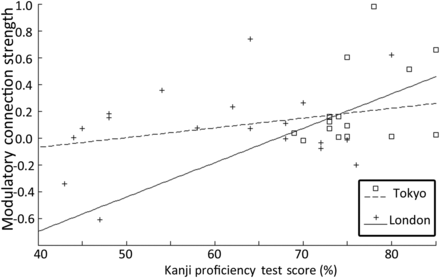
Relationship of Kanji proficiency and RH vOT to LH vOT connection: Scatterplot showing the relationship between Kanji proficiency and the modulatory connection strength. As proficiency increases the connection from right-to-left vOT becomes stronger for Kanji relative to Hiragana. This is true for participants scanned in Tokyo and London.
DCM Results: Unilateral Model
The aim of the unilateral model was to investigate whether the left hemisphere ventral and dorsal reading paths were preferentially recruited by Kanji and Hiragana, respectively. The endogenous connectivity (i.e. across script) was significant and positive from V1 → SMG and V1 → vOT, from vOT → SMG and V1 → pOp, and from SMG → vOT. Like the bilateral model, the backward connection from pOp → vOT was significant and negative, and all the self-connections were significantly negative (Fig. 2b and Table 6). There were no other significant endogenous connections (i.e. from any of the regions to V1 or from SMG to pOp or pOp to SMG).
Endogenous connections in Hz at the group level in the unilateral model (all significant at P < 0.05)
| From (out) | ||||
|---|---|---|---|---|
| V1 | vOT | SMG | pOp | |
| To (in) | ||||
| V1 | −0.45 | ns | ns | — |
| vOT | 0.81 | −0.47 | 0.09 | −0.18 |
| SMG | 0.29 | 0.11 | −0.47 | ns |
| pOp | — | 0.20 | ns | −0.49 |
| From (out) | ||||
|---|---|---|---|---|
| V1 | vOT | SMG | pOp | |
| To (in) | ||||
| V1 | −0.45 | ns | ns | — |
| vOT | 0.81 | −0.47 | 0.09 | −0.18 |
| SMG | 0.29 | 0.11 | −0.47 | ns |
| pOp | — | 0.20 | ns | −0.49 |
V1 = primary visual cortex, vOT = ventral occipito-temporal cortex, SMG = supramarginal gyrus, pOp = pars opercularis, – = connection not present in the model, ns = connection not significant.
Modulatory effects of script were found within the ventral path, with Kanji increasing the bidirectional functional coupling between V1 and vOT and Hiragana increasing the functional coupling within the dorsal path on the connection from pOp to SMG (Table 7). Proficiency in Kanji did not correlate with the strength of the modulatory connections.
Modulatory connections in Hz (with standard error of the means in parenthesis) at the group level in the unilateral model
| Connection | Strength (SEM) | t-value | P-value |
|---|---|---|---|
| V1 → vOT | 0.08 (0.034) | 2.43 | 0.021 |
| vOT → V1 | 0.01 (0.004) | 2.33 | 0.028 |
| pOp → SMG | −0.01 (0.004) | 2.08 | 0.046 |
| SMG → vOT | 0.02 (0.010) | 1.96 | 0.06 |
| pOp → vOT | 0.03 (0.020) | 1.70 | 0.09 |
| Connection | Strength (SEM) | t-value | P-value |
|---|---|---|---|
| V1 → vOT | 0.08 (0.034) | 2.43 | 0.021 |
| vOT → V1 | 0.01 (0.004) | 2.33 | 0.028 |
| pOp → SMG | −0.01 (0.004) | 2.08 | 0.046 |
| SMG → vOT | 0.02 (0.010) | 1.96 | 0.06 |
| pOp → vOT | 0.03 (0.020) | 1.70 | 0.09 |
Note that with the exception all connections are positive (i.e. stronger for Kanji) with the exception of the pOp → SMG connection that is negative (i.e. stronger for Hiragana).
vOT = ventral occipito-temporal cortex; SEM = standard error of the mean.
In order to compare the effect of script in the ventral and dorsal paths, we calculated the mean modulatory effect over the 4 dorsal connections (V1 to SMG, SMG to pOp, pOp to SMG, and SMG to V1) and again over the 4 ventral connections (V1 to vOT, vOT to pOp, pOp to vOT, and vOT to V1). In the ventral pathway, the mean modulatory effect on connectivity was positive (0.03), indicating that it was stronger for Kanji than Hiragana. In the dorsal pathway, it was negative (−0.01), indicating that it was stronger for Hiragana. A within-subject (paired) t-test confirmed that these mean modulatory effects were significantly different (t(33) = 3.9, P = 0.001).
Discussion
The current study investigated 2 competing, but not exclusive, theories regarding the neural processing of Japanese Kanji and Hiragana. At a functional level, characters in Kanji words are generally visually complex and can provide useful information regarding the meaning of the whole word, though in many cases their pronunciation cannot be determined without prior experience of the particular character and can differ depending on the context in which the character appears. In contrast, characters in Hiragana words do not have any inherent meaning, but their pronunciation is almost completely regular. At the neural level, the phonological processing involved in reading Hiragana is expected to increase left-lateralized brain activation (the interhemispheric hypothesis) particularly in a dorsal left hemisphere pathway thought to link visual form-to-sounds (the intrahemispheric hypothesis). Kanji, on the other hand, are expected to increase activation in right hemisphere areas (the interhemispheric hypothesis) or within a ventral visual form-to-meaning pathway that includes left vOT (the intrahemispheric hypothesis). Consistent with these hypotheses, we found that Kanji increased interhemispheric connectivity relative to Hiragana and that overall connectivity was stronger for Kanji ventrally, but stronger for Hiragana dorsally. These increases in connectivity for the 2 scripts occurred in the context of a network of regions that was commonly activated by lexical decisions on words and nonwords, irrespective of whether the script was Kanji or Hiragana.
Our DCM analyses allow us to propose a mechanistic account of how Kanji and Hiragana differ at the level of neural pathways. For example, previous accounts do not specify whether the increased interhemispheric interactions for Kanji result from information being passed from right hemisphere areas that may support the visual or semantic processing of Kanji to left hemisphere language areas (i.e. right to left) or from language processing in the left-to-right hemisphere areas that might support visual or semantic processing of Kanji (i.e. left-to-right). We found that Kanji resulted in a significant increase in connection strength from the right-to-left vOT, suggesting that activity in right vOT (Law et al. 1991; Ha Duy Thuy et al. 2004; Nakamura et al. 2005; Koyama et al. 2011; Twomey et al. 2012) needs to be integrated into the left, language-dominant, hemisphere. Additional studies may help ascertain whether the increase in connection strength for Kanji reflects the need to transfer visual information, higher-order information (such as meaning), or a combination. This increase in right-to-left connectivity was contingent on participants' proficiency with Kanji, indicating that increased proficiency improves the “efficiency” of the transfer into the hemisphere dominant for language. This may explain, for instance, why Maurer et al. (2008) found a bilateral N170 effect when viewing Kanji in non-Japanese readers, but a left-lateralized effect in Japanese natives. If proficiency with Kanji increases the efficiency of transfer from the right-to-left vOT, then non-natives will be working both hemispheres harder (and to less effect) when attempting to read a script they are less familiar with. More generally, the increase in functional connectivity associated with greater Kanji reading skill may indicate greater neural adaptability in the better readers (Prat and Just 2011).
A second novel finding was that, relative to Hiragana, Kanji increased connectivity from V1 to vOT and from vOT back to V1 (in the unilateral model), consistent with predictions based on neuropsychological data (Sakurai 2004). Previous studies have reported greater vOT activation for Kanji relative to Kana (Sakurai et al. 2000; Ha Duy Thuy et al. 2004; Nakamura et al. 2005), even when the scripts were carefully matched (Ino et al. 2009; Twomey et al. 2012). Greater activation, however, does not necessarily entail greater functional connectivity between regions. Instead, the increase in bottom-up inputs to vOT from V1 likely reflects the fact that generally Kanji are composed of more lines and intersections compared with Hiragana (i.e. they are visually more complex), and this information needs to be conveyed to higher-order visual areas such as vOT. The reciprocal connection from vOT to V1 suggests that Kanji involved more top-down predictions from higher-level perceptual processing in vOT to lower-level visual processing in V1.
For Hiragana relative to Kanji, we found increased top-down connectivity from pOp to SMG in the dorsal path. In comparison, there was no significant script difference in bottom-up connectivity through the dorsal stream (i.e. V1 to SMG or SMG to pOp) or between vOT and pOp. As Hiragana involves multiple sublexical phonological clues that need to be integrated into a whole word, the top-down modulation from Broca's area to SMG may serve to guide processes involved in phonological assembly and/or phonological working memory, 2 processes that are useful for reading Hiragana, but not for Kanji. It is also striking to note that this connection was positive for Hiragana, indicating that an increase in pOp activity enhanced the response in SMG. This suggests that Broca's area was contributing to the SMG response rather than predicting it. In contrast, the functional connection from Broca's area to vOT was negative for both Hiragana and Kanji. This indicates that an increase in pOp activity decreased the response in vOT as would be expected if pOp activity was successfully predicting the visual inputs arriving in vOT (Price and Devlin 2011).
That connectivity for Kanji and Hiragana is largely overlapping is consistent with the neuropsychology literature: Although there are numerous reports of preferential impairments of Kanji and of Hiragana, these occur in the context of a general decrease in performance (particularly RTs) affecting both scripts (Sugishita et al. 1992; Sakurai 2004; Kuriyama et al. 2006; Sakurai et al. 2006, 2008). When preferential impairments for Kanji do occur, they generally result from damage that involves vOT or areas just posterior to vOT (Sakurai 2004; Sakurai et al. 2006). This is consistent with the current study, both with the finding that Kanji up-regulates connectivity overall through the ventral path, and more specifically with the increase in reciprocal connectivity between V1 and vOT. In contrast, patients with preferential impairments for Hiragana tend to have damage to more dorsal areas, between early visual areas and inferior parietal areas, such as SMG (Sakurai et al. 2010). Although this is broadly consistent with our observation of greater overall connectivity through the dorsal path for Hiragana, it is important to consider the nature of the stimuli used in different studies examining Japanese reading. A common practice is to compare Kanji words to their Hiragana transliterations (i.e. the same word rewritten in Hiragana). This has the unfortunate consequence of rendering the Hiragana words less visually familiar, minimizing the importance of lexical (i.e. whole word) processing and exaggerating the role of sublexical orthography-to-phonology conversion. Indeed, while fMRI studies that use transliterations show preferential Hiragana activation in SMG (Ha Duy Thuy et al. 2004; Nakamura et al. 2005), the effect is minimized when the scripts are matched on visual familiarity (Ino et al. 2009; Twomey et al. 2012). Similarly, in the current study, where we controlled for visual familiarity, we did not observe any significant modulations for Hiragana between V1 and SMG.
The current study adds to a growing body of evidence that reading can be supported by multiple paths that do not all necessarily involve vOT activation (Richardson et al. 2011; Seghier et al. 2012), and that both routes are required for normal skilled reading, in the sense that damage to either will impair reading performance. However, these are not the anatomical correlates of the dual routes that have been described in cognitive models of reading: One is not “lexical”, nor is the other a set of rules for converting sublexical orthography into phonology. Instead, the dorsal path connects structures preferentially involved in the sounds of words, whereas the ventral path connects brain areas involved in object recognition and meaning. Crucially, both paths are involved in reading even when the stimuli are as different as Kanji and Hiragana. Nevertheless, we have shown that the strength of the connections in the dorsal and ventral paths differs for Kanji and Hiragana, and that interhemispheric connectivity also changes with the script. Our findings therefore integrate 2 different hypotheses that are not mutually exclusive. Specifically, we are proposing that Kanji increase connectivity in-and-out of left vOT (V1 to left vOT, left VOT to V1, and right vOT to left vOT), whereas Hiragana increase connectivity from pOp to SMG in the dorsal path.
Funding
This work was supported by the Wellcome Trust (to K.J.K.D., ‘Ō.P.J., M.L.S., and C.J.P.); the Japanese Society for the Promotion of Science (to K.J.K.D. and K.S.); the Biotechnology and Biological Sciences Research Council (to T.T.); the Tamagawa University global Center of Excellence program of the Japanese Ministry of Education, Culture, Sports and Technology (T.H.), and the Takeda Science Foundation (K.S.). Funding to pay the Open Access publication charges for this article was provided by The Wellcome Trust.
Notes
The authors acknowledge the use of the UCL Legion High Performance Computing Facility and associated support services, in the completion of this work. Conflict of Interest: None declared.