


Abstract
Crohn’s disease (CD) is a chronic relapsing inflammatory disorder in which defective apoptosis of mucosal T cells is postulated to produce sustained inflammation and reactive oxygen species accumulation. Whether CD T cells are intrinsically resistant to apoptosis or whether this resistance is acquired at the intestinal site needs to be clarified, as the cellular mechanisms modulate the impaired apoptosis in these cells. Here, we analysed peripheral blood T cells from patients naïve to specific CD treatment at the onset and from healthy controls. Non-activated freshly purified lymphocytes were cultured and submitted to in vitro protocols for activation (CD3/CD28 antibodies) and apoptosis (Fas antibody). Cells were analysed by flow cytometry. Caspases (3, 8, and 9) and catalase activity were measured; protein levels of bax, Bcl-2, and NF-kB were detected by western blotting, and cytokines by Luminex-based assays. The results showed that CD4 T cells from CD patients are less prone to apoptosis before they can migrate to the intestinal mucosa. Caspase-9, FasR, sIL-2Rα, IL-17A, IFNγ, IL-6, TNF-α, and IL-10 were shown to be significantly different in CD but not for the rest of the analysed biological elements. Catalase activity was significantly reduced in CD T cells, which was confirmed in ex vivo experiments in which catalase inhibition in T cells from healthy controls triggered apoptosis inhibition in a dose-dependent manner. In conclusion, apoptosis inhibition of CD T cells is a feature of these cells before they can migrate to the intestinal mucosa. Noteworthy, the impaired apoptosis of T cells can be directly influenced by catalase inhibition.
Introduction
Crohn’s disease (CD) is a chronic, relapsing inflammation affecting the gastrointestinal tract, most commonly the terminal ileum. Despite numerous important findings, it is not fully understood why the mucosal immune response is over-reactive in patients with CD [1, 2]. Experimental data have suggested that mucosal inflammation results from abnormal T-cell-mediated immune reactivity towards intestinal bacteria due to a lack of cells that control programmed cell death (apoptosis) [1–4]. This has been demonstrated by a marked decrease in the proapoptotic B-cell lymphoma 2 (Bcl-2)-associated X-protein (Bax) and an increase in the antiapoptotic bcl-2 in the intestinal T cells of patients with CD [4–6]. Several studies have demonstrated that T cells taken from patients with CD can proliferate more and cycle faster (upon CD2/3 stimulation) than those from normal healthy controls [7, 8]. Considering that apoptosis of activated T cells is a key mechanism of immune tolerance, the apoptotic defect of mucosal T cells migrated from peripheral blood might explain why the inflammatory reaction in CD is resistant to resolution [2, 9]. Furthermore, therapeutic benefits from inhibiting T-cell proliferation and survival by inducing apoptosis have been reported [10, 11].
Fas is a member of the death receptor superfamily and is essential for activation-induced cell death [12, 13]. Any dysfunction in the Fas system will lead to a breakdown of tolerance and development of autoimmune phenomena. Elements such as nuclear factor kappa B (NF-kB) promote T-cell survival by upregulating Fas inhibitor Flip or by increasing bcl-2 [14]. However, depletion of the apoptosis inhibitor by Smac mimetics (elements derived from mitochondria) activates non-canonical NF-kB signalling, leading to Fas/tumour necrosis factor (TNF) signalling, formation of death-inducing signalling complex with First-in-Class Receptor Interacting Protein 1 (RIP1), Fas-associated protein with death domain (FADD), and caspase-8, and ultimately cell death [15, 16]. The nucleotide-binding and oligomerization domain (NOD)-family receptors can be regulated by elements of the apoptotic pathways. NOD2 variants and mutations, which explain ~20% of genetic susceptibility in CD, are also associated with impaired Fas/TNF signalling [9, 14, 17].
Oxidative stress has emerged as a potential aetiological factor and/or triggering factor in CD rather than a concomitant occurrence during the pathogenesis of the disease [18]. Defective apoptosis of mucosal T cells in CD has been described at the level of the mitochondrial pathway [2], and the role of mitochondria as the source of reactive oxygen species (ROS) has been demonstrated [18, 19]. Moreover, defective Fas-mediated apoptosis in lymphocytes from CD intestinal mucosa is associated with changes in the mitochondrial apoptotic pathways [11]. During T-cell activation, T-cell receptor triggering induces ROS generation of hydrogen peroxide (H2O2) and superoxide anion (O2•−), through its H2O2 properties favour it over other ROS as a possible second messenger [20, 21]. In fact, H2O2 is under sophisticated fine control by antioxidant enzymes such as catalase, peroxiredoxins, and glutathione peroxidases, with their backup systems [22]. H2O2 has been linked to Fas signalling because it induces a dose-dependent Fas increase on the cell surface. However, this process appears to be modulated by the catalase enzyme [23, 24]. Catalase is a primary intracellular enzyme, highly present in erythrocytes and the liver (such as in peroxisomes). Catalase is a 244-kDa tetrameric protein, formed by four identical subunits of 59.7 kDa each [25]. Impaired catalase activity has been linked to several diseases. In this sense, endogenous ROS levels can be rate-limiting in the receptor-mediated apoptotic cell death process, influencing CD pathogenesis [22].
Whether T cells from patients with CD are intrinsically resistant to undergoing apoptosis or whether it is a feature that these cells develop after migrating to the inflamed mucosal site and encountering apoptosis inhibitors is unknown [11, 24, 26]. An exhaustive characterization of these cells’ prior migration to the intestinal mucosa needs to be performed. Thus, we report for the first time (to our knowledge) that CD4 T cells from the peripheral blood of patients with CD are intrinsically less prone to undergoing apoptosis. Furthermore, we demonstrate that catalase can be a key element in that process, exerting its action of regulating apoptosis in CD.
Materials and methods
Patients and controls
This study prospectively and consecutively recruited 20 patients with CD at the onset of the disease (diagnosed according to the endoscopic, radiological, histological, and clinical criteria established by the European Crohn’s and Colitis Organisation) [27], prior to beginning any specific medication for the disease. The patients were classified according to the Montreal Criteria, and disease activity was scored based on the Harvey–Bradshaw index, as previously described [28]. Table 1 shows the patients’ demographic and clinical data regarding age, sex, smoking habits, clinical signs and symptoms, biochemical and haematological tests, and localization. Patients with unclear diagnoses and those with additional diseases at the time of sampling were excluded, although three patients with intestinal diseases other than CD (tumour or non-Crohn ileitis) and one patient with CD during a flare-up (under specific CD treatment) were also recruited as comparative groups. Their clinical and demographic features were similar to those of the main groups.
Demographic and disease characteristics of controls and patients with CD
| Control (n = 18) | Onset CD (n = 20) | |
|---|---|---|
| Age (years) | ||
| Mean (SD) | 30.7 (6.4) | 30.0 (15.5) |
| Median (1st-3rd Q) | 29.5 (26.8-32.2) | 26.0 (20.0-34.0) |
| Sex (M/F) | 3/15 | 8/12 |
| Harvey Index | – | 7.7 ± 3 |
| CRP [0-8 mg/L] | ||
| Mean (SD) | 1.4 (1.9) | 52.5 (47.9) |
| Median (1st-3rd Q) | 1 (0.7-1.4) | 47.0 (9.5-90.1) |
| Fibrinogen [170-437 mg/dL] | ||
| Mean (SD) | 318.4 (92.0) | 485.3 (79.2) |
| Median (1st-3rd Q) | 304.0 (247.8-338.0) | 485.0 (428.5-527.5) |
| Leukocytes [4.5-10.8 × 10³/µL] | ||
| Mean (SD) | 5.8 (1.3) | 9.7 (5.9) |
| Median (1st-3rd Q) | 5.6 (4.8-6.4) | 8.6 (4.8-13.7) |
| Lymphocytes [2.0-11.0 × 10³/µL] | ||
| Mean (SD) | 2.0 (0.4) | 1.8 (0.8) |
| Median (1st-3rd Q) | 2.0 (1.7-2.3) | 1.8 (1.1-2.3) |
| S/nS/eS | 4/14/0 | 7/12/1 |
| Clinical classification of CD (montreal classification) | ||
| A (age at diagnosis, years) | ||
| A1 (≤16) | 2 | |
| A2 (17–40) | 14 | |
| A3 (>40) | 4 | |
| L (location) | ||
| L1 (ileal) | 11 | |
| L2 (colonic) | 2 | |
| L3 (ileocolonic) | 7 | |
| L4 (upper GI disease) | 0 | |
| B (behaviour) | ||
| B1 (inflammatory) | 15 | |
| B2 (structuring) | 5 | |
| B3 (penetrating) | 0 | |
| P (perianal) | ||
| Yes | 5 | |
| No | 15 | |
Abbreviations: CRP, C-reactive protein; GI, gastrointestinal; S/nS/eS, smokers, non-smokers, ex-smokers.
The control group included 18 healthy volunteers who were not taking any medication and who had completely normal blood test results.
Reagents and antibodies
The conjugated antibodies CD4-R.Phycoerythrin-Cyanine 5.1 (PC5, clone 13B8.2), CD95-phycoerythrin (PE, clone 7C11), and the Annexin-V fluorescein isothiocyanate kit were from Immunotech (Beckman Coulter, France); the Histopaque 1007, Lowry reagent, and chemicals for western blot were from Sigma-Aldrich (St. Louis, MO); the X-VIVO 15, phosphate-buffered saline (PBS), and Roswell Park Memorial Institute (RPMI)-1640 medium were from BioWhittaker (Lonza, Belgium). Antibodies for cell stimulation were mouse anti-human CD3 (clone UCHT1) and CD28 (clone 204-12), both from SouthernBiotech (USA). For lymphocyte isolation, the Dynal T Cell Negative isolation kit from Invitrogen (cat. No. 113.11D, Norway) was employed. For Fas (CD95) treatment, anti-Fas (clone CH11, Upstate, Millipore, USA) was used. Human albumin was obtained from Grifols (Spain). Caspases were analysed with the Apopcyto Caspase Colorimetric Assay Kit (MBL, Japan) and the protein was determined with a bicinchoninic acid (BCA) protein assay (Pierce BCA Protein Assay Kit, Thermo Fisher, USA). For western blot, antibodies (Bax cat. nº 2774, bcl-2 cat. nº 2870, NF-kB p65 cat. nº 3034, p50, and p105 cat. nº 3035) from Cell Signaling (USA), alpha tubulin (TU-02), mouse monoclonal antibodies from Santa Cruz Biotechnology (USA), and conjugated anti-mouse IgG (goat) peroxidase (catalogue no. 401215) from Calbiochem (Germany) were employed. Nitrocellulose membrane was acquired from Hybond (Amersham Biosciences, UK) and enhanced chemiluminescence from GE Healthcare. Catalase activity was measured with a Bioxytech Catalase-520 kit (Cat. No. 21042; OxisResearch, USA). The 3-amino-1,2,4-triazole (AMT) and other chemicals were purchased from Sigma.
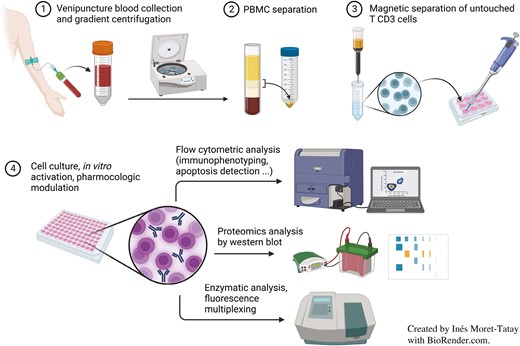
Lymphocyte isolation
Following overnight fasting, blood samples were collected in heparinized tubes (17 IU/ml). Blood was first diluted (1:1) with PBS (without calcium or magnesium) and carefully layered onto the upper Histopaque-1077 medium. Peripheral blood mononuclear cells (PBMC) were separated by Histopaque gradient centrifugation at 213g for 30 min at room temperature (RT). The interfacial cells were harvested and counted by trypan blue exclusion to calculate the total PBMC. This suspension was washed once with RPMI-1640 (without serum) at 309g for 10 min at RT. The non-activated T cells (CD3+) were then isolated with the Dynal T cell negative isolation kit, following the manufacturer’s instructions, with modifications that had been shown to improve the results. Briefly, cells were resuspended in modified buffer 1 (containing PBS without calcium or magnesium), with 0.1% human serum albumin, autologous plasma (centrifuged at 1924g for 10 min at RT) and antibody mix. This suspension was mixed and incubated for 30 min at 4 °C with continuous gentle agitation. Afterwards, the cells were washed with modified buffer 1 at 307g for 10 min at RT. Pre-washed depletion Dynabeads were added and mixed by pipetting several times. After incubation, the bead-bound cells were resuspended by gentle pipetting, and X Vivo-15 medium was added before placing the tube in the magnet for 3 min. Supernatants containing untouched lymphocytes were separated and cultured. Cytospin slides were stained from aliquots by the panoptic method (Panreac Quimica SA, Spain) to check the effectiveness of the protocol.
Fas treatment
Isolated lymphocytes were seeded at 105 cells/well in 96-well plates and activated for 5 days with plate-coated anti-CD3 antibody (5 μg/mL), and anti-CD28 (1 μg/mL) was diluted in X-Vivo 15 medium. The cells were then incubated with 1 μg/ml anti-Fas mAb and analysed by flow cytometry. Aliquots of the pelleted cells and supernatants were kept at −80°C for further analysis. Non-activated cells and activated but non-Fas-treated cells were similarly analysed.
AMT treatment
Catalase inhibition in purified lymphocytes from healthy controls was developed by adding AMT at 0, 1, 5, and 10 mM to the cell culture medium.
Flow cytometry
Apoptosis
Fas-induced cell death was evaluated by an annexin detection kit. The cells were stained with anti-CD4-PC5 Ab plus annexin. Immunofluorescence was measured on an EPICS-XLMCL flow cytometer (Beckman-Coulter), and data were acquired employing System II software (Beckman-Coulter). Additional experiments were performed with propidium iodide to exclude necrosis. Anti-CD95-PE antibody was simultaneously added to different cell suspensions from the same sample to detect cell activation. Lymphocytes were gated according to their forward and side scatter characteristics, with a minimum of 10 000 gated events from each sample. Results are expressed as a percentage of each subpopulation from the total lymphocyte CD4+ population.
Mitochondrial membrane potential and H2O2 levels
Mitochondrial membrane potential (ΔΨm) was assessed using cationic-lipophilic tetramethylrhodamine methyl ester following previously published protocols [18, 19]. The detection of H2O2 levels was based on 5-(6)-carboxy-2ʹ, 7ʹ-dichlorodihydrofluorescein diacetate oxidation and the addition of tert-butyl-hydroperoxide (TBH) to induce an H2O2 peak [18, 19].
Caspase activity assays
Caspase-3, -8, and -9 catalytic activities were measured using a caspase colorimetric kit according to the manufacturer’s instructions (MBL). Cell lysates were employed from activated (and Fas-treated) primary T cells, and caspase activity was calculated from the slope of each calibration recorder trace. Measurements of caspase activity were first performed at different time-points to select the best time-point for analysis; 4 h was ultimately selected. Results are expressed in pmol/min/mg of protein content measured with a BCA protein assay.
Western blotting
Cells were lysed in buffer A (55.6 g/L NaH2PO4), buffer B (53.6 g/L NaHPO4 ·7H2O and 35.6 g/L NaHPO4·2H2O), 25 ml Triton X-100, 0.5 g sodium dodecyl sulphate (SDS), 0.5% NaN3, 12.5 ml NaCl 4 M, 10 mg/ml sodium deoxycholate, 1 mM phenylmethylsulfonyl fluoride (Sigma), and protease inhibitor mixture for 15 min on ice and centrifuged (10 min, 13 000g). Proteins were determined by the Lowry method, and 25 µg were resuspended in sample buffer (0.125 M Tris–HCl, pH 6.8, 2% SDS, 0.5%, v/v, 2-mercaptoethanol, 1% bromophenol blue, and 19% glycerol) and boiled for 5 min. Proteins were separated on 10% SDS-PAGE and blotted onto a nitrocellulose membrane. Blots were blocked for 1 h at RT in Tris-buffered saline and 0.05% Tween, containing 5% non-fat dried milk, then washed and incubated with the antibodies. Detection was achieved with the appropriate secondary antibodies coupled to horseradish peroxidase, followed by an enhanced chemiluminescence western blotting kit and visualized by autoradiography. For image analysis, X-ray films were scanned with a flatbed scanner and quantified using the LabView program.
Cytokine levels
For the lymphocyte culture’s supernatants, interleukin-2 (IL-2), IL-6, IL-10, IL-17, interferon-γ (IFNγ), and tumour necrosis factor α (TNF-α) levels were analysed by enzyme-linked immunosorbent assay (ELISA) with commercial enzyme immunoassay kits (BDOptEIA, Cat no. 555190, 555220, 555157, 555142, and 555212 from BD Biosciences, USA; and DuoSet ELISA DY317 from R&D Systems), following the manufacturer’s instructions. The optimal sample dilutions were first tested. Results (pg/ml) were normalized to cell counts.
Plasma cytokine levels (sIL-2Rα, IL-17A, IFNγ, IL-10, IL-12p70, IL-13, L-1β, IL-2, IL-6, and TNFα) and biomarkers (TRAIL, sFas, and sFasL) were analysed with commercially available kits (cat. no. MPXHCYTO-60K, HSCYTO-60SK, and HCCBP1MAG-58K; Merck), following the manufacturer’s instructions. The optimal sample dilutions were first tested and analysed in a Luminex 100/200 System (xMAP Instruments) and fluorescence was interpolated in a standard curve with Xponent software (Luminex).
Human integrin alpha E (ITGαE) and chemokine receptor type 9 (CCR9) were analysed in cellular lysates and cell culture supernatants using commercially available kits (MBS9910146 and MBS1605937, from MyBioSource), following the manufacturer’s instructions.
Catalase activity
Catalase activity was measured with a commercial catalase kit according to the manufacturer’s instructions (OxisResearch). Total protein concentrations were also determined to normalize the results.
Statistical analysis
The statistical comparisons were performed with a non-parametric Mann–Whitney U test or a paired t-test. A one-way analysis of variance (Friedman test) was used to evaluate the apoptosis in purified lymphocytes, and multiple comparisons of the false discovery rate (FDR) were performed using the two-stage linear step-up procedure of Benjamini, Krieger and Yekutieli (with Q = 5%) and the Holm–Sidak method (with α = 0.05). Unless otherwise stated, values expressed in the tables and figures are given as mean ± SD. A P-value of <0.05 was considered statistically significant. Graphs and the statistical analysis were performed using GraphPad Prism version 5.0 for Windows (GraphPad software, San Diego, CA, www.graphpad.com).
Results
Apoptotic resistance in blood lymphocytes from patients with CD
For this study, we consecutively recruited 20 patients at the onset of CD and 18 healthy volunteers with similar demographic characteristics; their clinical features are shown in Table 1.
Microscopy images from purified lymphocytes, before culturing and after activation plus Fas treatment, are shown in Supplementary Fig. S1. Following the purification protocol, which led to a homogeneous lymphocyte population, we performed flow cytometry to assess purity (results not shown), revealing that ~95% of the isolated cells were T cells, with low basal apoptosis and activation status (Supplementary Fig. S2). First activation and subsequent Fas treatment resulted in significant changes in the lymphocytes’ morphologic characteristics (Supplementary Figs. S1 and S2). We observed constantly higher lymphocyte proliferation in the CD group than in the controls after 6 days of culture (with respect to the baseline count), although statistical significance was not reached (3.3 [1.1] vs 2.5 [1.0], P = 0.07, mean [SD] cell count at day 6/at day 0).
The activation itself (by CD3/CD28) produced a significant apoptotic increase (P < 0.001) in the control and CD samples (Fig. 1). The mean values (% and SD) for CD lymphocytes were as follows: 12.4 (9.5) vs 40.2 (16.3) (non-activated vs activated); for control lymphocytes: 12.1 (6.7) vs 52.6 (16.2). In the control lymphocytes, the increase in apoptosis after activation was consistently higher than in the CD samples (P < 0.05; Fig. 1). When Fas ab was added to activated lymphocytes, apoptosis increased significantly: 55.4 (17.1) in the CD and 73.4 (11.4) in the control samples. Again, apoptosis was higher in the controls than in CD (P < 0.005).
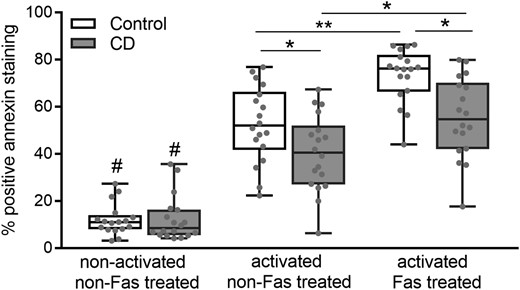
Apoptosis values detected by flow cytometry of annexin-stained cells. Cultured purified lymphocytes were left untreated (non-activated and non-Fas-treated cells), activated with CD3/CD28 antibodies and activated plus Fas treated. Data from 18 controls and 20 patients with CD. Results are represented in a box and whiskers plot with the median and individual data points. #P < 0.001 (with respect to the activated cells), *P < 0.05, **P < 0.05.
After 6 days of culture, the non-activated non-Fas-treated cells remained alive with non-apoptotic increases with respect to baseline apoptosis (day 0). Fas treatment in the non-activated cells did not induce any apoptotic changes in either group. Apoptosis in T cells from diseases other than CD (tumour or non-Crohn ileitis, n = 3) showed values similar to those of healthy controls (after activation: 51.9 [12.7] vs 52.6 [16.2]; after Fas treatment: 72.3 [9.3] vs 73.4 [11.4]; mean [SD] of % apoptosis). Apoptosis was also analysed in 1 patient with active CD (under infliximab and corticoid treatment), and the values were similar to those for the onset of CD (49.65 vs 40.2 [16.3] for activated T cells; 53.8 vs 55.4 [17.1] after Fas treatment).
Higher Fas receptor expression and cytokines in CD
CD95 (FasR) expression in purified lymphocytes upon activation was significantly increased in CD (P < 0.05) vs controls, as detected by flow cytometry (Fig. 2A) and previously observed by genetic analysis [29]. In addition, the intestinal homing ability of purified activated T cells was tested by assessing the levels of the specific adhesion and chemokine receptors ITGαE) nd CCR9, which were higher in CD lymphocytes compared with controls (Supplementary Fig. S3).
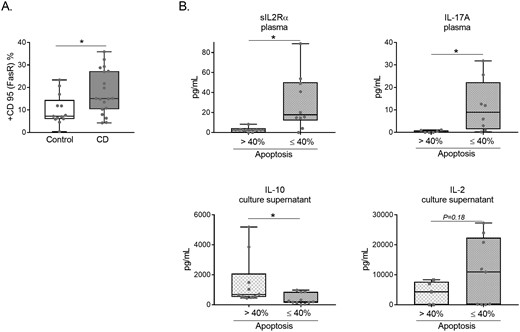
(A) Flow cytometry percentage of CD95 (FasR) expression in purified lymphocytes from CD and control samples after 5 days of activation. Data from 18 controls and 20 patients with CD. Results are represented in a box and whiskers plot with the median and individual data points. *P < 0.05. (B) sIL-2Rα and IL17A plasma levels, plus IL-10 and IL-2 culture supernatant (normalized to cell count) levels according to the corresponding apoptosis percentage (≤40 n: 12, or > 40 n: 8) of CD samples. *P < 0.05.
Cytokines were analysed in plasma and culture supernatants from the same CD and healthy control samples. As shown in Table 2, most of the plasma cytokines presented higher concentrations in CD, as expected (P < 0.001 for sIL-2Rα; P < 0.05 for IL-17A; P < 0.05 for IFNγ; P < 0.001 for IL-6; P < 0.01 for TNFα; with a trend for IL-10 and IL-2). None of the cytokines analysed in the cultured supernatants from the activated Fas-treated lymphocytes showed differences between CD and healthy controls (Supplementary Table and Supplementary Fig. S4). When the samples were classified according to the apoptosis cutoff value of ≤40% or >40% (based on the experimental results as the most likely to differentiate between subgroups) 2 plasma cytokines (sIL2Rα and IL17A) were shown to be different between these groups (Fig. 2B). Of the cultured supernatants of purified and Fas-treated lymphocytes, only IL-10 was shown to be different between the experimental groups. A tendency for IL-2 was also observed (Fig. 2B) in the cultured supernatants. Interestingly, two well-defined subgroups of plasma IL-2 levels in CD samples were identified (Supplementary Fig. S5A), which could be related to a novel subclassification of patients with CD as reported for other molecular signatures [30].
Cytokine levels in plasma
| sIL-2Rα | IL-17A | IFNγ | IL-10 | IL-12p70 | IL-13 | IL-1β | IL-2 | IL-6 | TNFα | |
|---|---|---|---|---|---|---|---|---|---|---|
| Onset CD | ||||||||||
| Mean (SD) | 33.1 (28.4) | 7.7 (9.9) | 31.2 (58.9) | 12.7 (8.9) | 14.7 (29.4) | 3.0 (3.9) | 3.6 (2.3) | 4.5 (2.0) | 22.7 (24.5) | 9.9 (4.3) |
| Median (1st-3rd Q) | 21.5 (10.7-47.2) | 3.6 (0.9-12.5) | 7.8 (3.5-14.8) | 11.8 (6.0-15.0) | 4.4 (2.0-8.7) | 1.6 (0.7-3.4) | 3.7 (1.0-5.6) | 5.0 (2.9-5.9) | 12.7 (6.5-38.1) | 10.5 (5.2-14.1) |
| Healthy control | ||||||||||
| Mean (SD) | 10.6 (9.8) | 2.2 (3.1) | 6.3 (6.5) | 11.0 (12.6) | 5.2 (4.8) | 3.2 (3.0) | 4.6 (4.3) | 3.8 (3.4) | 2.7 (2.4) | 5.9 (4.1) |
| Median (1st-3rd Q) | 9.1 (0.8-17.3) | 0.9 (0.5-2.2) | 3.6 (1.6-10.4) | 7.2 (3.0-12.3) | 4.4 (1.6-7.4) | 2.4 (1.2-3.6) | 3.4 (1.9-5.5) | 2.3 (1.2-5.6) | 1.7 (1.1-3.4) | 4.6 (3.9-5.9) |
| P value | <0.001 | <0.05 | <0.05 | 0.09 | 0.56 | 0.34 | 0.79 | 0.11 | <0.001 | <0.01 |
Abbreviations: CD, Crohn’s disease; IL, interleukin; IFN, interferon; Q, quartile; SD, standard deviation; TNF, tumour necrosis factor.
Similar Bax/bcl-2 ratio and NF-kB levels
To identify the potential molecular mechanisms involved in the apoptosis resistance observed in CD lymphocytes, we performed immunoblot analysis of Bax, bcl-2, and NF-kB proteins (Fig. 3A). As depicted in Fig. 3B, a similar Bax/bcl-2 ratio between the patients with CD and the controls was obtained and for NF-kB subunits (p65; data not shown for p50, and p105). Again, no differences between CD and control lymphocytes were observed. These results were confirmed by chemiluminescence ELISA (data not shown).
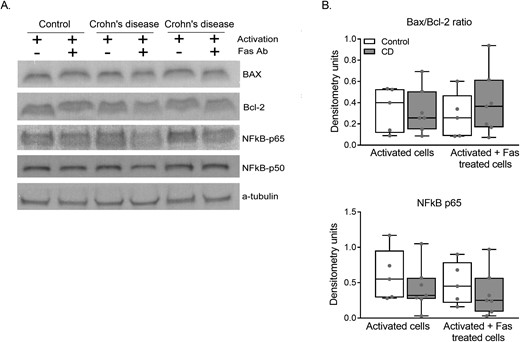
(A) Immunoblotting for Bax, bcl-2, and NF-kB extracts of activated and activated plus Fas-treated purified lymphocytes. (B) Densitometry results of immunoblot images normalized with a-tubulin. Data from five controls and seven patients with CD. Results are expressed in a box and whiskers plot with the median and individual data points.
No differences in caspase activities between CD and controls
Caspase activity in the activated and activated plus Fas-treated lymphocytes was analysed (from cell lysates) to identify differences between the CD and control samples that could explain the apoptosis results; however, no differences were observed (Fig. 4). Caspase-9 activity was significantly lower after Fas treatment in the activated CD samples compared with only the activated CD cells. For caspase-8, a trend was observed only in the same groups (P = 0.17). Caspase-3 activity was shown to be similar in all the experimental groups.

Caspase activity was determined in lymphocyte lysates from activated cells and activated plus Fas-treated cells (n = 11 controls; n = 14 CD). Results are represented in a box and whiskers plot with the median and individual data points. **P < 0.005.
Catalase activity is inhibited in CD lymphocytes
As shown in Fig. 5, a significant decrease in catalase activity was observed (P < 0.001) in the Fas-treated CD lymphocytes. Also, a tendency towards a decrease in catalase activity was detected in the activated CD lymphocytes before Fas treatment (P = 0.087). In additional experiments, an inhibited ΔΨm was observed in CD lymphocytes with respect to control cells (Supplementary Fig. S5B).
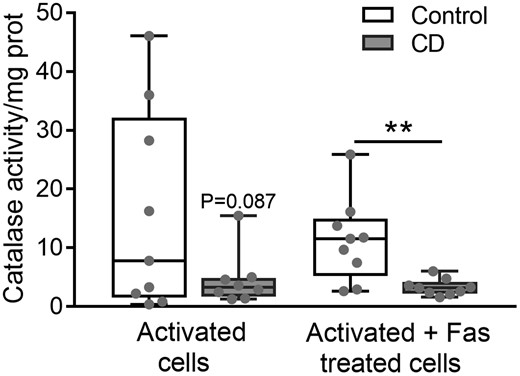
Catalase activity in purified lymphocytes after activation and after activation plus Fas treatment. (n = 10 controls; n = 12 CD). Results are represented in a box and whiskers plot with the median and individual data points. **P < 0.005.
The association between catalase activity reduction and apoptosis resistance was confirmed in additional ex vivo experiments in which catalase from healthy control lymphocytes was inhibited and apoptosis was later analysed. The same protocols for lymphocyte isolation, activation, and Fas treatment were employed; however, on day 0, AMT (catalase inhibitor) was added to the cell culture medium at various concentrations. As depicted in Fig. 6A, catalase inhibition in the control lymphocytes resulted in a significant dose-dependent reduction in apoptosis. The catalase activity inhibition in these lymphocytes was confirmed (Supplementary Fig. S6A), and higher basal and TBH-stimulation concentrations of H2O2 in control lymphocytes after catalase activity reduction were recorded (Supplementary Fig. S6B).
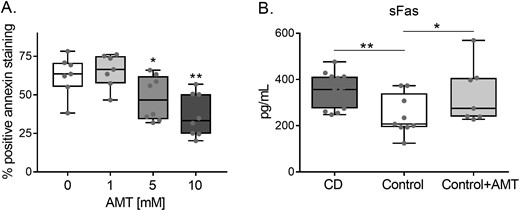
(A) Apoptosis in control lymphocytes after catalase inhibition with AMT. Lymphocytes were activated for 5 days, and AMT at various concentrations was added to the culture medium on day 0. After activation, lymphocytes were analysed by flow cytometry to detect apoptosis increments. (n = 9). Results are represented in a box and whiskers plot with the median and individual data points. (B) Soluble Fas levels in CD (n = 12), controls (n = 10), and AMT-treated control samples (n = 9). *P < 0.05; **P < 0.005.
Other elements participating in the Fas apoptosis pathway were also analysed. Soluble Fas, which is less expressed in control samples, increased its levels in the AMT-treated control cells similar to CD levels (Fig. 6B).
Discussion
In this study, we report that peripheral blood CD4 T cells from patients with CD are intrinsically less prone to undergo apoptosis, a feature that can be observed before these cells migrate to the intestinal mucosa. The antioxidant enzyme catalase is inhibited in these cells, and the ex vivo activity reduction of catalase in T cells from healthy controls makes these cells resistant to apoptosis, acquiring apoptotic features similar to CD cells. Other classical elements linked to apoptosis (Bax, bcl-2, NF-kB, and caspases) showed no differences between lymphocytes from CD and control samples, although caspase-9 activity was different in CD after Fas treatment.
The apoptotic resistance of lymphocytes located in the intestinal mucosa has been considered a hallmark of CD pathogenesis [31, 32]. However, it has thus far been unclear whether this feature is intrinsic to these cells or is acquired after migrating to the gut. Apoptosis plays an important role in eliminating activated T cells when the immune reaction is finished, avoiding potentially uncontrolled and harmful effects. However, scarce research has addressed the characterization of T cells prior to migration to the gut. For the first time, to our knowledge, we report that peripheral blood T cells from patients with CD are less sensitive to death by apoptosis. Furthermore, this feature can be enhanced if Fas apoptosis stimulus has been added to the cell culture medium. Given that all the CD samples, we analysed were at the onset of the disease and prior to specific medication intake, our results were not biased by interference with regard to the effects of CD treatments.
ROS are thought to affect T-cell function and proliferation [33]. However, changes in the T-cell redox regulatory mechanisms could be directly linked to the pathogenesis of certain diseases. Oxidative stress, through an excessive release of reactive oxygen metabolites, produces tissue-destructive mechanisms [34], however, the experimental evidence for its involvement is scarce and generally lacking in causative origin [35]. Our group has reported the importance of oxidative stress in CD, revealing evidence of the permanent inhibition of catalase in PBMC [19], results that appear counterintuitive until the catalase characteristics are studied in detail. Catalase is one of the most efficient enzymes known and cannot be saturated by H2O2 at any concentration, with the potential function of regulating apoptosis rather than just protecting cells against H2O2 [19]. Nevertheless, few studies have previously analysed catalase activity levels in the inflammatory bowel disease context, although they were performed at the intestinal site. At this level, no differences between damaged and undamaged tissue have been observed [36, 37], even considering that neutrophil-derived ROS might affect CD lymphocytes with depleted catalase activity. In this context, the increase in other antioxidant enzymes, such as glutathione peroxidase, has been considered a defence mechanism against oxidative stress [18, 19]. In peripheral blood CD T cells, we demonstrated that catalase is inhibited. Furthermore, catalase inhibition and apoptosis resistance can be directly linked, given that ex vivo catalase activity reduction in T cells from healthy controls results in a significant reduction of apoptosis, resembling features of CD T cells. Whether the catalase inhibition is intrinsic to patients with CD by genetic/epigenetic modification or is the result of oxidative stress overload is under investigation in our laboratory. We have published that an SNP in CAT gene is associated with the risk of CD [38].
Fas (CD95) receptor expression can be boosted by cytokines, such as IFNγ and TNF, and by lymphocyte activation [39]. These cytokines were increased in PBMC from CD and can explain the increased Fas receptor levels observed in CD lymphocytes. The activation of T cells involves IL-2 induction and IL-2 autocrine stimulation, sustaining the proliferation capacity, and later sensitizing towards apoptosis [10]. Soluble Fas and Fas ligands (apoptotic pathway) are particularly relevant to the regulation of mucosal immunity [1, 13, 39]. The decrease in Fas-mediated apoptosis of CD T cells becomes especially important to pathogenesis, and failure of this death pathway can impair mechanisms for the elimination of activated T cells [10]. Previous studies attempting to explain the primary origin of the apoptosis inhibition have reported that total blood leukocytes from CD respond normally to Fas-induced apoptosis [11], raising the hypothesis that it is the inflammatory reaction at the mucosal site that upregulates antiapoptotic molecules in these cells. However, when CD blood lymphocytes were purified for in-depth study, they were shown to be less prone to apoptosis, and a link between defects in Fas signalling and catalase inhibition can be established. On the other hand, it cannot be ruled out that a (probably very small) proportion of these cells might show apoptotic-competent behaviour, despite most of the cells showing apoptosis resistance.
Apoptosis is known to be regulated by two major intracellular pathways: the extrinsic and the intrinsic [2, 10, 11]. In the first, Fas signalling induces caspase-8 activation, which later results in the activation of the executioner caspase-3 and cell death. The intrinsic pathway is mediated by caspase-9, APAF-1, and cytochrome C, which is regulated by the Bcl-2/Bax family of proteins. However, none of the caspases we analysed showed differences between the CD and control samples. Only caspase-9 showed different activity after Fas treatment in the CD group, indicating that mitochondria could be a key organelle in the impaired apoptosis, an effect that could be enhanced in the presence of Fas. Other authors have observed similar results when treating peripheral blood lymphocytes with the Fas antibody, resulting in the enhanced cleavage of both caspase-3 and caspase-8 to an equal extent in patients and controls [40, 41]. Furthermore, the authors indicated that only the intrinsic apoptosis machinery is affected in CD. Our results also agree with former publications reporting that cell death can be independent of caspases, presumably as a result of mitochondrial failure [42]. We also analysed levels of the two most important pro-apoptotic and anti-apoptotic proteins: Bax and bcl-2. Unexpectedly, neither of them were differently expressed in blood CD lymphocytes versus controls. In line with our results, the tendency to undergo apoptosis unrelated to these proteins has also been hypothesized [5]. However, it would be of interest to check whether the results of the Bax/bcl-2 ratio, and caspases activity, were similar if catalase was pharmacologically modified in control cells.
Another mechanism that influences apoptosis is NF-kB. Although its anti-apoptotic functions are well known, we observed no differences in the NF-kB subunits between the CD and control samples. This is an interesting result, given that the primary role of NF-kB in regulating apoptosis via Fas remains controversial. Although it has been reported that NF-kB is important in protecting T cells from Fas-mediated apoptosis [43], other authors have indicated that Fas can activate NF-kB, which could be translated into apoptotic signals [13, 44]. In addition, oxidative stress could influence apoptosis by modifying gene expression, causing them to develop mechanisms to protect cells from apoptosis [45].
It remains to be explored whether the peripheral blood CD4+ T-cell subpopulations and CD8+ present similar apoptotic behaviour. These experiments are under consideration in our laboratory. To avoid pharmacological bias, we included, in the study, patients with newly diagnosed active CD who were treatment-naïve at the time of sampling. The effect of the drugs typically prescribed for CD on catalase activity and apoptosis pathways and the resulting clinical outcomes should be studied in depth [45, 46]. It is also important to study the influence of disease localization and the specific phenotype in the apoptotic capacity of peripheral blood T cells, as previously indicated for immune cells located at the intestinal site [47, 48], as well as to conduct a deeper characterization of naïve/memory, tissue residence, and other markers.
Conclusions
This study has demonstrated that catalase inhibition has a direct impact on the apoptotic capacity of T cells and thus can participate in the pathogenic events occurring in CD. We postulate that the modulation of catalase activity could offer a new treatment approach for CD. Further investigation will characterize whether catalase inhibition is an original defect or whether it depends on systemic events such as ROS regulation, epigenetic changes or other mechanisms that could originate in the dysfunctional bowel microbiota environment.
Abbreviations
- AMT
3-amino-1,2,4-triazole
- Bax
Bcl-2 associated X-protein
- bcl-2
antiapoptotic B-cell lymphoma 2
- CCR9
chemokine receptor type 9
- CD
Crohn’s disease
- ITGαE
human integrin alpha E
- PBMC
peripheral blood mononuclear cells
- ROS
reactive oxygen species
- TBH
tert-butyl-hydroperoxide
- ΔΨm
mitochondrial membrane potential
Funding
This study was supported by grants from the Healthcare Institute Carlos III (PI06/730) and a grant from the Spanish Ministry of Science and Innovation (CAS14/00311).
Conflict of interests
All authors declare no conflicts of interest regarding the publication of this article.
Author contributions
Inés Moret-Tatay: study design, data collection, experimental analysis and interpretation, manuscript writing, and critical review. Pilar Nos and Marisa Iborra: data collection and critical review. Francisco Rausell: experimental analysis and interpretation. Belén Beltrán: study design, results interpretation, and critical review. All the authors reviewed and approved the final manuscript.
Ethical approval
All participants granted their written informed consent, and the study was approved by the Ethics Committee of La Fe University Hospital (no. PI06/730) and complied with the Declaration of Helsinki.
Data availability
The authors declare all data supporting the findings of this study are available within this article and its Supplementary Information, or from the corresponding author upon reasonable request.
