


Abstract
Passive transfer of antithyroid antibodies in mice leads to reproductive disorders. The purpose was to assess the placental tissue of experimental animals under the influence of the circulating thyroperoxidase antibodies. We performed an immunohistochemical examination of murine placentae after a passive transfer of thyroperoxidase antibodies. Placentae of mice that passively transferred IgG from healthy donors were used as control samples. For histological examination, 30 placental samples were selected from mice from the anti-TPO group and 40 placental samples were taken from mice from the IgG group. Immunostaining for VEGFR1, THBS 1, Laminin, CD31, CD34, FGF-β, CD56, CD14, TNF-α, kisspeptin, MCL 1, and Annexin V was performed. There is a significant decrease in the relative area of the expression of VEGFR1 (23.42 ± 0.85 vs. 33.44 ± 0.35, P < 0.01), thrombospondin 1 (31.29 ± 0.83 vs. 34.51 ± 0.75, P < 0.01), CD14 (25.80 ± 0.57 vs. 32.07 ± 0.36, P < .01), CD56 (30.08 ± 0.90 vs. 34.92 ± 0.15, P < 0.01), kisspeptin (25.94 ± 0.47 vs. 31.27 ± 0.57, P < 0.01), MCL 1 (29.24 ± 1.06 vs. 38.57 ± 0.79, P < 0.01) in the labyrinth zone of the placentae of mice from the anti-TPO group compared with control group. A significant increase in the relative expression of laminin and FGF-β was noted in the group of mice to which antibodies to thyroperoxidase were transferred, compared with the control group (36.73 ± 1.38 vs. 29.83 ± 0.94, P < 0.01 and 23.26 ± 0.61 vs. 16.38 ± 1.01, P < 0.01respectively). Our study exposed an imbalance of pro- and anti-angiogenic factors, decreased representation of placental macrophages and NK cells, abnormal trophoblast invasion processes, and insufficient expression of antiapoptotic factors in the placentae of mice in which anti-TPO antibodies were passively transferred.
Introduction
Autoimmune thyroiditis (AIT) is the most common autoimmune disease in women of the reproductive age. Dysfunctions of the thyroid gland associated with AIT often lead to infertility, obstetric and perinatal complications [1]. At the same time, there is reason to consider the antithyroid antibodies (ATA) as an independent risk factor for a complicated pregnancy course [2]. Among all pregnant women up to 17% are carriers of thyroperoxidase antibodies (a-TPO) and/or thyroglobulin (Tg) [1]. Such patients do not always have deviations in the levels of thyroid-stimulating hormone (TSH), thyroxine (T4), and triiodothyronine (T3), which in this case casts doubt on the validity of hormone replacement therapy [1]. Meanwhile a preventive intervention strategy focused on monitoring such situations has not yet been developed. In this regard, numerous studies have been conducted to identify and prove the pathogenetic mechanisms underlying the direct damaging effect of ATA. For a number of understandable ethical reasons, the modulating assessment of ATAs effects is carried out mainly in experimental studies with animals. Thus, the effects of ATA on the processes of ovo-implantation [3] and on the features of fetus intrauterine development [4] have been studied. However, there is still no data in the literature on the possible effect of ATA on indicators of placentogenesis—a key link that actualizes the pregnancy outcome under the influence of any damaging factor.
The purpose of this paper was to assess the structural and functional state of placental tissue based on biological markers in the placentae of experimental animals under the influence of circulating thyroperoxidase antibodies.
Materials and methods
Test model development
Female ICR mice, 10–12 weeks old (Envigo Jerusalem, Israel) on day 4 of gestation were subjected to a passive transfer with IgG recovered from the sera of patients with AIT and infertility at a dosage of 100 μg/mouse (GE Healthcare Bio-Sciences AB) (aTPO group, n = 14). These sera contained high titers of anti-TPO antibodies (more than 1000 IU/ml), but were negative for anti-Tg and antiphospholipid antibodies. A control group of mice was given an injection of a commercial mixture of human IgG from healthy donors at a dosage of 100 μg/mouse (Jackson, ImmunoResearch Laboratories) (IgG group, n = 14). On day 16 of the gestation the animals were sacrificed in accordance with Protocol No. 1008/16 of the Ethics Committee of the Israeli Ministry of Health [5].
Thereafter murine placentae were collected and examined. The samples were fixed in 4% formaldehyde, then dehydrated with 96% ethano and paraffin-embedded.
Immunohistochemical examination of murine placentae
Immunohistochemical examination was performed on 4 μm thick paraffin sections, which were placed on glass slides coated with poly-l-lysine film (MENZEL/Thermo Fisher Scientific, Germany). Immunohistochemical reaction was carried out using a standard one-step protocol with antigen retrieval (high-temperature tissue treatment) in 0.01 M citrate buffer (pH 6.0). Antibodies characterizing the process of angiogenesis were used: fibroblast growth factor 2 polyclonal antibody at a dilution of 1: 120 [RPA551Mu01], (Cloud-CloneCorp., Wuhan, China); anti-laminin polyclonal antibody at a dilution of 1: 200 [ab11575], (Abcam, Cambridge, Massachusetts, USA); CD34 monoclonal antibody at a dilution of 1: 300 [ab81289], (Abcam, Cambridge, Massachusetts, USA); thrombospondin 1 polyclonal antibody at a dilution of 1: 120 [PAA611Mu02], (Cloud-CloneCorp., Wuhan, China); VEGF 1 receptor recombinant antibody at a dilution of 1: 100 [ab32152], (Abcam, Cambridge, Massachusetts, USA); CD31 polyclonal antibody at a dilution of 1: 200 [RPA363Mu02] as a marker of vasculogenesis, (Cloud-CloneCorp., Wuhan, China). To study the characteristics of the maternal immune response to the fetus, the following markers were evaluated: CD56 polyclonal antibody (marker of uterine NK cells) at a dilution of 1: 300 [PAB225Mu01], (Cloud-CloneCorp., Wuhan, China); CD14 polyclonal antibody (marker of placental macrophages) at a dilution of 1:200 [PAA685Mu01], (Cloud-CloneCorp., Wuhan, China); TNF-α monoclonal antibody characterizing the pro-inflammatory immune response at a dilution of 1: 100 [ab1793], (Abcam, Cambridge, Massachusetts, USA). To assess the process of apoptosis, a MCL 1 recombinant antibody was used at a dilution of 1:200 [32087], (Abcam, Cambridge, Massachusetts, USA). Annexin V polyclonal antibody at a dilution of 1:200 [ab14196], (Abcam, Cambridge, Massachusetts, USA) was used as one of the markers of the hemostatic system. Kisspeptin 1 polyclonal antibody at a dilution of 1:200 [PAC559Mu01], (Cloud-CloneCorp., Wuhan, China) was used to evaluate the trophoblast invasion. IHC SupportPack [IS086], (Cloud-CloneCorp., Wuhan, China) and EnVision FLEX+, HighpH, HRP, and mouse [K800221], (Dako, Danmark) were used as imaging systems.
The immunohistochemical examination included a quantitative, qualitative assessment of the studied markers expression and a morphometric assessment using the Videotest Morphology 5.2 program (Saint Petersburg, Russia).
Quantitative assessment of the results of the immunohistochemical reaction was analyzed on 420 micrographs obtained using a microimage fixation system consisting of an Olympus BX46 microscope and CellSens 47 Entry software. For histological examination, two placentae were selected from three mice from the anti-TPO group and two placentae from four mice from the IgG group. Five micrographs were taken from one section of each placenta in different fields of view. Fields of view containing tissue defects, staining defects, and artifacts were excluded from the photographic work. The photographs were taken at a magnification of 400× (eyepiece 10×, objective 40×) in the Photo mode (exposure time 1/38 s, camera sensitivity—maximum, image size 2080 × 1544 pixels, graphic image format JPEG (normal)). The proportion of occupied expression of the studied marker was calculated using the VideotestMorphology 5.2 program (Saint-Petersburg, Russia).
The following parameters were assessed in each slice in five fields of view:
- Optical density of expression—the value was calculated automatically in accordance with the Bouguer–Lambert–Beer law; the use of the so-called “optical density of expression” indicator, which is the basic parameter of “VideotestMorphology 5.2” program (Saint-Petersburg, Russia) for the analysis of optical parameters of micrographs is acceptable since measurements are carried out by analogy with spectrophotometric analysis;
- - The relative area of expression was calculated as the ratio of the marker area of expression to the total area of the preparation:
Statistical analysis
The parameters assessed (optical density of expression and relative area of expression) were estimated using mean values and standard error of the mean. To identify statistically significant differences between the study groups, the Mann–Whitney test was applied. P-value of <5% was taken as an indicator of the difference confidence index. To assess correlations the Spearman correlation criterion and regression analysis were used.
Results
Only 73% of fetuses of mice subjected to anti-TPO antibodies were viable (n = 70), while in IgG group 97% of the fetuses were viable (n = 195) (P < 0.05). The average weight of fetuses in the anti-TPO group was 351 mg, while in IgG group—503 mg (P < 0.05) [5]. For further study, placentae of viable fetuses were selected on day 16 of gestation: 6 placentae from the anti-TPO group (the average weight was 112 mg) and 8 placentae from the IgG group (the average weight was 125 mg).
Microscopical evaluation of placentae showed that pathological changes in the placentae of mice were present in both groups [5]. The most significant abnormalities were identified in the labyrinth zone. An uneven thickness of the intervascular membranes was identified along with the uniform filling of maternal lacunae and hypervascularization of the labyrinth zone of varying severity in the anti-TPO group, while in the IgG group changes in vasculature were of an adaptive nature.
In the presence of anti-TPO antibodies in the labyrinth zone of placentae, the average area of the trophoblastic cells nuclei turned out to be significantly larger (P < 0.01), but the area of the trophoblastic cell itself did not differ significantly between the groups (only a tendency to increase was noted in the anti-TPO group). Changes in the nucleo-cytoplasmic ratio in the cells of the labyrinth zone may indicate an increase in the functional activity of the trophoblast cells in response to an increased load. The data are summarized in Table 1.
Indicators of the average area of trophoblast cells and cell nuclei in the labyrinth zone of the mice placentas
| Average cell area (%) | Anti-TPO group M ± SD n = 35 | IgG group M ± SD n = 50 | Confidence of difference |
|---|---|---|---|
| Trophoblast cells | 14.20 ± 1.06 | 11.94 ± 1.71 | P > 0.05 |
| Trophoblast cell nuclei area | 23.72 ± 1.31 | 18.17 ± 1.11 | P < 0.01 |
| Average cell area (%) | Anti-TPO group M ± SD n = 35 | IgG group M ± SD n = 50 | Confidence of difference |
|---|---|---|---|
| Trophoblast cells | 14.20 ± 1.06 | 11.94 ± 1.71 | P > 0.05 |
| Trophoblast cell nuclei area | 23.72 ± 1.31 | 18.17 ± 1.11 | P < 0.01 |
n—number of samples.
P-value <0.05 is taken as an indicator of the difference confidence index between groups.
Immunohistochemical study of biomaterial
Qualitative immunohistochemical assessment of the biomaterial showed the presence of expression of all studied markers in mice from the anti-TPO group and from the IgG group in all placental zones—the zone of giant cells, as well as the connective and labyrinth zone. Quantitative assessment of the expression of the markers under study was carried out in the labyrinth zone because it is the placental zone that carries the main functional load of the organ on day 16 of gestation [6, 7].
In the labyrinth zone of the placentae of mice from the anti-TPO group it was found that there is a significant decrease in the relative area of expression of antiangiogenic factors: VEGFR1 (Supplementary Figs. 1 and 2) and thrombospondin 1 (Supplementary Fig. 3 and 4) relative to similar indicators in the IgG group (Table 2).
Average relative areas of expression of markers VEGFR1, THBS 1, Laminin, CD 31, CD 34, FGF-β in labyrinth zone of placenta of mice from anti-TPO and IgG group (%)
| Marker | Average relative area of expression (%) | Confidence of difference | |
|---|---|---|---|
| Anti-TPO group (n = 30), M ± SD | IgG group (n = 40), M ± SD | ||
| VEGFR1 | 23.42 ± 0.85 | 33.44 ± 0.35 | U = 59. P < 0.01 |
| THBS 1 | 31.29 ± 0.83 | 34.51 ± 0.75 | U = 338.5. P < 0.01 |
| Laminin | 36.73 ± 1.38 | 29.83 ± 0.94 | U = 275. P < 0.01 |
| FGF-β | 23.26 ± 0.61 | 16.38 ± 1.01 | U = 267.5. P < 0.01 |
| CD 31 | 3.04 ± 0.27 | 3.41 ± 0.39 | U = 503. P > 0.05 |
| CD 34 | 2.89 ± 0.57 | 2.15 ± 0.24 | U = 461. P >0.05 |
n—number of samples.
P-value <0.05 is taken as an indicator of the difference confidence index between groups.
Intergroup differences were confirmed with a statistical difference by the concomitant increase in the relative area of the laminin (Supplementary Figs. 5 and 6) and FGF-β (Supplementary Figs. 7 and 8) expression, which have a pro-angiogenic effect (Table 2). As is commonly known, the laminin is a necessary microenvironment in the process of proliferation of endothelial cells and characterizes the state of the basement membranes of blood vessels. While the main fibroblast growth factor (FGF-β) stimulates the division of endothelial cells and their organization into tubular structures.
No differences were found in the expression level of the CD31 vasculogenesis marker (Supplementary Figs. 9 and 10) and the CD34 angiogenesis marker (Supplementary Figs. 11 and 12), which could indicate the presence of an endothelial injury (Table 2).
Spearman’s correlation coefficient and correlation analysis of the studied biomolecular factors enabled to identify and evaluate the nature of the dependence of the size of cells and their nuclei in the labyrinth zone on the level of FGF2 expression (Table 3).
Analysis of the dependence of the area of cells and their nuclei on the level of FGF2 expression: in the labyrinth zone of the placenta of mice from the anti-TPO group and the IgG group
| Anti-TPO group (n = 35) | IgG group (n = 50) | |||
|---|---|---|---|---|
| Average trophoblast cell area (%) M ± SD | Average relative area of FGF-β expression (%) M ± SD | Average trophoblast cell area (%) M ± SDD | Average relative area of FGF-β expression (%) M ± SD | |
| Indicators of morphometry (%) | 14.20 ± 1.06 | 23.26 ± 0.61 | 11.94 ± 1.71 | 16.38 ± 1.01 |
| Correlations | rs = −0.357. P ≤ 0.05 | rs = −0.593. P ≤ 0.01 | ||
| Average trophoblast cell area (%) | Average relative area of FGF-β expression (%) M ± SD | Average trophoblast cell area (%) | Average relative area of FGF-β expression (%) M ± SD | |
|---|---|---|---|---|
| Indicators of morphometry (%) | 23.72 ± 1.31 | 23.26 ± 0.61 | 18.17 ± 1.11 | 23.26 ± 0.61 |
| Correlations | rs = −0.421 (P ≤ 0.05) | rs = −0.587. P ≤ 0.01 | ||
n—number of samples.
P-value < 0.05 is taken as an indicator of the difference confidence index between groups.
In the anti-TPO group, it was found that the average area of expression of the FGF2 marker and the average area of cells and cell nuclei of trophoblast showed a weak inverse linear relationship (rs = −0.357 and rs = −0.421, P ≤ 0.05, respectively). The linear dependence coincided with the results of the similar correlation analysis carried out between the FGF2 marker and the average area of cells and cell nuclei of trophoblast in the control group (rs = −0.593 and rs = −0.587, P ≤ 0.01, respectively).
Immunohistochemical assessment of the factors characterizing the maternal immune response in relation to the fetus in the anti-TPO group revealed a significant decrease in the expression of markers of placental macrophages (CD14) (Supplementary Figs. 13 and 14) and uterine NK ycells (CD56) (Supplementary Figs. 15 and 16) relative to the level of expression of these markers in the IgG group (Table 4).
Average relative areas of expression of CD 56, CD 14, and TNF-α marker in the labyrinth zone of placentas of mice from the anti-TPO group and the IgG group (%)
| Marker | Average relative area of expression (%) | Confidence of difference | |
|---|---|---|---|
| Anti-TPO group (n = 30), M± SD | IgG group (n = 40), M ± SD | ||
| CD 56 | 30.08 ± 0.90 | 34.92 ± 0.15 | U = 288. P < 0.01 |
| CD 14 | 25.80 ± 0.57 | 32.07 ± 0.36 | U = 212. P < 0.01 |
| TNFα | 35.24 ± 0.53 | 36.22 ± 0.78 | U = 536. P > 0.05 |
n—number of samples.
P-value <0.05 is taken as an indicator of the difference confidence index between groups.
The expression index of proinflammatory cytokine tumor necrosis factor-α did not differ statistically between groups (Supplementary Figs. 17 and 18, Table 4).
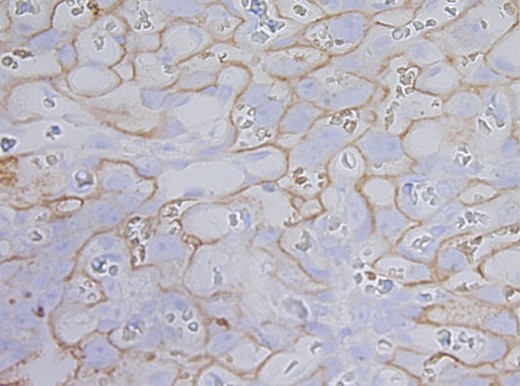
With respect to kisspeptin, which is involved in the regulation of the trophoblast invasion process, a significant decrease in the relative area of its expression was revealed in the anti-TPO group as compared with the IgG group (Supplementary Figs. 19 and 20, Table 5). Similar significant differences in the area of expression were found for the MCL 1 antiapoptopic marker (Supplementary Figs. 21 and 22, Table 5).
Average relative areas of expression of kisspeptin, MCL 1 and Annexin V markers in the labyrinth zone of placentas of mice from the anti-TPO group and the IgG group (%)
| Marker | Average relative area of expression (%) | Confidence of difference | |
|---|---|---|---|
| Anti-TPO group (n = 30), M ± SD | IgG group (n = 40), M ± SD | ||
| Kisspeptin | 25.94 ± 0.47 | 31.27 ± 0.57 | U = 246.5. P < 0.01 |
| MCL 1 | 29.24 ± 1.06 | 38.57 ± 0.79 | U = 129. P < 0.01 |
| AnnexinV | 50.70 ± 2.33 | 57.58 ± 2.91 | U = 506. P > 0.05 |
n—number of samples.
P-value <0.05 is taken as an indicator of the difference confidence index between groups.
No differences were found between the groups in the level of expression of annexin V (Supplementary Figs. 23 and 24, Table 5).
Discussion
The conditions for the formation and morphofunctional state of placenta provide several key interrelated processes—proliferation, vasculogenesis and angiogenesis, apoptosis, invasion—which reflect the physiological course of pregnancy and significantly affect the development of obstetric and perinatal complications. A variety of factors (infectious, genetic, hormonal, toxic, and immune) can lead to a violation of placentogenesis and manifestations of placental insufficiency. An immune factors take place in symptomatic autoimmune diseases (autoimmune thyroiditis, systemic lupus erythematosus, antiphospholipid syndrome, multiple sclerosis, rheumatoid arthritis, and systemic scleroderma). However, the presence of various autoantibodies that do not always have nosological markings is rightly considered as an independent risk factor for the development of reproductive disorders, including those associated with placental insufficiency.
In a clinical setting, the study of the nature of placental insufficiency is possible by non-invasive methods, but is always extrapolated and depends on the characteristics of the course of a particular disease. Only the use of experimental animals makes analysis of the damaging factor possible. Mice are best adapted to the study of placental insufficiency as the structure of the blood placenta barrier of mice is close to that of humans [8]. The high fertility and short gestation period of mice (20–21 days) are also an advantage for experimental work.
In this study a special attention was paid to analyze the characteristics of the labyrinth zone of mice placentae, which provides the exchange of oxygen and nutrients between the blood flow of the mother and the fetus. It is this zone, which on the 16th day of gestation reaches its prime and determines under physiological conditions the degree of placental maturity, that is comparable to the third trimester of human pregnancy [6–8].
The increased percentage of fetal resorption and the lagging of their mass-growth parameters in the anti-TPO group revealed during the experiment are the main clinical manifestations of the placental insufficiency. Histological examination of placentae from the anti-TPO group enabled us to determine the discrepancy between the state of the placental tissue and the gestational age and signs of placental insufficiency in all samples. To identify the pathogenetic mechanisms underlying these changes, the immunohistochemical examination method was used.
During the immunohistochemical examination of placentae in the anti-TPO group, significantly lower levels of expression of VEGFR1 and thrombospondin1 antiangiogenic markers were found compared with the control group. A decrease in the expression of antiangiogenic factors may contribute to the limitation of branching of vasculature and the transition from branching to non-branching angiogenesis [9, 10]. Such decrement may serve as an indicator of the insufficient maturity of the placental tissue in the anti-TPO group, as changes in the nature of angiogenesis are characteristic of placentae at later stages of gestation. Our results, which showed a low level of expression of thrombospondin 1 in a model group of mice with structural and functional changes in the placental tissue, correlate with the data of other researchers [11, 12]. At the same time, there were reports of increased production of thrombospondin-1 in the placental tissue in a context of impaired maturation of chorionic villi in preeclampsia [13, 14].
An increase of laminin expression in the group of immunized mice compared to the control group may also indicate a less mature state of placental tissue. Trophoblast formation from the earliest stages critically depends on laminin. Laminin is the main factor in the microenvironment of trophoblast stem cells, which modulates the degree of their proliferation [15] and affects the activity of invasion of the trophoblast [16]. At the same time, the results of the previous studies should be taken into account. Liu et al. showed that in an uncomplicated pregnancy in the human placenta, the level of laminin in the basement membrane of the trophoblast of the villi in late gestation decreases relative to the indicator determined at early stages [17]. The researchers explain this fact by a decrease in the trophoblast proliferative activity. In this case, the higher level of laminin in the studied group relative to the control group can obviously be considered to be a manifestation of the morphological and functional immaturity of the placental tissue.
In addition, the TPO group showed an increased expression of fibroblast growth factor-β, which has the ability to stimulate the division of endothelial cells and their organization into tubular structures. In this regard, fibroblast growth factor-β is considered as a marker of angiogenesis: the higher its expression in the tissue, the more active the processes of angiogenesis are. It is believed that an increase in fibroblast growth factor-β expression, and, consequently, activation of angiogenesis can induce hypoxia of the placental tissue, one of the main links in the pathogenesis of placental insufficiency [18, 19]. In this case, the result obtained may reflect the presence of tissue hypoxia in the placentae of mice subjected to a passive transfer [18]. The level of fibroblast growth factor-β expression in both groups negatively correlated with the area of trophoblastic cells in the labyrinth zone (rs = −0.357, P ≤ 0.05 in the anti-TPO group and rs = −0.587, P ≤ 0.01 in the IgG group), as well as with the area of cell nuclei (rs = −0.421, (P ≤ 0.05) in the anti-TPO group and rs = −0.593, P ≤ 0.01in the IgG group). Consequently, an increased level of fibroblast growth factor-β in the group of immunized animals may serve as an evidence that injection of antibodies to thyroperoxidase in animals promotes the development of tissue hypoxia. And the tissue hypoxia in turn leads to the development of placental insufficiency with an abnormal nucleocytoplasmic ratio in the trophoblast cells.
The expression of CD31, a recognized marker of vasculogenesis, was comparable in the main and control groups. Perhaps this is due to the fact that in the late stages of pregnancy, the value of vasculogenesis (de novo vascular synthesis during embryonic development) decreases, and the processes of angiogenesis (synthesis of vessels from existing cells) prevail [9]. There were no intergroup differences in CD34 expression as a marker of angiogenesis intensity. At the same time, there were no signs of damage to the endothelium of fetal vessels in the labyrinth zone of the placenta, characterized by increased expression of this marker [20, 21]. The endothelium within the blood placenta barrier of the mice lines fetal vessels separated from the maternal bloodstream by the basement membrane, bilayer syncytiotrophoblast, and cytotrophoblast, lining the sinuses with maternal blood. It is possible that the antithyroid antibodies and immune complexes circulating in the maternal bloodstream are not able to cross the basement membrane of the endothelium of fetal vessels, or the transport of these antibodies to the fetus occurs in clinically insignificant quantities.
The expression of kisspeptin in the placentae of model animals was significantly lower as compared to the control group, indicating altered trophoblast invasion in mice subjected to thyroperoxidase antibodies. Defects of trophoblast invasion inevitably lead to a deterioration of the placental perfusion and, as a result, to a chronic tissue hypoxia. Our data are consistent with the results previously published by Li et al [22]., according to which a reliably decreased kisspeptin expression was revealed in the placentae of mice with high percentage of fetal resorption on 14th day of gestation. However, interestingly, according to some researchers, the level of placental kisspeptin in pregnant women with preeclampsia, and hence placental insufficiency, is higher than in women with uncomplicated pregnancies [23, 24]. The reasons for the discrepancy between the results are apparently associated with the difference in pathogenetic mechanisms of placental insufficiency.
With regard to factors characterizing the state of maternal immune response, no signs of cytokine shift towards proinflammatory immune response were revealed, and the levels of TNFα expression did not demonstrate significant intergroup differences. However, the expression level of CD56 uterine NK cell markers and CD14 placental macrophages in the group of immunized model animals was significantly lower compared with the control group. Thus, in addition to regulating the immune response of the mother to the fetus, each of these factors affects the processes of angiogenesis, tissue remodeling, and trophoblast invasion. Reduced levels of these markers may indicate insufficient activity of key processes of placenta formation and maturation [25–29].
The results of the immunohistochemical examination in the anti-TPO group revealed significantly lower indicators of relative area of expression of the myeloid cell leukemia sequence 1, which is antiapoptotic factor, compared to the control group. These data can be considered as an indirect evidence of active participation of apoptosis in the disturbance of structural and functional formation of trophoblastic tissue. We believe that insufficient influence of antiapoptopic factors in the placentae of immunized animals could be a reason for activation of apoptosis.
Stable expression indices of annexin V, one of the main functions of which is regulation of hemostasis, let us assume that the hemostasis system in the model animals has not undergone gross disturbances.
Conclusion
Thus, the results of the histological and immunohistochemical analyses of the trophoblastic tissue of the maternal-fetal complex in the model animals revealed a combination of various processes that change the patterns of placentogenesis: imbalance of pro- and anti-angiogenic factors, decreased representation of placental macrophages and NK cells, abnormal trophoblast invasion processes and insufficient expression factors. Together, these led to the structural and functional disorders of the placental tissue in the model animals after the administration of IgG from patients with autoimmune thyroiditis and infertility with high titers of anti-TPO antibodies, but without anti-TG and antiphospholipid antibodies. Therefore, we can conclude that transfer of thyroperoxidase antibodies to experimental animals leads to a dissociation of the main morphogenetic processes of placental tissue development.
Abbreviations
- AIT
autoimmune thyroiditis
- ATA
antithyroid antibodies
- a-TPO
antibodies to thyroperoxidase
- a-Tg
antibodies to thyroglobulin
- FGF2 (FGF-β)
fibroblast growth factor 2 (fibroblast growth factor- β)
- MCL 1
myeloid cell leukemia sequence 1
- T3
triiodothyronine
- T4
thyroxine
- THBS 1
thrombospondin 1
- TNF-α
tumor necrosis factor-alpha
- TSH
thyroid-stimulating hormone
- VEGFR1
vascular endothelial growth factor receptor 1.
Acknowledgements
Not applicable.
Ethical Approval
The research was performed according the Protocol No. 1008/16 of the Ethics Committee of the Israeli Ministry of Health.
Conflict of Interests
The authors declare no conflict of interest.
Funding
The article is supported by a grant from the Government of the Russian Federation (14.W03.31.0009).
Data Availability
The data underlying this article are available in the article and in its online supplementary material.
Author Contributions
Conceptualization—A.M.G., L.Kh.D., D.A.N., Y.S.; Formal Analysis—E.B., G.Kh.T., T.G.T.; Funding acquisition—L.P. C., Y.S.; Investigation—E.B., G.Kh. T., T.G.T., G.Kh.S., M.B.; Methodology—A.M.G., D.A.N.; Project administration—Y.O., L.P.C.; Resources—G.Kh.T., T.G.T., I.Y.K., L.P.C., H.A., M.B.; Supervision—D.A.N., Y.S.; Visualization—E.B., G.Kh.T., T.G.T.; Writing—Original Draft—E.B.; Writing—review and editing—Y.S., A.M.G., D.A.N.. All authors have read and agreed to the published version of the manuscript.
Permission to Reproduce
Not applicable.
