


Abstract
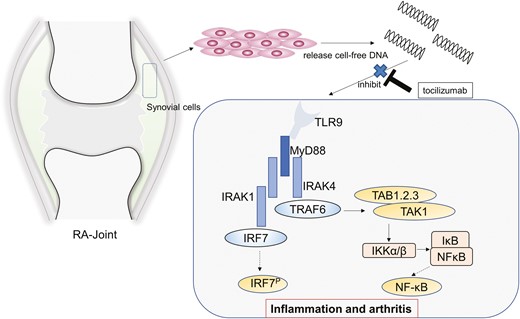
Endogenous DNA is released into the bloodstream as cell-free DNA (cfDNA) following cell death and is associated with various pathological conditions. However, their association with therapeutic drugs against rheumatoid arthritis (RA) remains unknown. Therefore, we investigated the significance of cfDNA in RA treated with tocilizumab and tumour necrosis factor inhibitor (TNF-I). Biological DMARDs (bDMARDs), including tocilizumab and TNF-I, were administered to 77 and 59 RA patients, respectively. Plasma cfDNA levels were measured at weeks 0, 4, and 12 by quantitative polymerase chain reaction. Disease activity was evaluated at the same time point using DAS28ESR. cfDNA levels from RA synovial cells treated with tocilizumab or etanercept for 24 h were measured. Human toll-like receptor 9 (hTLR9)-expressing HEK293 cells, which release secreted embryonic alkaline phosphatase (SEAP) upon NF-κB activation, were stimulated by cfDNA from RA patients, and subsequently, SEAP levels were determined. NF-κB translocation was evaluated by immunofluorescence staining with or without tocilizumab. The DAS28ESR significantly improved in both bDMARD groups at week 12. However, plasma cfDNA levels significantly decreased in the tocilizumab group at week 12 compared to that in week 0. cfDNA levels correlated with DAS28ESR in biological treatment-naïve patients administered tocilizumab. cfDNA levels in synovial cells were significantly suppressed by tocilizumab treatment and unaltered with etanercept. HEK293 cells released SEAP upon cfDNA stimulation, and the observed NF-κB nuclear translocation was suppressed by tocilizumab. Tocilizumab suppressed inflammation via the TLR9 pathway by decreasing cfDNA levels. Regulation of cfDNA may be a therapeutic target for RA.
Introduction
Rheumatoid arthritis (RA) is an autoimmune and chronic inflammatory disease influenced by genetic and epigenetic factors [1]. During RA, the synovial membrane transforms into a hyperplastic pannus, causing joint destruction. Fibroblast-like synoviocytes (FLSs) form the lining of joints and play a crucial role in the pathological processes of RA [2]. FLSs promote arthritis by producing various cytokines such as TNF-α, IL-6, and IFN-γ [3, 4]. Biological DMARDs (bDMARDs) and Janus kinase inhibitors target these cytokines to improve disease outcomes [5]. However, the administration of these drugs may result in an inadequate response, supporting the hypothesis that RA is characterized by various types of pathogenesis [6, 7]. Thus, additional prediction markers for monitoring treatment response and developing therapeutic strategies are required.
Endogenous DNA is released into the circulatory system as cell-free DNA (cfDNA) following cell death [8]. Nuclear-derived cfDNA levels significantly increase in cancer patients and are linked to disease progression [9, 10]. The majority of cfDNA in patients with cancer is derived from the tumour tissue [8, 11]. Tracking cfDNA is crucial for understanding the pathogenesis of RA owing to the robust tumour-like proliferation of rheumatoid synovial cells. cfDNA is also associated with inflammatory diseases, such as Bechet’s disease, adult-onset Still’s disease, and ANCA-associated vasculitis [12–14].
Various studies have indicated the potential roles of cfDNA in RA [15]. cfDNA levels in the plasma and synovial fluid increase in patients with RA [16, 17] and might be associated with disease severity [18, 19]. The cfDNA concentration reportedly changes with bDMARD therapy [17, 18, 20]. In addition, hypomethylated CpG-rich sequences from RA-SF (RA synovial fluid) induce inflammation in vitro and in vivo [21], indicating that cfDNA may induce inflammation and arthritis via DNA sensors such as toll-like receptor 9 (TLR9). However, the relationship between cfDNA and RA-related therapies has not been elucidated.
In this study, we aimed to clarify the novel relationship between cfDNA and bDMARD therapy, especially in terms of IL-6 and TNF inhibition (TNF-I). To evaluate whether changes in cfDNA levels with these bDMARDs influence the disease activity of RA, we also investigated TLR9-mediated inflammation associated with cfDNA.
Materials and methods
Study participants
We enrolled 136 patients with RA who were administered the following treatments: 77 with tocilizumab (TCZ) and 59 with TNF-I (11 with etanercept [ETN], 10 with adalimumab [ADA], 22 with certolizumab pegol [CZP], and 16 with golimumab [GLM]) at Hyogo Medical University Hospital between 2012 and 2021. Blood samples were collected at the baseline (week 0) and weeks 4 and 12. All the patients fulfilled the 2010 ACR/EULAR criteria. Disease activity was monitored according to the DAS28ESR. Synovial tissue was obtained from RA patients during joint surgery. The study was designed and conducted according to the Helsinki Declaration and approved by the Institutional Ethics Committees of the Hyogo Medical University (approval no. 0374 and 4241) and Kobe University (approval no. 579-1). Written informed consent was obtained from all the patients.
cfDNA preparation, quantification, and quantitative polymerase chain reaction
Whole-blood samples from RA patients were isolated to produce plasma, and cfDNA was extracted using the Maxwell® RSC ccfDNA plasma kit (Promega, Madison, WI, USA). cfDNA concentration derived from nuclear (cf-nDNA) was measured by quantitative polymerase chain reaction (qPCR) as previously described [10, 22]. cf-nDNA was measured using primers amplifying the 115-bp amplicon (ALU115). The ALU-PCR primer pairs were as follows: 5ʹ-CCTGAGGTCAGGAGTTCGAG-3ʹ (forward primer) and 5ʹ-CCCGAGTAGCTGGATTACA-3ʹ (reverse primer). The reaction mixture for each qPCR consisted 20 μl of total reaction volume, containing 1 μl of cfDNA, 0.2 μM of forward primer and reverse primer, and 10 μl of 2× concentrated SYBR green I master (Roche Diagnostics, Basel, Switzerland). qPCR was performed for 35 cycles as follows: denaturation for 30 s at 95°C, annealing for 30 s at 60°C, and extension for 30 s at 72°C using LightCycler 480 Instrument II (Roche Diagnostics).
cfDNA concentrations derived from mitochondria (cf-mtDNA) was also measured by qPCR, using primers amplifying the 79-bp short fragments of the mitochondrial 16s-RNA gene [23]. The mtDNA-PCR primer pairs were as follows: 5ʹ-CAGCCGCTATTAAAGGTTCG-3ʹ (forward primer) and 5ʹ-CCTGGATTACTCCGGTCTGA-3ʹ (reverse primer). The reaction mixture for qPCR consisted 20 μl of total reaction volume, containing 1 μl of cfDNA sample, 0.4 μM of each primer, and 10 μl of 2× concentrated SYBR green I master (Roche Diagnostics). qPCR was performed for 40 cycles as follows: denaturation for 15 s at 95°C, primer annealing and extension/synthesis for 60 seconds at 60°C, using a LightCycler 480 Instrument II (Roche Diagnostics).
Synovial fibroblast culture
Synovial tissues from RA patients were minced using surgical scissors for 10 min and treated with 2 mg/ml collagenase (Wako, Tokyo, Japan) in serum-free DMEM (Thermo Fisher Scientific, Waltham, MA, USA) at 37 °C for 1 h. Primary cultured synovial cell lines were established and maintained in DMEM containing 10% (v/v) heat-inactivated foetal bovine serum (FBS; Thermo Fisher Scientific), and penicillin–streptomycin (100 U/ml; Thermo Fisher Scientific) in a humidified incubator at 37°C with 5% CO2. Cells from passages 3–6 were used in all experiments.
Synovial cell assay
Culture supernatants of synovial cells were collected at various confluency states (from 40% to 100% confluency, 24 h, and 48 h after 100% confluency), and then cf-nDNA and cf-mtDNA were measured by qPCR as described earlier. Synovial cells were stimulated with 100 ng/ml IL-6/soluble IL-6 receptor or 10 ng/ml TNF-α for 24 h, then further treated with or without TCZ (100 μg/ml; Chugai Pharmaceutical Co., Tokyo, Japan) or ETN (10 μg/ml; Pfizer Inc., New York, NY, US) for 24 h. TCZ and ETN concentrations were determined based on previous studies [24–26]. Then, cf-nDNA in the supernatant was measured in the same manner.
Cell viability assay
Synovial cell viability was measured in 96-well plates as the absorbance (450 nm) of reduced WST-8 [2-(2-methoxy-4-nitrophenyl)-3-(4-nitriphenyl-0-5-(2,4-disulfonyl)-2H-tetrazolium, monosodium salt] using Cell Counting kit-8 assays (Dojindo, Kumamoto, Japan) with and without cytokine stimulation and bDMARD treatment, as described in “Synovial cell assay.”
SDS/PAGE and immunoblotting
RA synovial cells were washed 3 times with PBS and lysed with lysis buffer A (50 mM Tris–HCl, pH 8.0, 1% v/v Nonidet P-40, 150 mM NaCl, 1.5 mM EGTA (ethylene glycol-bis(β-aminoethyl ether)-N,N,Nʹ,Nʹ-tetraacetic acid), 0.5%, w/v, sodium deoxycholate, 1 mM PMSF (phenylmethylsulphonyl fluoride), 10 mM sodium orthovanadate and 3 mg/ml aprotinin) for 10 min on ice. Lysates were subjected to SDS/PAGE, then transferred to Immobilon-P PVDF (polyvinylidene difluoride) transfer membrane (Merck Millipore, Darmstadt, Germany) and incubated at 4 °C overnight with rabbit anti-cyclin D antibody (1:500 dilution; Upstate Biotechnology, Lake Placid, NY, USA) or rabbit anti-cyclin E antibody (1:100 dilution; Santa Cruz Biotechnology, Santa Cruz, CA, USA). Subsequently, the membranes were incubated for 1 h at room temperature with Amersham ECL anti-rabbit IgG, horseradish peroxidase-linked species-specific F(abʹ)2 fragment (1:5,000 dilution; GE Healthcare, Buckinghamshire, UK) or with Amersham ECL anti-mouse IgG, horseradish peroxidase-linked species-specific F(abʹ)2 fragment (1:2000 dilution; GE Healthcare). Finally, blots were developed using an enhanced chemiluminescence detection system (ImmunoStar Long Detection; Wako) and photographed using Optimashot CL-420α (Fujifilm, Tokyo, Japan).
DNA solution assay
One hundred µg/ml of TCZ, ETN, and ADA (Eisai Co., Ltd Tokyo, Japan.), GLM (Janssen Pharmaceutical K.K, Tokyo, Japan), and CZP (Astellas Pharma Inc., Tokyo, Japan) were added to cfDNA from the plasma of RA patients and incubated at 37 °C for 10, 30, and 60 min. DNA was then re-extracted, and the concentration of cf-nDNA and cf-mtDNA was measured by qPCR. Furthermore, cfDNA from plasma was incubated with TCZ (12 µg/ml), ADA (3 µg/ml), and GLM (1 µg/ml) for 60 min, and cf-nDNA and cf-mtDNA levels were measured in the same manner as described earlier. The concentrations of TCZ, ADA, and GLM were determined based on the trough concentration in the blood [27–29].
HEK 293 TLR9 reporter assay
HEK-293 Blue human toll-like receptor 9 (hTLR9) cells (InvivoGen, San Diego, CA, USA) are a HEK 293 cell line transfected with hTLR9. The cells also express secreted embryonic alkaline phosphatase (SEAP) reporter gene under the control of a nuclear factor-kappa B (NF-κB) inducible promoter in response to oligonucleotides containing CpG motifs (CpG-ODN). SEAP levels in the supernatant were determined using HEK-Blue™ detection solution (InvivoGen). Cells were cultured in DMEM containing heat-inactivated 10%, v/v, FBS, l-glutamine (2 mM; Thermo Fisher Scientific), penicillin–streptomycin (100 U/ml), normocin (100 µg/ml; InvivoGen), blasticidin (10 µg/ml; InvivoGen), and zeocin (100 µg/ml; InvivoGen), in a humidified incubator at 37 °C with 5% CO2. Cells from passages 3–10 were used in all experiments. Cells were seeded in a 96-well plate at a density of 1 × 10⁵ cells/well with 180 μl HEK-Blue™ detection solution (InvivoGen) and stimulated for 24 h using 10 µl of A class CpG-ODN (D35 10 µg/ml; GeneDesign, Osaka, Japan), 10 µl of 10× concentrated cfDNA from RA serum (0.5 × original serum concentration), or 10 µl PBS as a negative control. Stimulation was evaluated with and without TCZ. TLR9 activation was determined at 650 nm absorbance using a SpectraMax Plus 384 microplate reader (Molecular Devices, Tokyo, Japan).
Immunocytochemistry
HEK-293 Blue hTLR9 cells (6.0 × 10³ cells) were stimulated with 1 µl of A class CpG-ODN (D35 10 mg/ml; GeneDesign) or cfDNA from RA patients (0.5 × original serum concentration) with or without TCZ (10 µg/ml) for 6 h. The cells were fixed with 4% formaldehyde, permeabilized in 0.1% Triton X-100 for 5 min, and blocked with 1% BSA. NF-κB staining involved incubating cells at 4°C overnight with Alexa Fluor® 488 rabbit monoclonal antibody to NF-kB p65 (1:50 dilution; ab190205, Abcam, Cambridge, UK). Nuclear DNA was labelled with DAPI (4ʹ,6-diamidino-2-phenylindole). Images were obtained using a BX53 microscope (Olympus, Tokyo, Japan).
Plasma and serum preparation
To prepare plasma, whole-blood samples were collected in Venoject plasma collection tubes containing EDTA-2Na (Terumo Co., Tokyo, Japan) and then centrifuged immediately at 1200 × g for 10 min. For serum, the blood samples were collected in Venoject serum collection tubes containing clot activator (Terumo Co.). The serum was then prepared by incubating whole blood at room temperature for 30 min to allow clotting before being centrifuged at 1200 × g for 10 min. Both samples were stored at −30°C until analysis. Plasma samples were used in cfDNA qPCR and DNA solution assay. Serum samples were used in HEK 293 TLR9 reporter assay.
Statistical analysis
Statistical analyses were performed using JMP Pro version 16 (SAS Institute, Inc. Cary, NC, USA). Comparisons between two groups with a normal distribution were performed using two-sided Student’s t-tests. Differences between continuous variables from data with non-normal distribution were analysed using Mann–Whitney U tests, and differences between paired samples were analysed using the Wilcoxon signed-rank test. Differences between categorical variables were analysed using Fisher’s exact test. Correlations between cfDNA and DAS28ESR were determined using Spearman’s rank correlation coefficients. Differences were considered statistically significant at P < .05.
Results
Characteristics of patients with RA
Patient characteristics of the TCZ treatment group and TNF-I are listed in Table 1. Disease duration was significantly longer in the TCZ-treated group than in the TNF-I group. The DAS28ESR markers of disease activity were not different between the groups (median [IQR]: TCZ 5.19 [4.3–6.4] and TNF-I 4.91 [3.8–5.8]). However, C-reactive protein and the ESR were significantly higher in the TCZ-treated group. A total of 29 (37.7%) patients in the TCZ group and 38 (64.4%) in the TNF-I group had no history of using bDMARDs (P < 0.01).
Patient characteristics of the TCZ- and TNF-I therapy groups
| TCZ (n=77) | TNF-I (n=59) | P value | |
|---|---|---|---|
| Age | 57 [48–67] | 63 [44–72] | 0.1 |
| Sex (male, female) | (18, 59) | (10, 49) | 0.39 |
| Disease duration (years) | 8 [3.8–11.3] | 4 [1.8–10.5] | 0.08 |
| Steinbrocker Stage (I/II/III/IV) | 13, 21, 19, 24 | 11, 20, 10, 18 | 0.69 |
| Disease characteristics | |||
| Positive for RF - no (%) | 67 (87.0%) | 50 (84.8%) | 0.59 |
| Positive for ACPA - no (%) | 66 (85.7%) | 45 (76.3%) | 0.16 |
| Swollen joint count | 4 [2–9] | 4 [1–8] | 0.4 |
| Tender joint count | 4 [1–10] | 4 [2–6] | 0.81 |
| Patients’ global assessment (mm) | 57 [30–73] | 58 [33.5–75] | 0.88 |
| CRP (mg/l) | 19 [6.2–37] | 12.4 [1.5–30] | 0.047 |
| ESR (mm/h) | 58 [27–89] | 36 [15.8–61.5] | <0.01 |
| MMP3 (ng/ml) | 221 [120–421] | 167.2 [102.8–287] | 0.11 |
| DAS28ESR | 5.19 [4.3–6.4] | 4.91 [3.8–5.8] | 0.11 |
| cfDNA (ng/ml) | 29.5 [14.8–44] | 26.3 [19.2–35] | 0.63 |
| Medication | |||
| MTX (mg/week) | 8 [6–10.5] | 10 [8–12] | 0.053 |
| MTX use at the baseline - no (%) | 50 (64.9%) | 46 (77.9%) | 0.12 |
| GC (oral prednisolone mg/day) | 4 [0–5.5] | 2.5 [0–5] | 0.29 |
| GC use at the baseline - no (%) | 50 (64.9%) | 39 (66.1%) | 1 |
| Previous bDMARDs or JAK-I - no (%) | |||
| 0 | 29 (37.7%) | 38 (64.4%) | <0.01 |
| 1 | 37 (48.0%) | 13 (22.0%) | |
| ≥2 | 11 (14.3%) | 8(13.6%) |
Values are presented as the median [interquartile range] or the number of patients (n).
TCZ, tocilizumab; TNF-I, tumor necrosis factor inhibitor; cfDNA, cell-free DNA; GC, glucocorticoid; bDMARDs, biological disease-modifying antirheumatic drugs; JAK-I, Janus kinase inhibitor
TCZ suppresses cf-nDNA levels
DAS28ESR significantly improved in both biological groups at week 12 (median [IQR]: TCZ 2.76 [1.74–3.71] and TNF-I 3.28 [2.55–3.67], respectively). However, plasma cf-nDNA levels tended to decrease in the TCZ-treated groups at week 4 (P = 0.08) and significantly decreased at week 12 (p < 0.001), but not with TNF-I (Figure 1A, 1B). cf-nDNA levels did not change at week 12 compared to baseline levels for all TNF-I drugs (Supplementary Figure S1A–D), and there was no difference in cf-nDNA levels between the remission and active disease groups among patients treated with TCZ and TNF-I.
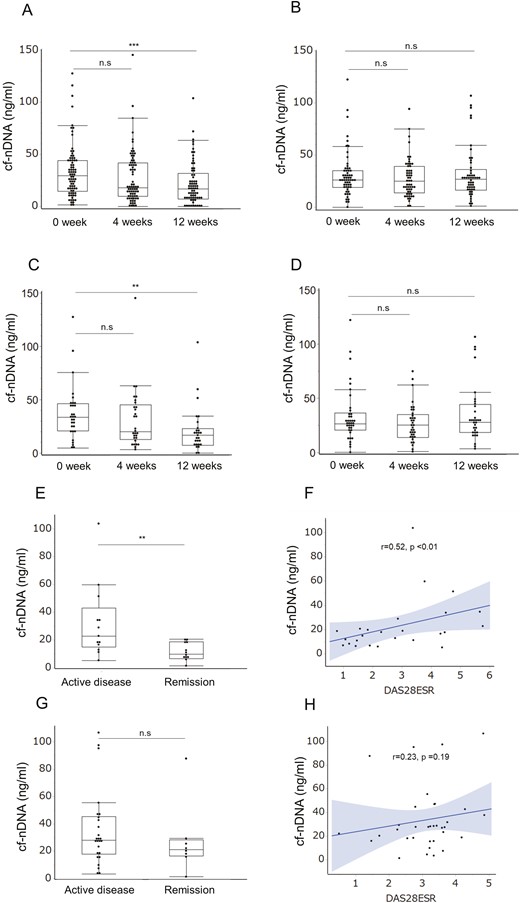
Plasma concentration of cf-nDNA in RA treated with tocilizumab or TNF-I. Time course of plasma cf-nDNA treated with tocilizumab (TCZ) (A) and TNF-I (B). qPCR for cf-nDNA concentration using primers against 115-bp ALU repeats. ***P < 0.001; n.s.: not significant (Mann–Whitney U test). Time course of plasma cf-nDNA treated in biological treatment-naïve (bio-naïve) patients with TCZ (C) and TNF-I (D). **P < 0.01; n.s.: not significant (Mann–Whitney U test). (E, G) Plasma cf-nDNA concentration in bio-naïve patients (remission or active disease) at week 12 treated with TCZ (C) or TNF-I (E). **P < 0.01; n.s.: not significant (Mann–Whitney U test). (F, H) cf-nDNA and DAS28ESR correlations at week 12 in bio-naïve patients treated with TCZ (D) or TNF-I (F). Straight line: regression line, grey area: 95% confidence interval, Spearman’s rank correlation coefficient
cf-nDNA levels are associated with DAS28ESR in biological treatment-naïve patients with TCZ
cf-nDNA levels significantly decreased with TCZ therapy but not with TNF-I. These results indicate that cf-nDNA levels may be influenced by the type of bDMARD treatment. Therefore, biological treatment-naïve patients were evaluated to understand the association between cf-nDNA and therapeutic responses to TCZ and TNF-I. The patient characteristics are presented in Table 2. The disease duration was significantly longer in the TCZ-treated group than in the TNF-I group, whereas the disease activity did not differ. Plasma cf-nDNA levels decrease in the biological treatment-naïve patients with TCZ at week 12 (p < 0.01), but not with TNF-I (Figure 1C, D). In addition, cf-nDNA levels in TCZ-treated group were significantly lower in patients with DAS28ESR remission than those with active disease (median [IQR]: 11.1 ng/ml [6.9–18.9] and 22.9 ng/ml [14.9–43.1], p < 0.05, respectively) at week 12 (Figure 1E) and correlated with the DAS28ESR (r = 0.52, p < 0.01) (Figure 1F). Meanwhile, there was no difference between patients in remission and those with active disease among biological treatment-naïve patients treated with TNF-I (median [IQR]: 21.2 ng/ml [16.5–28.4] and 28 ng/ml [17.8–45.3], p = 0.26, respectively) (Figure 1G), with no association with DAS28ESR (r = 0.23, p = 0.19) (Figure 1H).
Biological treatment-naïve patient characteristics of the TCZ- and TNF-I therapy groups
| TCZ (n = 29) | TNF-I (n=38) | P value | |
|---|---|---|---|
| Age | 62 [53–69] | 64 [49.8–71.3] | 0.46 |
| Sex (male, female) | 6, 23 | 7, 31 | 1 |
| Disease duration (years) | 9 [2–10] | 3 [1–6] | 0.047 |
| Steinbrocker stage (I/II/III/IV) | 5, 4, 8, 12 | 10, 11, 5,12 | 0.24 |
| Disease characteristics | |||
| Positive for RF— no (%) | 26 (90%) | 31 (81.6%) | 0.49 |
| Positive for ACPA—no (%) | 23 (85.2%) | 28 (73.7%) | 0.36 |
| Swollen joint count | 4 [2.5–11] | 4 [2–8.5] | 0.51 |
| Tender joint count | 4 [2–12.5] | 4 [2–6] | 0.29 |
| Patients’ global assessment (mm) | 65 [33.5–73] | 58.5 [31.5–78.5] | 0.91 |
| CRP (mg/l) | 19 [8.5–43] | 14.5 [4.5–33.5] | 0.36 |
| ESR (mm/h) | 56 [36.5–89.5] | 41 [17–69.3] | 0.058 |
| MMP3 (ng/ml) | 221 [148–444] | 174.2 [104.8–282.8] | 0.11 |
| DAS28ESR | 5.81 [4.54–6.57] | 5.07 [4.09–6.05] | 0.11 |
| cfDNA (ng/ml) | 34.5 [22.5–46.5] | 26.4 [20.8–36.7] | 0.18 |
| Medication | |||
| MTX (mg/week) | 6 [0–8] | 10 [8–12] | <0.01 |
| MTX use at the baseline - no (%) | 19 (65.5%) | 29 (86.8%) | 0.045 |
| GC (oral prednisolone mg/day) | 4 [0–7.5] | 2.3 [0–5] | 0.14 |
| GC use at the baseline - no (%) | 20 [68.9%] | 21 [55.2%] | 0.25 |
Values are presented as the median [interquartile range] or the number of patients (n).
TCZ, tocilizumab; TNF-I, tumor necrosis factor inhibitor; cfDNA, cell-free DNA; GC, glucocorticoid.
Secretion of cf-nDNA from synovial cells
Elevated levels of cf-nDNA have been detected in synovial fluid from patients with RA [17], which is presumed to be one of the sources of cf-nDNA in patients with RA. We observed that cf-nDNA levels in the supernatants of synovial cells cultured at various densities increased until 70% confluency and decreased subsequently (Figure 2A). Moreover, cellular viabilities increased along with cell density (Figure 2B), whereas those values gradually weakened after 70% confluency by cell contact. Microscopic phenotypes of synovial cells at various densities are shown in Figure 2C. Cyclin D protein levels (a marker for G1 to S transition expressing the active phase of cell division) peaked at 70% confluency and decreased subsequently (Figure 2D). These results suggest that cf-nDNA released into the culture supernatant correlates with synovial cell proliferation.
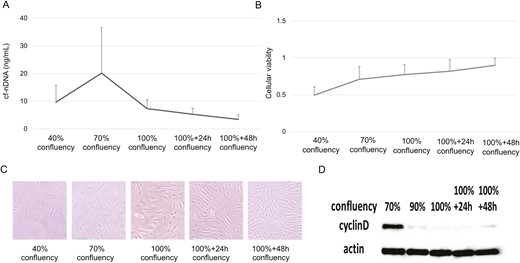
cf-nDNA levels, cellular viability, and cyclin D expression in fibroblast-like synovial cells. (A) cf-nDNA levels at various confluencies. Results were expressed as the mean ± SEM; n = 3. (B) Cellular viability at various confluencies. Results were expressed as the mean ± SEM; n = 3. (C) Fibroblast-like synovial cells at various confluencies. (D) Cyclin D protein levels
Modulation of cf-nDNA production by bDMARDs
The influence of cf-nDNA levels in synovial cells and synovial cell viability treated with TCZ and TNF-I (ETN) following stimulation with TNFα or IL6/IL6R was investigated in vitro since plasma cf-nDNA levels in patients with RA were reduced by TCZ but not TNF-I. cf-nDNA levels were significantly suppressed by TCZ treatment (Figure 3A), while ETN treatment caused no change (Figure 3B). Notably, cellular viability was not significantly different between the non-treated and bDMARD-treated groups.
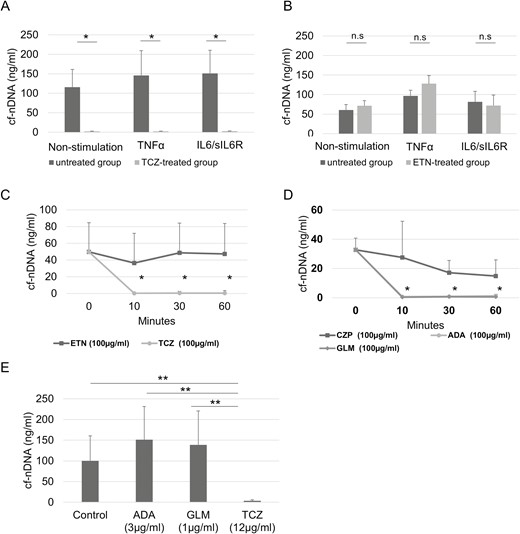
Influence of biologic DMARDs on cf-nDNA levels. cf-nDNA released from fibroblast-like synoviocytes (FLS) treated with or without tocilizumab (TCZ) (A) or etanercept (ETN) (B), and with TNF-α or IL-6/IL6R. Results are mean ± SEM (Student’s t-test), n = 5; *P < 0.05; ns: not significant. cf-nDNA levels in plasma of RA patients incubated with (C) TCZ or ETN, or (D) adalimumab (ADA), certolizumab (CZP), or golimumab (GLM). (E) cf-nDNA levels in plasma of RA patients incubated with TCZ, ADA, or GLM after 60 min. Results are mean ± SEM (Wilcoxon signed-rank test); n = 7; *P < 0.05, **P < 0.01; ns: not significant
Effect of TCZ and ETN on cell cycle regulation
In the untreated RA synovial cells, the protein levels of cyclins D and E peaked at 16 h and 24 h, respectively, and decreased subsequently. RA synovial cells treated with TCZ and ETN had decreased cyclin D protein expression compared with untreated RA synovial cells, and cyclin E protein expression peaked at 32 h (Supplementary Figure S2). This indicates that TCZ and ETN may inhibit the cell cycle in a similar manner, suggesting that the ability of TCZ to suppress cf-nDNA production is unrelated to the cell cycle.
TCZ directly reduces cf-nDNA concentration
The concentration of cf-nDNA incubated with TCZ was significantly lower than that incubated with ETN (Figure 3C). The concentration of cf-nDNA was also evaluated following incubation with ADA, GLM, and CZP, since human immunoglobulin G has DNase activity [30, 31]. ADA and GLM decreased DNA levels to a similar level as that of TCZ, but CZP did not (Figure 3D). Clinical significance was assessed by evaluating the effects of TCZ, ADA, and GLM on cf-nDNA at the blood trough level. The concentration of cf-nDNA incubated with TCZ was significantly lower than that incubated with ADA and GLM (Figure 3E).
cfDNA from RA patients activates NF-κB via TLR9 pathway in vitro
Hypomethylated CpG -rich molecules obtained from RA-SF via PCR with specific primers has been shown to stimulate THP-1 cells to express TNF-α [21]; this suggests that cfDNA from RA might be recognized by DNA sensors. NF-kB is recognized as one of the main inflammatory pathways in RA and is associated with bone erosion [32]. We demonstrated that HEK-293 Blue hTLR9 cells secreted SEAP upon stimulation with cfDNA from RA sera in vitro (Figure 4A). This demonstrates that cfDNA is recognized by TLR9 and activates NF-κB signalling. In addition, SEAP levels strongly correlated with stimulated cf-nDNA concentration (Figure 4B) and were suppressed by TCZ (Figure 4C).
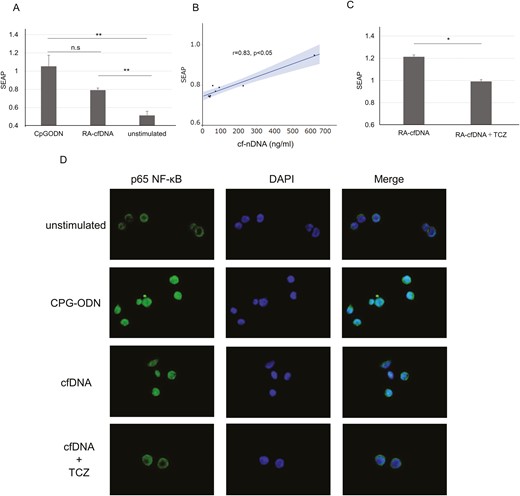
Tocilizumab inhibits cfDNA-induced TLR-9-NF-κB pathway activation. (A) Secreted embryonic alkaline phosphatase (SEAP) released from HEK-293 Blue hTLR9 cells stimulated with CpG-ODN or cfDNA, n = 8. (B) Correlation between SEAP levels and cf-nDNA concentration. Straight line: regression line, grey area: 95% confidence interval, Spearman’s rank correlation coefficient. (C) SEAP stimulated with cfDNA, with or without tocilizumab (TCZ). Results are the ratio of cfDNA-stimulated SEAP to unstimulated SEAP, n = 5. (B, C) Mean ± SEM.(Student’s t-test); *P < 0.05. ** P < 0.01, ***P < 0.001; n.s.: not significant. (D) Immunofluorescence staining of HEK-293 Blue hTLR9 cells stimulated with CpG-ODN or cfDNA, with or without TCZ for 6 h
TCZ inhibits cfDNA-induced nuclear translocation of NF-κB
Nuclear translocation of NF-κB was observed in cells stimulated with CpG-ODN or cfDNA, whereas it was retained in the cytoplasm under unstimulated conditions (Figure 4D). TCZ addition suppressed nuclear translocation, indicating that TCZ suppresses NF-κB activity by decreasing cfDNA levels.
Secretion of cf-mtDNA from synovial cells and influence of bDMARDs on cf-mtDNA levels
cf-mtDNA was reported to activate TLR9 pathway [33] similar to hypomethylated CpG rich motifs. Mitochondria, which exist in most cells, plays crucial roles in the regulation of the pathological properties of the synoviocytes [34]. Therefore, we also evaluate the secretion of cf-mtDNA from synovial cells and the effects of biologics on cf-mtDNA. cf-mtDNA levels in the supernatants of synovial cells cultured at various densities increased until 70% confluency and decreased subsequently, similar to cf-nDNA (Figure 5A). TCZ (100ng/ml), ADA (100ng/ml) and GLM (100ng/ml) reduced cf-mtDNA concentration, but not CZP (100ng/ml) and ETN (100ng/ml) (Figure 5B). Evaluating the effect of TCZ, ADA and GLM with the blood trough level, the concentration of cf-mtDNA incubated with TCZ was significantly lower than that incubated with ADA and GLM (Figure 5).
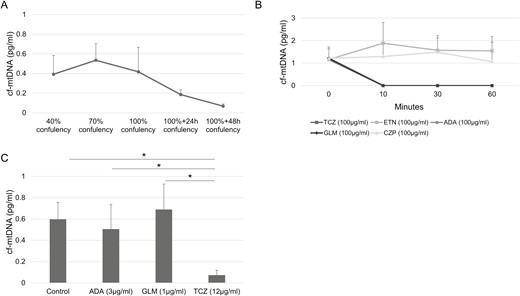
Secretion of cf-mtDNA and influence of biologic DMARDs on cf-mtDNA levels. (A) cf-mtDNA levels secreted from synovial cells at various confluencies. Results were expressed as the mean ± SEM.; n = 3. (B) cf-mtDNA levels in plasma of RA patients incubated with tocilizumab (TCZ), etanercept (ETN), adalimumab (ADA), certolizumab (CZP), or golimumab (GLM). (C) cf-mtDNA levels in plasma of RA patients incubated with TCZ, ADA, or GLM after 60 min. (B, C) Results are mean ± SEM (Wilcoxon signed-rank test); n = 5; *P < 0.05; n.s.: not significant
Discussion
cfDNA from various origin has been reported to be associated with disease activity in RA [15]. However, its association with bDMARDs therapy has not been clarified. Furthermore, cfDNA has been shown to induce inflammation and arthritis when recognized by DNA sensors [35, 36], raising the possibility that it plays a crucial role in the pathogenesis of RA. However, although cfDNA is known to be associated with inflammatory pathology, its role in RA remains unclear. In this study, we demonstrate for the first time that TCZ suppresses cf-nDNA production in patients with RA, and that cf-nDNA or cf-mtDNA from RA patients activates NF-κB via the TLR9 signalling pathway and is inhibited by TCZ in vitro.
According to a previous report that evaluated changes in cfDNA during bDMARDs therapy in patients with RA, cfDNA levels were markedly changed 1 h after infliximab infusion in 7 of 10 patients with RA [20]. Our previous study reported that good responder patients with RA had elevated cf-nDNA plasma levels at week 4 or 8 following bDMARD treatment with TNF-I, TCZ, and abatacept. However, the levels decreased at week 12 and continued to decline [17]. In contrast, treatment of 32 patients with RA (the types of bDMARDs were not indicated) suggested that DAS28 and total cfDNA concentration decreased after three and six months, respectively [18]. This divergence in results may have occurred because of the small study size, timing of each cfDNA evaluation, patient background, and type of therapeutic agent.
In this study, we distinguished and validated the pharmacological effects of TCZ and TNF-I. cf-nDNA was only associated with disease activity in biological treatment-naïve patients treated with TCZ. TCZ reduced CRP levels irrespective of the treatment effect. The use of cf-nDNA is considered highly valuable due to its potential to replace CRP observations as a marker of disease progression in routine medical care.
In this study, we demonstrated that synovial cells secrete cf-nDNA and cf-mtDNA during cell division in vitro. RA-cfDNA may originate from synovial cells or inflammatory cells such as neutrophils [17, 37]. Each cell type has a unique DNA methylation pattern [38, 39], and the DNA methylation pattern in RA-SF is reportedly similar to that in synovial cells [40], suggesting that synovial cells are one of the origins of cfDNA. cfDNA release in RA was associated with tumour-like robust proliferation of rheumatoid synovium similar to that of cancer cells, which spontaneously release DNA fragments into circulation [41, 42]. Human IgG possesses DNase activity [31, 32], and we observed that ADA and GLM (containing IgG portions) reduce cf-nDNA and cf-mtDNA in vitro. In contrast, CZP has no DNase activity because it lacks the Fc portion of IgG and is pegylated. Moreover, cf-nDNA and cf-mtDNA levels from RA plasma were suppressed by TCZ but not by ETN. However, TCZ reduced cf-nDNA and cf-mtDNA significantly more than ADA and GLM at clinically relevant concentrations. This result was consistent with the fact that cf-nDNA levels were reduced only in TCZ-treated patients, and we propose a unique mechanism by which TCZ decreases cfDNA, including nDNA and mtDNA, directly.
A marked decrease in cfDNA can suppress inflammation via DNA sensors, such as TLR9, absent in melanoma-2 (AIM-2)-like receptors, and cyclic GMP-AMP synthase (cGAS). Various studies have revealed that cfDNA induces inflammation [43] through the association between self-DNA activated B cells and TLR9 in RA [44], mtDNA and TLR9 [45] or cytosolic DNA and the AIM2 inflammasome, also expressed in RA-FLS [46], and in psoriatic keratinocytes [47]. Furthermore, cytosolic dsDNA promotes inflammatory responses via the cGAS/stimulator of interferon genes (STING) pathway in RA-FLS [48]. Intravenous injection of a cfDNA scavenger reduces arthritic symptoms, including bone and cartilage damage, in a CpG-induced mouse model and a collagen-induced arthritis rat model [49]. These results suggest the possibility of a novel strategy involving the inhibition of DNA sensors for the treatment of arthritis.
This is the first study to demonstrate that cfDNA extracted from RA patients activates NF-κB via the TLR9 pathway, and TCZ regulates the TLR9-NF-κB pathway by suppressing cfDNA. The association between cfDNA in patients with RA and other DNA sensors, such as CGAS and AIM2, should be further investigated. The limitation of this study was that it lacked a comprehensive evaluation of various TNF-Is. Notably, further evaluation of a larger cohort of patients treated with ADA and GLM (possessing DNase activity) is required. ALU-PCR mainly detected cf-nDNA, but not include other sources such as mtDNA, modified DNA or microbial cfDNA. Thus, total DNA should also be investigated in the future. In addition, although synovial cells secreted mtDNA and TCZ reduced mtDNA levels in vitro, it is also necessary to investigate whether mtDNA levels are similarly reduced in RA patients treated with TCZ. Nonetheless, our results provide the first evidence that TCZ reduces cfDNA levels in patients with RA and RA-FLS. RA-cfDNA is recognized by TLR-9; hence, TCZ may control inflammation in RA by suppressing TLR-9-dependent NF-κB signalling. Further investigations are required to understand the pathophysiological roles of cfDNA in RA.
Abbreviations
- ADA
adalimumab; AIM-2, absent in melanoma-2
- bDMARDs
biological disease-modifying antirheumatic drugs; cfDNA, cell free DNA
- cf-nDNA
cfDNA derived from nuclear; cf-mtDNA, cfDNA derived from mitochondria
- cGAS
cyclic guanosine monophosphate-adenosine monophosphate synthase
- CZP
certolizumab pegol
- ETN
etanercept
- FLSs
fibroblast-like synoviocytes
- GLM
golimumab; hTLR9, human toll-like receptor 9; IL-6, interleukin-6; NF-κB, nuclear factor-kappa B
- SEAP
secreted embryonic alkaline phosphatase
- SF
synovial fluid
- TCZ
tocilizumab
- TNF-I
tumor necrosis factor inhibitor
- RA
rheumatoid arthritis.
Acknowledgments
The authors are grateful to Sachie Kitano for outstanding technical assistance and Naomi Nakatani for outstanding assistance with collecting data. We would like to thank Editage (www.editage.com) for English language editing.
Ethics approval
The study involving human participants was approved by the Institutional Ethics Committees of the Hyogo Medical University (approval no. 0371 and 4241) and Kobe University (approval no. 579-1). Written informed consent was obtained from all the patients
Funding
This research received no external funding.
Conflicts of interest
KM received grants from Asahikasei Pharma Co. and Chugai Pharma Co., and AH from Asahikasei Pharma Co., Chugai Pharma Co., Eli Lilly Japan K.K., and AbbVie G.K. during this study. All other authors have nothing to disclose.
Data availability
The raw data that support the conclusions of this study are available from the corresponding author upon request.
Author contributions
TH designed and performed the experiments and wrote the manuscript. KY, NH, and KK performed in vitro experiments. YY, TY, KT, and YT provided the clinical samples and edited the manuscript. KM contributed scientific advice and edited the manuscript. AH supervised the study and edited the manuscript.
