


Abstract
The pathogenesis of immune tolerance disruption is not fully understood. Galectin-9 (Gal9) has immune regulatory functions. The objective of the present study is to assess the role of Gal9 in maintaining immune tolerance. Blood and intestinal biopsies were taken from patients with food allergy (FA). The status of tolerogenic dendritic cells (tDC) and type 1 regulatory T cells (Tr1 cells) in the samples was evaluated and used as representative parameters of immune tolerance. An FA mouse model was established to assess the role of Gal9 in maintaining immune tolerance. We found that peripheral CD11c+ CD5+ CD1d+ tDC frequency was significantly lower in FA patients as compared to health control (HC) subjects. There was no significant change in CD11c+ DC frequency between the FA group and the HC group. The expression of IL-10 in peripheral tDCs was lower in the FA group than that in the HC group. A positive correlation was detected between the serum levels of IL-10 and Gal9. The expression of Gal9 was observed in intestinal biopsies, which was positively correlated with the serum levels of Gal9 as well as serum IL-10 levels. Peripheral Tr1 cells had lower frequencies in the FA group than in the non-FA (Con) group. tDCs demonstrated the ability to generate Tr1 cells, which was weaker in the FA group as compared with the Con group. Exposure of FA tDCs to Gal9 in culture restored the ability to generate Tr1 cells. In summary, the lower frequency of tDC and Tr1 cell of FA patients was associated with the levels of Gal9. The presence of Gal9 restored the capacity of tDC to generate Tr1 cells.

Introduction
Compromised immune tolerance has been identified in individuals with allergic conditions, such as food allergy (FA) and asthma [1–3]. The immune tolerant system consists of immune regulatory cells, of which immune regulatory T cells (Treg) and regulatory B cells (Breg) are the main fractions. The dysfunctional status of Tregs or Bregs has been recognized in many immune disorders [3, 4]. However, the mechanism behind the malfunction of immune regulation is not clear.
IL-10 is the key cytokine to develop and sustain immune tolerance [3, 5, 6]. DCs that produce IL-10 have the ability to regulate their immune system and can induce type 1 regulatory T cells (Tr1 cells) [7]. Tr1 cells also produce IL-10. Tr1 cell-derived IL-10 inhibits activities in other immune cells [8]. This limits the immune response within a suitable range to prevent self-harm [9]. Hence, a reduction in Tr1 cell count or IL-10 production may cause immune disorders [8]. Thus, production of tolerogenic DCs (tDCs) and Tr1 cells is expected to restore immune homeostasis in the body and mitigate existing allergic diseases [8, 10]. However, the efficiency of Tr1 cell generation needs improvement.
Galectin-9 (Gal9, in short) is reported to have immune-regulating capacity [11]. Epithelial cells can produce Gal9 [12]. TIM3 (T-cell immunoglobulin domain molecule-3) is the ligand of Gal9 [12]. The ligation of Gal9 and TIM3 can induce Th1 cell apoptosis [12]. Recent reports indicate that CD22 also mediates the effects of Gal9 on regulating B cell activities [13]. In other words, TIM3 or CD22 can mediate the effects of Gal9 on activating target cells. Whether Gal9 maintains IL-10 expression in Tr1 cells has not been examined.
In this study, we found that the frequency of tDC and Tr1 cells was lower in the peripheral blood system of FA patients. A lower expression of IL-10 and Gal9 was observed in the FA patient’s bowel biopsies. The presence of Gal9 favored the expression of IL-10 in tDCs, and promoted the generation of Tr1 cell.
Materials and methods
FA patients
Patients suffering from AF were recruited for this study in our outpatient clinics. The diagnosis of FA was carried out by our doctors following the routine procedures that can be found elsewhere. FA patients had FA history, positive skin prick test, and positive serum-specific IgE (sIgE). Non-FA control (Con) subjects were enrolled at our hospital. Con subjects had no history of AF, other detectable disorders, negative skin prick test (SPT), and negative serum sIgE. Gastrointestinal endoscopy was performed for all subjects in this study to eliminate the potential for ulcers or tumors in the gastrointestinal tract. The procedures were carried out by experienced physicians who followed our routine procedures that are also located elsewhere [14]. Two pieces of biopsies were taken in the jejunum of each subject. The study protocol was approved by our hospital’s Human Ethics Committee (approval no.: HEC2021009). Each person signed informed written consent. The demographic data of human subjects are presented in Table 1. In addition, none of the human subjects suffered from inflammatory bowel disease.
Demographic and baseline data of FA patients
| Items | FA | Con |
|---|---|---|
| Number of subjects | 30 | 30 |
| Age (yr) (median) | 28.8 ± 4.3 | 27.5 ± 4.5 |
| Male | 15 (50) | 15 (50) |
| Female | 15 (50) | 15 (50) |
| SPT (diameter)* | ||
| <3 mm | 0 | |
| 10–15 mm | 21 (70) | |
| >15 mm | 9 (30) | |
| Serum sIgE# | ||
| 4.5–50 KU/L | 9(30) | |
| 50–100 KU/L | 18 (60) | |
| >100 KU/L | 3 (10) | |
| Skin prick test (number of patient and %) | ||
| Milk | 3 (10) | 0 |
| Egg white | 6 (20) | 0 |
| Egg yolk | 3 (10) | 0 |
| Wheat | 4 (13.3) | 0 |
| Soybean | 8 (26.7) | 0 |
| Carrot | 6 (20) | 0 |
| Potato | 3 (10) | 0 |
| Peanut | 8 (26.7) | 0 |
Cow’s milk, egg white, egg yolk, wheat flour, soybean, carrot, potato, and peanut.
*Positive criteria: skin prick test positive was considered when a wheal diameter greater than 3 mm of the negative saline control.
#Positive criterion: >0.35 kU/L.
Abbreviations: FA: food allergy; Con: non-FA controls.
Generation of Tr1 cells by tDC
tDCs and CD4+ CD25¯ T cells were purified from PBMCs. A co-culture model was established with tDCs and CD4+ CD25¯ T cells at a ratio of 1:5 in the presence of PMA (50 ng/ml). Four days later, the cells were analyzed by FCM.
Statistics
The difference between the data from two groups were determined by the Student’s t-test or the Mann–Whitney test. The ANOVA followed by the Dunnett test or the Bonferroni test was carried out for data from more than two groups. P < 0.05 was defined as a significant criterion.
Results
Lower frequency of Tr1 cell is associated with FA parameters
As shown in Table 1, a total of 30 FA patients were enrolled in the present study. The FA history of them was 1.1 to 8.8 years (median = 3.92 years). For the concerns of ulcers or tumors in the gastrointestinal tract, upper digestive tract endoscopy was carried out for these patients. No ulcers or tumors were observed during the examination. No one had symptoms or signs of inflammatory bowel disease.
Since regulatory T cells play a crucial role in immune tolerance, we first evaluated the frequency of type 1 regulatory T cells (Tr1 cells) in blood samples. As demonstrated by the flow cytometry (FCM) results, the Tr1 cell frequency was lower in the FA group than in the non-FA control (Con) group (Fig. 1A–D). A negative correlation was detected between the frequency of Tr1 cells and concentrations of sIgE or Th2 cytokines in the serum (Fig. 1E–F). The results point to a decrease in Tr1 cells in patients with FA. This finding may implicate the pathogenesis of FA.
![Peripheral Tr1 cell frequency is negatively correlated with serum sIgE and Th2 cytokines. Blood samples were collected from FA patients (n = 30) and non-FA subjects (controls; Con; n = 30). Serum and PBMCs were prepared with the blood samples. A, live cells (non-PI+ cells) were gated to be analyzed further. B-C, FCM plots show the gating strategy and Tr1 cell counts. D, boxplots show median (IQR) of Tr1 cell counts of 30 samples per group. E, boxplots show the serum levels of sIgE and Th2 cytokines [median (IQR)]. F, scatter dot plots show negative correlation between peripheral Tr1 cell frequency and serum levels of sIgE, or Th2 cytokines. Statistics: Mann Whitney test for boxplots. Spearman correlation coefficient test for scatter dot plots. Abbreviations: PI: propidium iodide. Tr1 cell: type 1 regulatory T cell. sIgE: antigen-specific IgE. FA: food allergy. PBMC: peripheral blood mononuclear cell. FCM: flow cytometry](https://oup.silverchair-cdn.com/oup/backfile/Content_public/Journal/cei/213/2/10.1093_cei_uxad062/2/m_uxad062_fig1.jpeg?Expires=1747915753&Signature=IHbGHStJAWEh4KKYcFSIc8srrrf-Zzdw6bbJdS4~4se2xt6alr2lYg150t3SxZi3Q8pO6PpEeo46cQHeZox8DFSNNjyXnQwyZn5P3sbiUr5dIw4rt3UouhQYzj25ex8PliuQctw6qe--vy66w-EYCWk2TH3vDz9h4KmFPe~lZIhEP4y6yav7XQCKLexhrjsOiZMdu9BgxE7ZZ~dbKZcgYEaoAl1AM-apy2kNfQH9Ib2kQxg4ff2-di94nWGd1MXsqyKlxT5Tn71nCOcX-2BU-Gnk7wuNRHadwRpuKguhQPf7PDPvBoa0CIno6Qq1lq03aEzA-cM~t9R6Z0zFHFUQhQ__&Key-Pair-Id=APKAIE5G5CRDK6RD3PGA)
Peripheral Tr1 cell frequency is negatively correlated with serum sIgE and Th2 cytokines. Blood samples were collected from FA patients (n = 30) and non-FA subjects (controls; Con; n = 30). Serum and PBMCs were prepared with the blood samples. A, live cells (non-PI+ cells) were gated to be analyzed further. B-C, FCM plots show the gating strategy and Tr1 cell counts. D, boxplots show median (IQR) of Tr1 cell counts of 30 samples per group. E, boxplots show the serum levels of sIgE and Th2 cytokines [median (IQR)]. F, scatter dot plots show negative correlation between peripheral Tr1 cell frequency and serum levels of sIgE, or Th2 cytokines. Statistics: Mann Whitney test for boxplots. Spearman correlation coefficient test for scatter dot plots. Abbreviations: PI: propidium iodide. Tr1 cell: type 1 regulatory T cell. sIgE: antigen-specific IgE. FA: food allergy. PBMC: peripheral blood mononuclear cell. FCM: flow cytometry
Tr1 cells in FA patients are positively correlated with tDCs
We then assessed the frequency of CD11c+ DC in PBMCs. The results showed that there were no significant differences in peripheral DC counts between the FA group and the Con group (Fig. 2A–C). Further analysis showed that the frequency of CD11c+ CD5+ CD1d+ DC was lower in the FA group than that in the Con group (Fig. 2D–E). Since the CD11c+ CD5+ CD1d+ DCs also expressed IL-10 (Fig. 2F–G), this fraction of DCs can be the tolerogenic DC (tDC). The expression of IL-10 was also lower in tDCs of the FA group than that in the Con group (Fig. 2F–G). A positive correlation was detected between the peripheral frequency of Tr1 cells and the IL-10 expression in tDCs as well as the peripheral DC counts (Fig. 2H). The results suggest that the lower frequency of Tr1 cells may be attributed to the lower expression of IL-10 in tDCs.
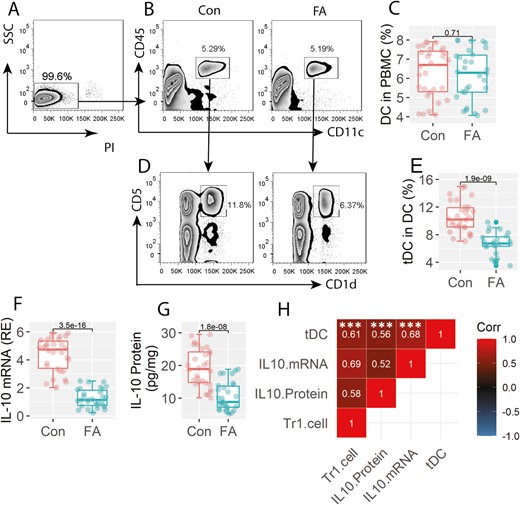
Assessment of peripheral tDC and Tr1 cells. PBMCs were prepared with the blood samples, and analyzed by FCM. A, live cells (non-PI+ cells) were gated to be further analyzed. B, gated FCM plots show the DC counts. C, boxplots show median (IQR) of DC counts from 30 samples per group. D, gated FCM plots show tDC counts. E, boxplots show median (IQR) of tDC counts from 30 samples per group. F-G, tDCs were purified from PBMCs. Boxplots show median (IQR) of IL-10 mRNA levels and IL-10 protein levels in tDC. H, positive correlation between Tr1 cells (data are presented in Fig. 1) and IL-10 mRNA or IL-10 protein levels in tDCs, or peripheral tDC counts. ***P < 0.0001. Statistics: Mann–Whitney test for boxplots. Spearman correlation coefficient test for correlation assay. The correlation coefficient was indicated in each square of panel H. Abbreviations: Tr1 cell: type 1 regulatory T cell. FA:Food allergy. Con: non-FA control subjects. PBMC: peripheral blood mononuclear cell. DC: dendritic cell. FCM: flow cytometry. tDC: tolerogenic DC
A lower frequency of Tr1 cells is associated with the Gal9 expression in intestinal tissues
Published data suggest that Gal9 participates the immune regulatory activities [11]. As such, we evaluated Gal9 levels in intestinal biopsies. The results showed that both Gal9 mRNA and Gal9 protein were significantly lower in the FA group than in the Con group (Fig. 3A–C). A positive correlation was detected between the frequency of peripheral tDCs and the expression of Gal9 in intestinal biopsies (Fig. 3D). On the other hand, we collected 6 surgically removed jejunal tissues (from pancreatic cancer-affected jejunum; proved by a pathologist; among which 3 patients had FA). Single cells were prepared with the tissues, and analyzed by FCM. We observed Gal9+ epithelial cells in the samples that were much fewer in the FA group (Fig. 3E, F). The findings indicate that the intestinal tissues produce Gal9, which may contribute to the generation of Tr1 cells.
![Assessment of Gal9 expression. RNA and protein were extracted from intestinal biopsies, and analyzed by RT-qPCR and Western blotting. A, Gal9 mRNA levels [median (IQR)]. B, Gal9 protein blots (protein samples were pooled per group. The data are from one experiment that represents 3 independent experiments). C, Gal9 protein blot density [median (IQR)]. D, positive correlation between Gal9 mRNA levels in biopsy samples and tDC frequency. E, F, jejunal tissues were obtained from surgically removed tissues (the un-affected tissues). Single cells were prepared, and analyzed by FCM. Gated plots show Gal9+ epithelial cell counts. Boxplots show median (IQR) of Gal9+ epithelial cell frequency in 3 samples. G, immunohistochemistry images show the staining (in green; the red color is the staining of the nuclei with propidium iodide) of Gal9 in the intestinal mucosa (original magnification: ×200). Statistics: Mann–Whitney test for boxplots. Spearman correlation coefficient test for scatter dot plots. Abbreviations: FA: food allergy. Con: non-FA control subjects. FCM: flow cytometry. tDC: tolerogenic DC. Gal9: galectin-9.](https://oup.silverchair-cdn.com/oup/backfile/Content_public/Journal/cei/213/2/10.1093_cei_uxad062/2/m_uxad062_fig3.jpeg?Expires=1747915753&Signature=caRwmF0-f~ieG0NDO3GvrewAQengNIhvVVif6d24vgGAQBDyISnGbc947LI3HVqUqwRptOb59jndcfRjbzZ4JNJWWd4e7bQvQOv05vTeQDdogkaQ6Lt8NkZV9rEVxP0IokhDmqZrTpZ8EFz4DgNdPeFIWAsZLEnz6aKFsHn9~lhG4mvOMGweHqUcdctrSq92cAme20cutkyIH3Ma98hZvpHanKvLu7NQ4KITpsBLA7KUMVDIY4~Toitl1HO~ucrYwebzfbk42oMHecFDpRTfF~FjFFFX1qGxtC5uOHKye63~g-5vo2-NmeUTRHCKURYOF1n3zvk6QfNnJMQ-LW-g0w__&Key-Pair-Id=APKAIE5G5CRDK6RD3PGA)
Assessment of Gal9 expression. RNA and protein were extracted from intestinal biopsies, and analyzed by RT-qPCR and Western blotting. A, Gal9 mRNA levels [median (IQR)]. B, Gal9 protein blots (protein samples were pooled per group. The data are from one experiment that represents 3 independent experiments). C, Gal9 protein blot density [median (IQR)]. D, positive correlation between Gal9 mRNA levels in biopsy samples and tDC frequency. E, F, jejunal tissues were obtained from surgically removed tissues (the un-affected tissues). Single cells were prepared, and analyzed by FCM. Gated plots show Gal9+ epithelial cell counts. Boxplots show median (IQR) of Gal9+ epithelial cell frequency in 3 samples. G, immunohistochemistry images show the staining (in green; the red color is the staining of the nuclei with propidium iodide) of Gal9 in the intestinal mucosa (original magnification: ×200). Statistics: Mann–Whitney test for boxplots. Spearman correlation coefficient test for scatter dot plots. Abbreviations: FA: food allergy. Con: non-FA control subjects. FCM: flow cytometry. tDC: tolerogenic DC. Gal9: galectin-9.
CD22 Mediates the effects of Gal9 on inducing the expression of IL-10 in DCs
The data reported above imply that Gal9 may be a key driver of IL-10 expression in DCs. To verify this, DCs were isolated from PBMCs from healthy subjects. Recombinant Gal9 was added to culture medium. Two days later, DCs were harvested, and analyzed by RT-qPCR and Western blotting. The results showed that exposure to Gal9 considerably increased the expression of IL-10 in DCs (Fig. 4A-C). It is reported that several molecules, such as TIM3 and CD22, may act as mediators of the effects of Gal9 on the regulation of target cell activities [11, 13]. To determine which molecules are the key factor in the mediation of the effects of Gal9 on inducing the expression of IL-10 in DCs, DCs were treated with RNAi of TIM3 or CD22 (Fig. 4D, E) before exposing to Gal9 in culture. The results showed that the knockdown of CD22, but not TIM3, abolished the expression of IL-10 in DCs (Fig. 4A–C). It was also found that exposure to Gal9 in culture did not induce DC apoptosis (Fig. 4F, G). The results indicate that CD22 mediates the role of Gal9 in the induction of IL-10 expression in DCs.
![Assessment of the role of TIM3 and CD22 in Gal9-induced IL-10 expression in DCs. DCs were purified from PBMCs (from health subjects), and cultured in the presence of Gal9 (7.5 µg/ml) for 2 days. Cells were analyzed by RT-qPCR and Western blotting. A, IL-10 mRNA levels [median (IQR)]. B, IL-10 protein levels (from one experiment that represents 3 independent experiments). C, integrated density [median (IQR)] of IL-10 blots in panel B. D-E, RNAi results of TIM3 (D) and CD22 (E). F-G, DCs, or CD4+ T cells (positive controls) were exposed to saline or Gal9 (7.5 µg/ml) in culture for 48 h, and analyzed by FCM. Gated FCM plots show apoptotic cells. Boxplots show median (IQR) of apoptotic cells from 3 independent experiments. Statistics: ANOVA followed by Bonferroni test. The group labels of panel G are the same as panel F. Abbreviations: RNAi: RNA interference. Gal9: galectin-9. TIM3: T-cell immunoglobulin mucin domain molecule-3. DC: dendritic cell. PBMC: peripheral blood mononuclear cell](https://oup.silverchair-cdn.com/oup/backfile/Content_public/Journal/cei/213/2/10.1093_cei_uxad062/2/m_uxad062_fig4.jpeg?Expires=1747915753&Signature=quL0qePCXjfiRc1EyzfaoZmN-kLDm9UItSJKHqS8HveA14G3~dXDeO35a9LG05K9P3Iu2qy8Ywo2HlHeNZVvLuBpLH5P~2uVcypXE-T8lHJ5vVyeN-LbyMy~S3ESytbzjQMH8845X2eqmX2ai4HFa7rYuWxYLdgwDnPlO67oIOAFg7kLkY1Ca8l05MGaG0CykbJ4BuVG46~XLHycveqwqBGnTMRvNez5RbXxMSIqxRZeF4gg7pZ8t9m0vPbQp-cBkwVUgapnx5RyVOZdN2hDdmO--i5T-ZEU4JlX9Ki97bR~-kj1KvxElmZTssYkwgPoI3tq6oWv1VfehQvlCuyT0Q__&Key-Pair-Id=APKAIE5G5CRDK6RD3PGA)
Assessment of the role of TIM3 and CD22 in Gal9-induced IL-10 expression in DCs. DCs were purified from PBMCs (from health subjects), and cultured in the presence of Gal9 (7.5 µg/ml) for 2 days. Cells were analyzed by RT-qPCR and Western blotting. A, IL-10 mRNA levels [median (IQR)]. B, IL-10 protein levels (from one experiment that represents 3 independent experiments). C, integrated density [median (IQR)] of IL-10 blots in panel B. D-E, RNAi results of TIM3 (D) and CD22 (E). F-G, DCs, or CD4+ T cells (positive controls) were exposed to saline or Gal9 (7.5 µg/ml) in culture for 48 h, and analyzed by FCM. Gated FCM plots show apoptotic cells. Boxplots show median (IQR) of apoptotic cells from 3 independent experiments. Statistics: ANOVA followed by Bonferroni test. The group labels of panel G are the same as panel F. Abbreviations: RNAi: RNA interference. Gal9: galectin-9. TIM3: T-cell immunoglobulin mucin domain molecule-3. DC: dendritic cell. PBMC: peripheral blood mononuclear cell
NF-κB interferes with the expression of IL-10 in DCs of FA patients
As NF-κB involves the induction of IL-10 [15], we inferred that NF-κB might be involved in the Gal9-induced IL-10 expression in DCs. To test this, we measured the phosphorylation status of NF-κB in DCs. We found that the phosphorylated NF-κBp50 (but not NF-κBp65) levels were significantly higher in FA DCs as compared with that of the Con DCs (Fig. 5A, B). Then, DCs were prepared from blood samples collected from Con subjects and FA patients, and cultured with Gal9 with or without the presence of inhibitors of NF-κB p50 (SN50 and anti-NF-κB p50 Ab). We observed that exposure to Gal9 in culture increased IL-10 expression in Con DCs, but not FA DCs. NF-κBp50 inhibition restored FA DC’s ability to express IL-10 in response to Gal9 (Fig. 5C–E). The results indicate that DCs of FA patients lose the capacity to produce IL-10, which can be restored by the presence of NF-κBp50 inhibitors.
![Assessment of the role of NF-κB phosphorylation in IL-10 induction in DCs. A, B, immunoblots show NF-κB phosphorylation in peripheral DCs. C-E, DCs were cultured in the presence of Gal9 (1 ng/ml) or Gal9 and SN50 (an inhibitor of NF-κBp50; 10 µg/ml) for 48 h. C, IL-10 mRNA levels [median (IQR)] in DCs. D, IL-10 protein levels in DCs. E, integrated density [median (IQR)] of immunoblots in panel D. Statistics: ANOVA followed by Bonferroni test. Treating DCs with SN50 alone in culture did not alter the IL-10 expression (not shown). Abbreviations: Con: non-FA controls. FA: food allergy. Gal9: galectin-9. DC: dendritic cell. Ab: anti-NF-κBp50 antibody (1 μg/ml)](https://oup.silverchair-cdn.com/oup/backfile/Content_public/Journal/cei/213/2/10.1093_cei_uxad062/2/m_uxad062_fig5.jpeg?Expires=1747915753&Signature=feY8-rELfVTDJDHUY2CYAH83~4R--sYau8ajBTt2Vdnx49B~uArlm6kzF~1r44KwAdyKE2Pz5aIdeTuNKkZ~QtyfQIolWR0ppBo1C6UIkWlwYTugkT7PojxQ37OfEJbcn6D5UoJbptW-0gh8ITxyml31hMBM4m05xsu0noXVXihXyFr0JQaAeRXhUA5LQbt-TAhxvgnfqB99fpq8AkK-qU4eWY-ecwNM1jJmKnXHbRzehx1zyEnaQuyjGy8yFIx586xNxwiP3E7MCL~zSQvgF7bdgP3Cnb3sNejk7-oRsxbPJvrKX4ECCgO3fdOw4PLOpOeH9gH4dd-4Pxx409Eykw__&Key-Pair-Id=APKAIE5G5CRDK6RD3PGA)
Assessment of the role of NF-κB phosphorylation in IL-10 induction in DCs. A, B, immunoblots show NF-κB phosphorylation in peripheral DCs. C-E, DCs were cultured in the presence of Gal9 (1 ng/ml) or Gal9 and SN50 (an inhibitor of NF-κBp50; 10 µg/ml) for 48 h. C, IL-10 mRNA levels [median (IQR)] in DCs. D, IL-10 protein levels in DCs. E, integrated density [median (IQR)] of immunoblots in panel D. Statistics: ANOVA followed by Bonferroni test. Treating DCs with SN50 alone in culture did not alter the IL-10 expression (not shown). Abbreviations: Con: non-FA controls. FA: food allergy. Gal9: galectin-9. DC: dendritic cell. Ab: anti-NF-κBp50 antibody (1 μg/ml)
Gal9 in synergy with the NF-κB inhibitor reestablishes the ability of tDC to generate Tr1 cells
It is known that tDCs can induce the generation of Tr1 cells [7]. We then isolated tDCs from FA patients and Con subjects. CD4+ CD25¯ T cells were prepared, and cocultured with tDCs for 4 days. Con tDCs were found to induce about 5.68% Tr1 cells, while only 2.89% Tr1 cells were induced by FA tDCs. The addition of an inhibitor of NF-κBp50, SN50, or an antibody of NF-κBp50 significantly improved the efficiency of the induction of Tr1 cells by FA tDCs (Fig. 6). The results demonstrate that the use of Gal9 and NF-κBp50 inhibitors can recover the ability of FA tDC in the generation of Tr1 cells.
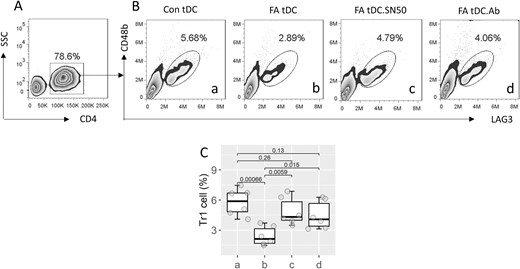
Inhibition of NF-κBp50 restores the ability of Tr1 cell induction by FA tDCs. tDCs were obtained from Con subjects and FA patients, and cultured with CD4+ CD25¯ T cells for 4 days. A, CD4+ T cells were gated, from which Tr1 cells were counted (B). C, boxplots show median (IQR) of Tr1 cell counts from 3 independent experiments. The group labels are the same as those in panel B. Statistics: ANOVA followed by Bonferroni test. Abbreviations: tDC: tolerogenic dendritic cell. FA: food allergy. Con: control. SN50: an inhibitor of NF-κBp50. Ab: anti-NF-κB p50 antibody (1 μg/ml)
Discussion
Current data show that the synergistic effects of Gal9 and NF-κB inhibitors can recover the capacity of FA tDC to generate Tr1 cells. We found that Tr1 cells were less frequent in patients with FA. FA tDCs showed a defect in IL-10 expression that could be attributed to the lower Gal9 expression in the intestinal tissues. Exposure to recombinant Gal9 in culture could recover the ability of FA tDCs in the generation of Tr1 cells.
The exhibition at Gal9 is known to modulate the expression of IL-10 [16]. This phenomenon was also highlighted in this study. We found that exposure to recombinant Gal9 induced the expression of IL-10 in DCs. However, this only occurred in DCs obtained from non-FA control subjects. DCs collected from FA subjects were incompetent to express IL-10 in response to Gal9 in culture. Lower concentrations of IL-10 in serum have been identified in many immune disorders. For example, significantly lower levels of IL-10 were found in the serum of patients with Behçet’s disease [17]. Patients with allergic asthma exhibited lower serum IL-10 concentrations [6]. In patients suffering from FA, lower serum IL-10 levels were also observed [5]. This implies that causal factors affecting the production of IL-10 should be studied. The current data provide a hint that insufficient production of Gal9 by intestinal tissues may contribute to the lower expression of IL-10 in intestinal tDCs. Others also reported that intestinal epithelial cells produce Gal9 [12].
Our data indicate that CD22 is the primary receptor in intestinal tDCs to mediate the effects of Gal9 on regulating the IL-10 expression in tDCs. Many studies have shown that TIM3 plays a crucial role in mediating Gal9’s effects [11, 18]. These reports mainly described the Gal9-induced apoptosis in target cells [11, 18]. It appears that this is not the case in the present experimental context. Our data showed that there were not more apoptotic DCs in culture after exposing to Gal9. We also found that depletion of TIM3 did not influence the expression of IL-10 in tDCs after exposing to Gal9 in culture. Instead, the ablation of the CD22 expression abolished the effects of Gal9 on the induction of the IL-10 expression in tDC. CD22 has been shown to play an important role in the immunosuppressive properties of B cells [19]. Our previous reports indicate that CD22 can be detected in eosinophils [13]. We found that CD22 was required in maintaining the homeostasis of eosinophils [13]. Others also found the expression of CD22 in DCs [20]. Current data have revealed another aspect of CD22 in the immune regulatory activities.
It is recognized that one of the roles of tDC is to induce regulatory T cells [7]. Our data are in line with those reports by showing that tDCs harvested from Con subjects can induce Tr1 cells. However, it is not the case of tDCs collected from FA patients. We found that FA tDCs did not show the capacity to induce Tr1 cells. In particular, we found much more phosphorylated NF-κB in FA tDCs. NF-κB is a transcription factor involving numerous gene transcription [21]. A NF-κBp50 inhibitor was tentatively added to the culture. It indeed increased the Tr1-cell generation from the co-culture of FA tDCs and CD4+ CD25¯ T cells. The results demonstrate that the synergistic effects of Gal9 and the inhibition of NF-κBp50 can recover the ability of FA tDC in the generation of Tr1 cells.
To summarize, current data indicate that tDCs in patients with FA are dysfunctional. Inadequate production of Gal9 by intestinal tissues can be one of the factors that impair the expression of IL-10 in FA tDCs. Concurrent exposure to Gal9 and NF-κB inhibitor recovers the ability to induce Tr1 cells in FA tDCs.
Abbreviations
- Con
non-FA control
- FA
food allergy
- FCM
flow cytometry
- PBMC
peripheral blood mononuclear cells
- tDC
tolerogenic dendritic cells
- Tr1 cells
type 1 regulatory T cells
- sIgE
specific IgE
Ethical approval
The study protocol was approved by the Human Ethics Committee at the 9th People’s Hospital (approval no.: HEC2021009). Each person signed an informed written consent.
Conflict of interests
The authors declare no conflicts of interest.
Funding
This study was supported by research grants of the National Natural Science Foundation of China (32090052), Guangdong Provincial Key Laboratory of Regional Immunity and Diseases (2019B030301009), Shenzhen science, technology and innovation committee (KQTD20170331145453160) and Fundamental research program funding of Ninth People’s Hospital affiliated to Shanghai Jiao Tong university School of Medicine.
Data availability
All data are included in this paper.
Author contributions
Li L, Xu X, Wang X, Zhang S, Yao W and Liu J performed experiments, analyzed data, and reviewed the manuscript. Yang P and Liu Z organized study and supervised experiments. Yang P designed the project and prepared the manuscript.
