


Abstract
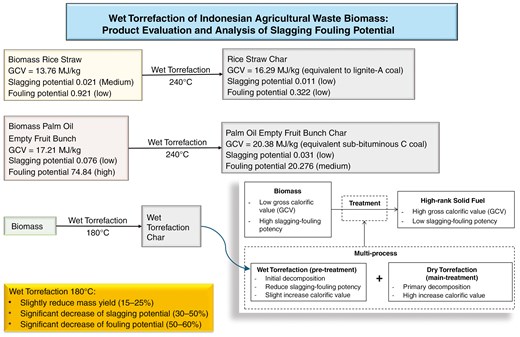
The agricultural waste biomass holds potential as a valuable resource, capable of being converted into high-grade solid fuel for energy production. Despite the ample availability of rice straw and palm oil empty fruit bunch stock, challenges persist with biomass feedstock, such as low calorific values and high slagging-fouling potency. The wet torrefaction process, known as hydrothermal torrefaction, enhances agricultural waste biomass into solid fuel comparable to lignite and sub-bituminous coal. The study investigates the slagging-fouling potential of raw agriculture biomass waste and wet torrefaction-treated variants, evaluating sample characteristics through proximate, ultimate, and calorific value analyses. This study also investigates the potential of the wet torrefaction process as a pre-treatment in multi-process conversion. The moisture content of the wet torrefaction biomass decreased slightly, and the calorific value of the wet torrefaction biomass samples was higher than that of the raw biomass. The result of rice straw wet torrefaction at 240°C was a gross calorific value of 16.29 MJ/kg, equivalent to lignite A, with slagging potential decreased from 0.021 (low) to 0.011 (low), and the fouling potential from 0.921 (medium) to 0.322 (low). The result of palm oil empty fruit bunches, wet torrefaction at 240°C achieved the highest gross calorific value of 20.38 MJ/kg, equivalent to sub-bituminous C coal, with slagging potential reduced from 0.076 (low) to 0.031 (low) and fouling potential reduced from 74.84 (high) to 20.27 (medium). Wet torrefaction shows potential as a pre-treatment for multi-process conversion. Future studies should consider sequential torrefaction (wet and dry methods) that could leverage the advantages of each, reducing slagging and fouling potential while increasing the calorific value.
1. Introduction
Agricultural waste biomass shows promise as a valuable biomass source, potentially transformed into high-grade solid fuel for energy production. One of the agricultural wastes is RS waste, which has emerged as the primary candidate for renewable biomass resources from rice processing and is widely available in Indonesia. This resource has garnered attention as an alternative bioenergy source, aiming to curb reliance on fossil fuels and mitigate global energy challenges [1]. Indonesia’s rice production, totalling 54.75 million tons in 2022 [2], yields an estimated 25%–30% in rice straw (RS) waste, approximately 10.95–16.42 million tons [3]. Besides its abundance, RS waste contains constituents suitable for bioenergy conversion. Additionally, Indonesia leads globally in crude palm oil (CPO) production, producing 42.8 million tons in 2018 [4]. CPO production generates three solid wastes: palm press fibres (PPF), palm kernel shells (PKS), and palm empty fruit bunches (EFB) [5]. Among these, EFB, the outer layer of oil palm fruit, emerges as a substantial waste component as a solid fuel. Despite their lower heating value compared to PKS, PPF, and coal, EFB exhibits potential due to their vast availability [6]. In 2018, Indonesia produced 37.5 million tons of EFB, equivalent to 1 GWe of power generation annually if utilized as fuel for power plants. With anticipated growth in palm oil production exceeding 45 million tons in 2022 [7], EFB availability is set to increase further. Consequently, EFB presents a viable fuel option that aligns with its ample supply and underutilization.
Despite the ample availability of RS and EFB stock, challenges persist with biomass feedstock, such as low calorific values (CVs) and high slagging-fouling potency [8]. Additionally, the high presence of alkali metals in biomass ash contributes to deposition and corrosion during combustion in power plants [9]. Elevated potassium levels and other alkaline components like K and Na lead to ash build-up, deposition, and corrosion on the boiler’s surfaces, resulting in diminished heat transmission capacity, increased heat loss, operational irregularities, and a notable decline in boiler efficiency [10]. Consequently, biomass processing becomes imperative to address these issues. Among the contemporary methods for enhancing the quality of raw biomass, hydrothermal treatment, also known as wet torrefaction (WT), stands out as a widely adopted approach globally.
Various researchers have noted similarities in the mechanisms governing the degradation of biomass components during WT compared to conventional torrefaction. This degradation and depolymerization of cellular components primarily involve hydrolysis, dehydration, decarboxylation, aromatization, and recondensation reactions [11]. The commencement of the WT process involves hydrolysis, marked by a lower activation energy level for hemicellulose and cellulose, facilitating their breakdown. Biomass components, such as hemicellulose, cellulose, and lignin, significantly rely on the specific reaction medium employed. The components become less stable under WT conditions: hemicellulose decomposes within the temperature range of 180°C–200°C, while cellulose decomposes above 220°C [12].
The ash content of biomass varies depending on the type of biomass, planting conditions, and habitats. Experimental results show that the ash content of biomass generally ranges from 0.5% to 20% [13]. Slagging and fouling occur when the ash melts and adheres to the boiler’s wall or heat transfer surface. Key elements contributing to slagging and fouling potential include potassium (K), chlorine (Cl), silicon (Si), phosphorus (P), calcium (Ca), sulphur (S), magnesium (Mg), iron (Fe), and sodium (Na) [14]. The ash components of biomass usually appear as a weight percentage of stable oxides, such as SiO2, CaO, K2O, P2O5, Al2O3, MgO, Fe2O3, Na2O, SO3, and TiO2. Notably, oxide content can vary significantly among samples from the same plant species, as observed by Yu et al. [15]. During biomass combustion, a large portion of potassium transitions into the gaseous phase and later condenses on fly ash particles as chlorides or sulphates. This process reduces the melting point of the fly ash, increases its viscosity, and promotes slag formation on furnace heating surfaces exposed to airflow [16]. The mineral composition of the fuel influences the potential for slagging and fouling. Biomass combustion in boilers tends to heighten these risks due to its typically low SiO2 and Al2O3 content combined with high K2O levels [17]. Differently, ash with higher concentrations of SiO2, Al2O3, and MgO is associated with lower slagging and fouling potential and increased ash fusion temperature (AFT) [18].
Assessing the impact of WT on ash deposition involves computing various indices derived from ash chemical analysis, posing challenges in determining AFT. Research on factors influenced by the WT process, impacting ash composition and fusion behaviour, needs to be more extensive and precise, particularly concerning RS and EFB. Considering ash chemical composition and fusion behaviour, this paper elucidates how the WT process affects ash deposition during combustion in boilers or gasifiers. The study investigates ash deposition of raw waste agriculture biomass and WT-treated variants, evaluating sample characteristics through proximate, ultimate, and CV analyses. The indices derived from ash chemical analysis and AFT can predict the potential for slagging-fouling potency during combustion in power plant boilers.
2. Experimental materials and methods
The experimental materials comprise two abundant waste biomasses: RS and palm oil EFB. RS was representative of agricultural field waste due to its widespread availability despite its significant silica content in the ash. EFB, chosen as waste from agricultural plantations, was selected for its availability and high potassium content in the ash [19].
2.1 Biomass characterization
In the laboratory, raw biomass samples were crushed and filtered through a ±3-mm sieve for WT treatment and a 250-μm sieve (no. 60) for proximate, ultimate, and CV analyses, as well as ash chemical and AFT analyses. The proximate analysis involved assessing inherent moisture (IM), ash (A), and volatile matter (VM) following ASTM standards D 3176, D 3175, and D 3175, respectively. Fixed carbon (FC) content on a dry basis (db) was computed as 100% minus the sum of ash and VM contents. The ultimate analysis included determining carbon, hydrogen, nitrogen, and total sulphur contents via ASTM methods D 3179-89 and D 3179, as well as using infrared techniques for sulphur. Oxygen content on a dry ash-free (daf) basis was calculated as 100% of the sum (C + H + N + S). Results provided atomic H/C and O/C ratios, often indicators of carbonization level [20]. Solid fuels comparable to peat and lignite typically exhibit higher H/C and O/C ratios, indicating low carbonization. Wet torrefaction is expected to reduce these ratios towards those of high-grade coal. CV was also determined according to ASTM standard 5865-04.
2.2 Wet torrefaction treatment
The WT process was performed on a laboratory scale using a 10 L autoclave. Approximately 250 g of raw biomass was mixed with 5000 gr of distilled water. The mixture was placed in the autoclave, sealed, and evacuated for 5 minutes to eliminate trapped air, then pressurised with N2 to about 0.1 MPa. The autoclave was heated gradually at 3°C–4°C per minute to a temperature range of 180°C–240°C, maintained at this temperature for 30 minutes. After cooling to room temperature, the processed sample was retrieved, filtered, dried, and stored in sealed containers. The wet torrefied biomass samples were labelled as in Table 1 and subsequently analysed following the same procedures as the raw biomass samples.
Sample and process temperature.
| Rice straw | Palm oil empty fruit bunch | Process temperature, °C |
|---|---|---|
| WRS180 | WFB180 | 180 |
| WRS200 | WFB200 | 200 |
| WRS220 | WFB220 | 220 |
| WRS240 | WFB240 | 240 |
| Rice straw | Palm oil empty fruit bunch | Process temperature, °C |
|---|---|---|
| WRS180 | WFB180 | 180 |
| WRS200 | WFB200 | 200 |
| WRS220 | WFB220 | 220 |
| WRS240 | WFB240 | 240 |
2.3 Ash analysis
To determine the ash content, the raw and WT biomass samples were ashed at 400°C for 10 hours to prevent the volatilization of alkali metals [21]. The composition of the ash was analysed as follows: SiO2, Al2O3, Fe2O3, CaO, MgO, Na2O, K2O, MnO2, TiO2, and P2O5 by inductively coupled plasma—optical emission spectrometry (ICP-OES); SO3 by infrared (IR) spectrometry. ICP-OES is an analytical technique used to detect chemical elements of metallic elements. It is a type of emission spectroscopy that uses an inductively coupled plasma to produce excited atoms and ions that emit electromagnetic radiation at the wave-length characteristic of a particular element. It is a flame technique with temperatures ranging from 6000 to 10 000 K. The intensity of this emission indicates the concentration of the element in the sample. The methods used are ASTM D6722. Analytical methods can be summarized as follows: a sample is introduced into a plasma chamber; the plasma excites the elements in the sample; the excited elements emit photons; a spectrometer separates the wave length of the photons; a detector measures the photons; the measured photons are used to calculate the concentration of each element in the sample. The SO3 content was analysed using infrared spectrometry (IR Prestidge-21, Shimadzu). Specimens were prepared by decomposing at 300°C–350°C to produce solid SO3, then diluting the sample into the sample plate using potassium bromide (KBr). The proportion of the sample to KBr is approximately 1–10. The relatively constant spectra were obtained after adjusting the number of scans to 50 times [22]. The IR spectra of solid SO3 were examined between 20 and 290 K.
Various empirical indicators of ash composition related to deposition tendencies, such as the acid–base ratio (B/A), the bed agglomeration index (BAI), the fouling index (Fu), the slag viscosity index (SR), and the slagging index (Rs), were determined according to Equations (1)–(5) [23].
3. Results and discussion
3.1 Proximate, ultimate, and calorific value analyses
Wet torrefaction is a non-evaporative method that efficiently removes moisture and alters the chemical composition of biomass [24]. Table 2 presents raw and WT biomass proximate and CVs. The raw RS and EFB have relatively low IM (<10%) and high VM, with moderate ash and FC. At a temperature process of 180°C, the IM decreases compared to raw RS, while the ash content increases slightly, the VM shows a minor decrease, and the FC content increases. At the highest temperature treatment (240°C), the moisture content is at its lowest, ash content increases significantly, the VM decreases substantially, and FC content is the highest among all samples, indicating extensive carbonization. As the reaction temperature increased, the biomass moisture content gradually decreased. The WT treatment broke the biomass cells, and the bound water in the cells became free water, improving dehydration performance [25]. The reduction of VM, FC, and moisture content implicated an increase in ash content.
Proximate and calorific value of raw and wet torrefied biomasses.
| Sample | Proximate | Gross calorific value (GCV) | |||
|---|---|---|---|---|---|
| IM | Ash | VM | FC | ||
| %, adb | %, adb | %, adb | %, adb | MJ/kg, adb | |
| Raw RS | 9.82 | 18.56 | 57.74 | 13.88 | 13.76 |
| WRS180 | 6.94 | 20.56 | 56.38 | 16.12 | 14.19 |
| WRS200 | 6.82 | 23.6 | 52.54 | 17.04 | 14.22 |
| WRS220 | 6.54 | 27.4 | 47.68 | 18.38 | 15.30 |
| WRS240 | 5.79 | 34.16 | 37.18 | 22.87 | 16.29 |
| Raw EFB | 8.98 | 7.3 | 65.78 | 17.94 | 17.21 |
| WFB180 | 7.94 | 8.1 | 64.82 | 19.14 | 18.77 |
| WFB200 | 7.25 | 8.87 | 62.12 | 21.76 | 18.92 |
| WFB220 | 6.46 | 9.2 | 58.56 | 25.78 | 19.70 |
| WFB240 | 6.22 | 9.78 | 54.88 | 29.12 | 20.38 |
Generally, IM consistently decreases as temperature increases and higher temperatures will drive off moisture. VM decreases as temperature increases, typical thermal treatment processes that drive off volatile compounds. FC increases with temperature, reflecting the conversion of organic material into carbon-rich residues. Ash content increases with temperature, indicating that more organic material decomposes, leaving a higher concentration of inorganic compounds. Following WT, there was a notable decrease in IM, confirming the effectiveness of WT in reducing moisture content until it reaches a normal equilibrium relative to ambient air moisture levels. The decrease in IM and VM contributed to the higher FC content, enhancing solid-fuel combustion efficiency [26].
Ash-forming components in biomass can exist as salts, inherent ash within the carbon structure, or contaminants mixed into the fuel during handling. These components, dispersed uniformly throughout the fuel, move more freely than embedded ash and are easily combustible, contributing to char formation during burning. VM content is essential in solid-fuel combustion. Initially, RS and EFB had a high VM content. The WT process decreases VM, causing FC content fluctuations. FC remains a solid combustible residue after heating releases VM, excluding moisture and ash. FC is a significant heat generator during combustion and correlates with the fuel’s heating value. Increased FC proportion enhances solid fuel’s CV.
FC is the amount of non-volatile carbon in a biomass sample. The solid combustible char remains after heating a biomass particle and expelling the VM. The amount of FC and volatile combustible matter directly contributes to the CV of solid fuel. Fixed carbon role as a heat generator during combustion [27]. CV is a critical parameter defining a material’s energy potential and is essential for evaluating its usefulness as an energy source. Fuel moisture and chemical composition significantly influence CV. The raw biomass studied here has a relatively low CV, RS at 13.76 MJ/kg, and EFB at 17.21 MJ/kg. Wet torrefied RS shows an increased CV ranging from 14.19 to 16.29MJ/kg. Likewise, WT EFB shows an increased CV ranging from 18.77 to 20.38 MJ/kg.
The evaluation of de-ashing (DDA) and CV improvement (DCI) due to WT is calculated using Equations (6) and (7), as presented in Table 3. Higher temperature WT improves DDA and DCI for WT RS and EFB.
DDA and DCI of wet torrefied biomasses.
| Sample | DDA, % | DCI, % |
|---|---|---|
| WRS180 | 3.79% | 3.16% |
| WRS200 | 4.19% | 3.35% |
| WRS220 | 5.15% | 11.19% |
| WRS240 | 11.56% | 18.40% |
| WFB180 | 15.95% | 9.04% |
| WFB200 | 17.25% | 9.97% |
| WFB220 | 22.49% | 14.47% |
| WFB240 | 38.98% | 18.43% |
| Sample | DDA, % | DCI, % |
|---|---|---|
| WRS180 | 3.79% | 3.16% |
| WRS200 | 4.19% | 3.35% |
| WRS220 | 5.15% | 11.19% |
| WRS240 | 11.56% | 18.40% |
| WFB180 | 15.95% | 9.04% |
| WFB200 | 17.25% | 9.97% |
| WFB220 | 22.49% | 14.47% |
| WFB240 | 38.98% | 18.43% |
where
Ashi: the initial ash content;
Ashf: the final ash content;
GCVi: the initial GCV;
GCVf: the final CV.
The ultimate analysis (Table 4) examines the contents of carbon (C), hydrogen (H), nitrogen (N), oxygen (O), and total sulphur (S), which are essential for evaluating biomass combustion and understanding pollutant behaviour [28]. Higher carbon content correlates with higher GCV, indicating increased heat production. RS and EFB have low sulphur content, implying that the sulphur content changes are insignificant compared to the reduction of other components by washing and WT. The low sulphur content makes biomass environmentally friendly, with minimal contributions to acid rain and greenhouse gas emissions.
Ultimate of raw and wet torrefied biomasses.
| Sample | Ultimate | ||||
|---|---|---|---|---|---|
| C | H | N | S | O | |
| %, adb | %, adb | %, adb | %, adb | %, adb | |
| Raw RS | 35.01 | 6.70 | 0.64 | 0.06 | 39.03 |
| WRS180 | 36.45 | 6.39 | 0.71 | 0.10 | 35.79 |
| WRS200 | 36.88 | 5.76 | 0.73 | 0.12 | 32.91 |
| WRS220 | 38.04 | 5.45 | 0.81 | 0.12 | 28.18 |
| WRS240 | 38.40 | 5.04 | 1.11 | 0.13 | 21.16 |
| Raw EFB | 43.89 | 7.08 | 0.83 | 0.10 | 40.80 |
| WFB180 | 46.00 | 7.17 | 0.86 | 0.11 | 37.76 |
| WFB200 | 46.65 | 7.22 | 1.01 | 0.13 | 36.12 |
| WFB220 | 48.63 | 7.12 | 1.16 | 0.14 | 33.75 |
| WFB240 | 53.76 | 6.83 | 1.4 | 0.16 | 28.07 |
The ultimate analysis showed a significant increase in carbon content and a substantial decrease in oxygen content after the WT process (Table 4). The Van Krevelen diagram demonstrates a reduction in the O/C and H/C atomic ratios, which indicates the removal of oxygen-containing functional groups and improvements in biomass quality, signifying an enhancement in solid-fuel grade [20]. Figure 1 shows the changes in O/C and H/C in RS processed using WT, compared to lignite at 240°C. Thus, Fig. 2 shows similar results for EFB at the same temperature. These results confirm that the WT process can upgrade RS and EFB biomass into solid fuels comparable to lignite coal.
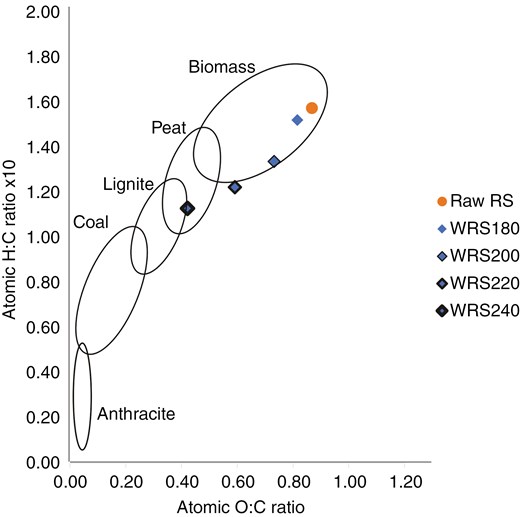
Van Krevelen diagram of the raw and the wet torrefied RS.
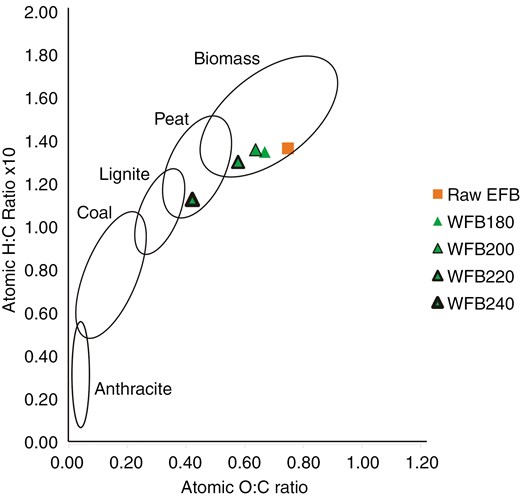
Van Krevelen diagram of the raw and the wet torrefied palm oil EFB.
The O/C and H/C ratios of raw and treated biomass samples on the Van Krevelen coal band shifted to more promising solid fuel after WT, though not precisely following the coal band. This data suggests that WT can elevate the grade of biomass to a level comparable to lignite coal, particularly in terms of increased carbon content. WT can be viewed as a coalification process, albeit induced by elevated temperature and pressure [29]. There was a slight increase in nitrogen content in WT samples due to the reduction in biomass mass resulting from moisture removal. However, the changes in nitrogen and sulphur content did not significantly impact NOx and SOx emissions when solid fuel was combusted in the power plant boiler, as they remained below acceptable thresholds [30].
3.2 Ash content analysis
The chemical composition of ash and AFT were analysed to investigate the impact of WT on ash deposition. Table 5 displays the RS ash composition analysis results, expressing each oxide as a weight percentage of the ash (weight%). Raw RS exhibits a high silica oxide (SiO2) content, which increases with higher acid concentrations. It is well-recognized that silica is the most prevalent inorganic constituent in biomass. Silica (SiO2), a predominant element in the Earth’s crust, primarily enters plants as water-soluble H4SiO4 during growth [31].
Ash composition of the raw and the wet torrefied rice straw (weight%).
| Sample | Raw RS | WRS180 | WRS200 | WRS220 | WRS240 |
|---|---|---|---|---|---|
| SiO2 | 85.95 | 86.55 | 86.85 | 86.94 | 89.65 |
| Al2O3 | 0.62 | 0.61 | 0.58 | 0.52 | 0.49 |
| Fe2O3 | 0.34 | 0.37 | 0.38 | 0.40 | 0.51 |
| K2O | 6.93 | 4.61 | 3.88 | 3.73 | 3.42 |
| Na2O | 0.17 | 0.15 | 0.14 | 0.12 | 0.11 |
| CaO | 2.23 | 2.41 | 2.46 | 2.55 | 2.84 |
| MgO | 0.71 | 0.67 | 0.63 | 0.61 | 0.54 |
| MnO | 0.24 | 0.20 | 0.22 | 0.19 | 0.19 |
| TiO2 | 0.05 | 0.06 | 0.07 | 0.07 | 0.08 |
| P2O5 | 0.85 | 0.85 | 0.83 | 0.82 | 0.80 |
| SO3 | 0.45 | 0.65 | 0.75 | 0.79 | 0.81 |
Table 6 illustrates that Raw EFB initially contains a high K2O content of 35.87%, which decreases to 15.40%–18.87% after WT. Potassium, predominantly present in living biomass as free K+ ions and highly mobile, undergoes a decrease in K2O content. These ions precipitate as soluble potassium salts like KCl and KNO3, which are inorganic [32]. Alkali metals like Na and K significantly influence the slagging behaviour of biomass ash. These elements tend to volatilize within the combustion chamber at elevated temperatures. They subsequently condense into submicron ash particles, forming a sticky layer that adheres to heating surfaces [33]. Other oxides such as Al2O3, Fe2O3, CaO, MgO, and TiO2 have fluctuation content during WT processes.
Ash composition of the raw and the wet torrefied palm oil empty fruit bunch (weight%).
| Sample | Raw EFB | WFB180 | WFB200 | WFB220 | WFB240 |
|---|---|---|---|---|---|
| SiO2 | 23.15 | 23.65 | 24.50 | 25.05 | 26.55 |
| Al2O3 | 1.80 | 1.49 | 1.26 | 0.77 | 0.63 |
| Fe2O3 | 0.54 | 3.84 | 4.24 | 4.68 | 5.16 |
| K2O | 35.87 | 18.87 | 17.12 | 16.07 | 15.40 |
| Na2O | 0.28 | 0.25 | 0.23 | 0.22 | 0.21 |
| CaO | 5.11 | 5.48 | 6.06 | 6.78 | 7.77 |
| MgO | 5.77 | 5.52 | 4.51 | 3.95 | 3.80 |
| MnO | 0.11 | 0.11 | 0.10 | 0.09 | 0.08 |
| TiO2 | 0.07 | 0.08 | 0.09 | 0.10 | 0.12 |
| P2O5 | 4.23 | 4.22 | 3.36 | 3.26 | 3.12 |
| SO3 | 4.26 | 4.38 | 4.41 | 4.54 | 5.04 |
The WT process can reduce potassium content in biomass because potassium is highly water-soluble and easily washes away. The effectiveness of the WT process depends on several parameters: the ratio of water to biomass, water temperature, and duration of the process [34]. The water-to-biomass ratio determines how much potassium can dissolve in the water; using more water increases saturation levels, allowing more potassium to be removed from the biomass [35]. The water temperature also influences potassium solubility [35], with higher temperatures significantly reducing potassium. A longer WT process removes more potassium, as extended durations allow a more significant potassium washout.
Table 7 displays the AFT results for raw and WT-treated RS and EFB. AFT characteristics were superior under oxidative conditions compared to reductive conditions. Oxidative WT conditions resulted in increased AFT values across the board. Conversely, under reductive conditions, the AFT response varied, with some values increasing and others decreasing due to the WT process. Low AFT values complicate the removal of liquid slag from gasifiers and exacerbate fouling and slag formation on heating surfaces in gasifiers and combustion boilers, thus limiting overall efficiency [36].
AFT oxidation of the raw and the wet torrefied biomasses.
| Sample | IDT, °C | ST, °C | HT, °C | FT, °C |
|---|---|---|---|---|
| Raw RS | 1435 | 1465 | 1490 | 1500 |
| WRS180 | 1455 | 1480 | 1500 | 1500 |
| WRS200 | 1485 | 1500 | 1500 | 1500 |
| WRS220 | 1500 | 1500 | 1500 | 1500 |
| WRS240 | 1500 | 1500 | 1500 | 1500 |
| Raw EFB | 1160 | 1175 | 1190 | 1240 |
| WFB180 | 1185 | 1200 | 1220 | 1250 |
| WFB200 | 1190 | 1242 | 1268 | 1300 |
| WFB220 | 1200 | 1240 | 1255 | 1300 |
| WFB240 | 1205 | 1240 | 1255 | 1310 |
The chemical composition of biomass ash primarily influences AFT values. The RS with high SiO2 content typically indicates high AFT values [36]. Elevated iron content in coal ash promotes liquid formation and the reduction of Fe3+ to Fe2+, influencing fusibility under different conditions. Consequently, AFT tends to decrease with increasing iron content. Most iron exists in the Fe2+ state, acting as a basic oxide that reduces AFT values [37].
3.3 Ash deposition prediction
Table 8 presents the indices that predict ash deposition for raw and wet torrified biomass samples. These indices indicate a decrease in slagging (Rs) and fouling (Fu) for WT samples compared to raw biomass. Generally, raw RS and EFB have low slagging potential. However, raw EFB has a high fouling risk. WT significantly reduces the potassium content in the ash and lowers the slagging potential of EFB from high to medium potency.
Indices to predict the ash deposition.
| Sample | B/A | BAI | SR | Rs | Fu |
|---|---|---|---|---|---|
| Raw RS | 0.130 | 0.048 | 96.32 | 0.021 | 0.921 |
| WRS180 | 0.104 | 0.078 | 96.17 | 0.010 | 0.494 |
| WRS200 | 0.095 | 0.095 | 96.16 | 0.011 | 0.382 |
| WRS220 | 0.094 | 0.104 | 96.07 | 0.012 | 0.362 |
| WRS240 | 0.091 | 0.144 | 95.84 | 0.011 | 0.322 |
| Raw EFB | 0.953 | 0.537 | 56.55 | 0.076 | 74.840 |
| WFB180 | 0.908 | 0.738 | 55.92 | 0.052 | 28.942 |
| WFB200 | 0.872 | 0.975 | 55.97 | 0.051 | 23.838 |
| WFB220 | 0.925 | 1.637 | 52.89 | 0.032 | 21.971 |
| WFB240 | 0.987 | 3.091 | 49.52 | 0.031 | 20.276 |
Ash characteristics influence the tendency for slagging [38]. Typically, higher B/A ratios indicate increased slagging propensity: B/A < 0.5 suggests low slagging, 0.5 ≤ B/A < 0.99 indicates medium slagging, 1 ≤ B/A < 1.74 signifies high slagging, and B/A > 1.75 suggests severe slagging [23]. Assessing challenges during fluidized bed combustion, the BAI extends insights; BAI < 10 indicates potential bed agglomeration [39]. The SR by Rizvi et al. [40] evaluates furnace slag trends. Higher viscosity correlates with lower slagging. SR values above 72 indicate low slagging, 65 < SR < 72 suggests medium slagging, and SR values below 65 indicate high slagging.
The Fu, determined by the B/A ratio and alkali (Na2O + K2O) content, is crucial. Despite low sodium in biomass ash, potassium, SO3, and CaO are crucial elements in ash deposits on superheater tubes. Potassium condensation on fly ash particles contributes to surface stickiness and fouling. Fu values <0.6 indicate low fouling potential, 0.6 ≤ Fu ≤ 40 suggests medium fouling, and Fu > 40 indicates high fouling propensity [41].
The Babcock index (Rs) predicts slagging at the furnace wall during boiler operation based on the ash’s basic-to-acidic component ratio (B/A ratio) and the sample’s sulphur percentage on a dry basis. Higher Rs values indicate a greater tendency for slagging [23]. Specifically, a low slagging tendency occurs for Rs < 0.3, a medium tendency for Rs values between 0.6 and 2.0, a high tendency for Rs values between 2.0 and 2.6, and a severe tendency for Rs > 2.6.
Based on the average values of parameters and the results from ash chemical analysis, raw and WT biomass show similar tendencies for ash deposition. The WT product, evaluated under oxidative conditions using AFT, showed higher values, indicating a reduced propensity for ash deposition. This analysis suggests that WT has the potential to enhance biomass quality to be comparable with lignite coal. Few studies have explored the factors influencing ash deposition during the WT process. Some studies have noted that WT enhances quality by improving combustion characteristics and reducing slagging and fouling compared to raw biomass [38]. The SiO2 observed an increase while a decrease in Fe2O3 in the WT product, which aligns with research by Wan et al. [42] and Yang et al. [43]. The mineral composition of RS significantly influences ash deposition, with high silica indicating the presence of minerals like shale, slate, and silicates [44]. Elevated Fe2O3 suggests the presence of inorganic compounds linked to sulphur in minerals such as pyrite and jarosite and as a trace element in kaolinite [45]. The thermodynamics and kinetics of mineral transformations govern the tendencies for deposition, fouling, and slagging [46]. Several limitations of the AFT method for studying ash fusion behaviour have been highlighted, including variations in IDT values reported by different laboratories, which can reach temperatures up to 400°C [47].
3.4 Possibility of multi-process conversion
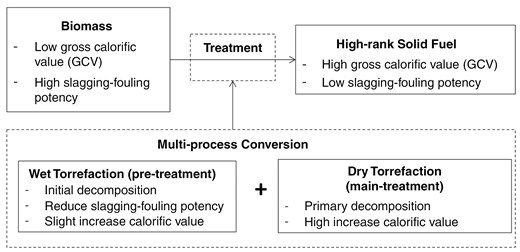
Producing high-quality fuel from biomass relies on two critical factors: achieving a high CV and mitigating the risk of slagging and fouling. Increasing the CV involves breaking down biomass components, particularly by enhancing carbon content while reducing elements like oxygen and hydrogen. Slagging and fouling tendencies can be minimized through washing or hydrothermal treatment, decreasing the ash’s alkali content. Torrefaction emerges as a promising method to address these challenges.
The sequential torrefaction approach using wet and dry methods can leverage the advantages of two torrefaction (Fig. 3). Wet torrefaction (hydrothermal) operates at <200°C, initially facilitating hemicellulose decomposition. Water in WT acts as a medium to reduce alkaline ash content, lowering the risk of slagging and fouling. However, using air as a medium in WT presents specific challenges, including higher energy requirements than gas media and maintaining air in a liquid state under significant pressure. Dry torrefaction complements this process by completing decomposition and enhancing the carbon content in the fuel. The main torrefaction (dry) operates at temperatures ranging from 200°C to 330°C, intending to use energy more efficiently than WT at process temperatures and atmospheric pressure.
Multi-process conversion illustration.
The mass yield from the WT process also plays a crucial role in determining the operating conditions. Figures 4 and 5 show the mass yield of WT for RS and EFB. Further, Figs. 4 and 5 and Table 8 concluded that WT at 180°C slightly reduced mass yield (15%–25%), showed a significant decrease in slagging potential (30%–50%), and a significant decrease in fouling potential (50%–60%). Temperature 180°C has a high mass yield yet significant slagging-fouling potential reduction. In the multi-torrefaction process, WT serves as a pre-treatment at 180°C, followed by dry torrefaction at a higher temperature to produce high-rank solid fuel.
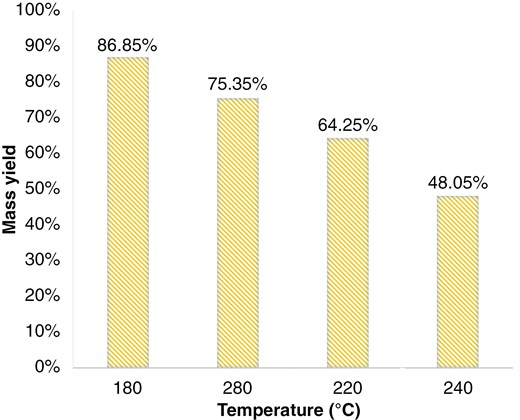
Wet torrefaction mass yield for RS.
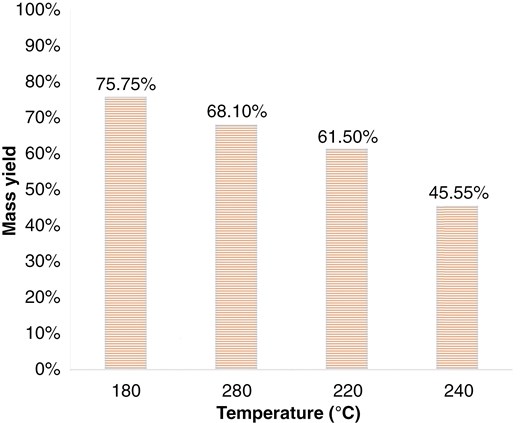
Wet torrefaction mass yield for palm oil EFB.
4. Conclusions
In this study, the WT process improved the agricultural waste biomass to a comparable level of lignite and sub-bituminous coal. The moisture content of the biomass decreased slightly, and the CV of the WT biomass samples was higher than those of the raw biomass. Wet torrefaction treatment for RS shows the highest GCV at 240°C of 16.29 MJ/kg or equivalent with lignite-A coal, slagging potential value reduction from 0.021 (low potency) to 0.011 (low potency) and fouling potential from 0.921 (medium potency) to 0.322 (low potency). Meanwhile, the palm oil EFB WT result shows that the highest GCV at 240°C is 20.38 MJ/kg or equivalent with sub-bituminous C coal, slagging potential reduction value from 0.076 (low potency) to 0.031 (low potency); and fouling potential from 74.84 (high potency) and 20.276 (medium potency). The O/C and H/C of WT products are closer to being comparable to lignite coal than raw biomass. Wet torrefaction is promising as a pre-treatment of the multi-process conversion. A sequential torrefaction approach using wet and dry torrefaction methods can leverage the advantages of two torrefaction: reducing the slagging-fouling potential yet increasing the CV. Furthermore, future studies should consider sequential torrefaction (wet and dry) to evaluate the effectiveness, advantages, and efficiency of the process regarding energy utilization.
Acknowledgments
This research was supported by “Research, Community Services, and Innovation Program (PPMI) FTMD ITB 2024” and “The Indonesian Endowment Funds for Education (LPDP)”. The experiment was conducted in the Thermodynamics Laboratory at Pusat Rekayasa Industri of Institut Teknologi Bandung and the Testing Center for Mineral and Coal Indonesia (Tekmira).
Author contributions
Muhammad Ade Andriansyah Efendi (Conceptualization [Equal], Writing—original draft [Equal]), Toto Hardianto (Supervision [Equal]), and Pandji Prawisudha (Supervision [Equal])
Conflict of interest statement
None declared.
Data availability
The data underlying this article are available in the article.
