


Abstract
The weather-dependent uncertainty of wind and solar power generation presents a challenge to the balancing of power generation and demand in highly renewable electricity systems. Battery energy storage can provide flexibility to firm up the variability of renewables and to respond to the increased load demand under decarbonization scenarios. This paper explores how the battery energy storage capacity requirement for compressed-air energy storage (CAES) will grow as the load demand increases. Here we used an idealized lowest-cost optimization model to study the response of highly renewable electricity systems to the increasing load demand of California under deep decarbonization. Results show that providing bulk CAES to the zero-emission power system offers substantial benefits, but it cannot fully compensate for the 100% variability of highly renewable power systems. The capacity requirement of CAES increases by ≤33.3% with a 1.5 times increase in the load demand and by ≤50% with a two-times increase in the load demand. In this analysis, a zero-emission electricity system operating at current costs becomes more cost-effective when there is firm power generation. The least competitive nuclear option plays this role and reduces system costs by 16.4%, curtails the annual main node by 36.8%, and decreases the CAES capacity requirements by ≤80.7% in the case of a double-load demand. While CAES has potential in addressing renewable variability, its widespread deployment is constrained by geographical, societal, and economic factors. Therefore, if California is aiming for an energy system that is reliant on wind and solar power, then an additional dispatchable power source other than CAES or similar load flexibility is necessary. To fully harness the benefits of bulk CAES, the development and implementation of cost-effective approaches are crucial in significantly reducing system costs.
1. Introduction
The demand for electricity is projected to undergo exponential growth in the coming years as the world accelerates its efforts to decarbonize power systems. Factors such as population growth, urbanization, and the electrification of various sectors are contributing to this surge in demand [1, 2]. However, meeting the increasing electricity demand while simultaneously reducing greenhouse gas emissions presents a significant challenge. The integration of renewable energy resources, such as wind and solar, is a step in the right direction [3]. However, the intermittent nature of these energy resources poses a dilemma: what happens when the Sun is not shining, and the wind is not blowing? Energy storage systems have emerged as a transformative solution, capable of storing surplus renewable energy and ensuring a reliable power supply, even during periods of low generation [4].
As the demand for electricity in decarbonized power systems grows, there will be a corresponding increase in the deployment of energy storage systems. Energy storage helps to optimize grid operations, reduce peak demand, integrate with demand–response programmes, and support electrification and decarbonization efforts [5]. In addition, energy storage will play a crucial role in enabling the transition to a sustainable, low-carbon energy future. In decarbonized power systems, the increasing energy demand necessitates long-duration energy storage. These storage technologies play a crucial role in managing the intermittent nature of renewable energy, offering grid flexibility, minimizing curtailment, and ensuring reliable and resilient power supply. As demand continues to grow, the pursuit of effective long-duration energy storage fosters innovation, research, and development. This, in turn, leads to advancements in energy storage technologies and cost reductions, ultimately facilitating the attainment of sustainable and decarbonized energy systems [6, 7].
Long-duration energy storage systems, such as pumped hydro storage and compressed-air energy storage (CAES), play a crucial role in decarbonized power systems, particularly when faced with demand growth [8, 9]. CAES systems store energy by compressing air and storing it in underground caverns or tanks. When demand surges, the stored compressed air is released, heated, and expanded through turbines to generate electricity. This enables CAES to act as a flexible and dispatchable energy source, bridging the gap between intermittent renewable energy generation and consistent power supply. By providing long-duration energy storage capabilities, CAES can help to ensure grid stability, manage peak loads, and support the integration of renewable sources, thus contributing to the decarbonization efforts of the electric sector [10, 11].
Numerous recent studies have focused on the role of long-duration energy storage (LDES) in variable renewable electricity systems as a crucial component of decarbonization efforts within the electric power systems of various US states and territories, including California [12–15]. These studies analyse how LDES technologies can effectively integrate with variable renewable sources such as wind and solar power to enable the widespread adoption of clean energy. By exploring the potential of LDES, researchers aim to support the transition towards sustainable and low-carbon electric power systems across different regions of the USA. The growing demand for energy is placing significant pressure on our current energy systems, highlighting the need for effective energy storage solutions. The papers in [16, 17] investigate the techno–economic benefits of community energy storage systems and evaluate battery performance in demand load shifting, with a specific focus on demand peak reduction and energy demand levelling. Turning to the challenges posed by variable renewable energy sources (RES) in the electricity generation mix, authors in [18] emphasize energy storage systems as a viable alternative to enhance grid flexibility and integrate RES effectively. The paper in [19] assesses the energy storage requirements of the Spanish energy plan, highlighting its significance for accommodating high levels of renewable energy. The work in [20] demonstrates the feasibility of a global, decentralized 100% renewable electricity supply at reasonable costs, achieved through the integration of photovoltaic (PV) power and onshore wind with storage to meet demand growth. Among various energy storage systems, the competitiveness and role of different energy storage technologies are compared and analysed in a real power system [21]. The importance of thermal energy storage and pumped hydro energy storage in addressing the challenges posed by increasing energy demand is highlighted in [22]. The author in [23] examines the economic feasibility of utilizing power-to-gas (PGP) generation to decarbonize the European electricity systems. The economic, technical, and environmental benefits of CAES for integrating energy storage into renewable-energy systems are underlined in [24, 25]. The authors in [10, 26] assess the feasibility and potential of integrating CAES with renewable energy to enhance dispatchability.
The authors in [27] reveal that, as the share of variable RES increases, the power capacity of electrical energy storage systems also increases in a linear fashion. Additionally, the energy capacity of storage systems exhibits exponential growth as renewable penetration rises. The study in [28] examines the influence of expanding energy storage capacity on power-system operations and generation capacity investments. To investigate this, a generation capacity expansion model is employed, incorporating comprehensive unit commitment constraints. The aim is to understand how increasing levels of energy storage capacity impact the optimization of power-system operations and the need for additional generation capacity investments. By analysing these factors, the authors provide valuable insights into the potential benefits and implications of scaling up energy storage capacity in the context of power-system planning and operations. The authors in [6] utilized capacity expansion optimization to examine the impact of energy storage systems (ESS) on the optimal generation portfolio and system performance in Italy’s power system. The study takes into account technology cost projections and CO2 emission restrictions, incorporating 11 years of wind, solar, and load data variations by focusing on the role of ESS, to understand how its integration influences the optimal mix of generation sources and the overall performance of the power system in Italy. The study in [29] explores the impact of load shifting associated with increased storage capacity in the power system. It investigates how changes in arbitrage, consumer and producer surplus, and social welfare contribute to the overall impact of larger storage amounts.
In [30], a novel load-shaping strategy based on energy storage and dynamic pricing in the smart grid has been developed. A methodology for conducting a monetary value analysis of battery energy storage systems (BESS) used for load levelling, controlling power, and peak shaving applications has been developed [31]. The primary objective of this value analysis is to identify and prioritize the application that offers the highest financial benefit to the BESS owner. By employing this methodology, the study aims to provide valuable insights into maximizing the economic advantages associated with BESS deployment.
In [32, 33], the economic analysis of CAES has been presented while considering the different types of renewable power generation. The study in [34] explores the operational efficiency of an integrated system comprising photovoltaic technology, hydrogen fuel cells, and CAES to facilitate the integration of supplementary intermittent energy sources into grid networks that are already at full capacity. In [35], an operational strategy for an integrated energy system (IES) focused on energy consumption and economic efficiency has been considered. It integrates adiabatic compressed-air energy storage (A-CAES) and integrated demand–response (IDR) theory using a two-layer optimization model. The improved scheduling method minimizes costs by coordinating the output of multiple energy sources while meeting system constraints, taking into account both IES operators and users. A new hybrid photovoltaic–liquid–air energy storage (PV-LAES) system has been proposed in [36] to provide solutions for low-carbon transition for future power and energy networks.
While considerable research has been dedicated to exploring the value and analysis of LDES technologies in the context of renewable energy resources for decarbonization, there is still a noticeable gap when it comes to understanding the role of LDES considering demand growth. Therefore, there is a need for further exploration and analysis to comprehensively understand the potential of LDES in meeting the challenges posed by demand growth in the energy sector.
This paper aims to assess the value of CAES as a cost-effective solution in the context of the deep decarbonization of a power system, as well as its potential for mitigating the variability of wind and solar-based power systems through bulk energy storage. In this work, we use California as a case study and calculate the value of the energy storage that the state will need as its load demand expands. The paper also studies the incorporation of nuclear power as a firm generation and, in this case, CAES is primarily utilized for extensive inter-seasonal energy storage, with a focus on discharging during the summer months. The presence of reliable nuclear generation in the lowest-cost optimization makes CAES important for meeting the increased demand during the summer season. Conversely, in the absence of reliable firm generation, CAES plays a critical role in addressing the intraday and inter-seasonal variability throughout the year.
The central question addressed in this study is the extent to which compressed-air battery storage can contribute value to a deeply decarbonized power system in California, considering increased load demand. The analysis presented here aims to offer valuable insights for policymakers by identifying the energy storage requirements necessary to attain California’s goal of zero-emissions electricity.
2. Materials and methods
Fig. 1 illustrates the energy model employed in this study. A lowest-cost analysis was conducted using current costs and existing technologies. The energy flows of various technologies are presented in Fig. 1. The macro-energy model (MEM) utilized hourly power dispatch for power generation and BESS. To ensure a reliable electricity supply, a high value of lost load ($10/kWh) was assigned. Hourly capacity factors for solar and wind were derived from the Modern-Era Retrospective analysis for Research and Application, Version 2 (MERRA-2) reanalysis data [37]. The solar capacity factors were calculated based on a single-axis tracking system with a tilt capability ranging from 0° to 45°, resulting in factors ranging from 0 to 0.915, with a mean of 0.269. Uniform system losses are considered across all power output levels, including inverter inefficiencies. The inverter is assumed to be sized to avoid any clipping or distortion of the direct current (DC) signal.
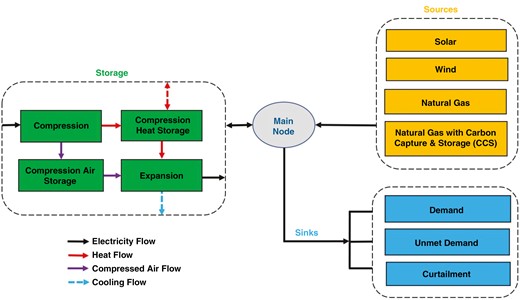
Energy flow diagram illustrating the macro-energy model (MEM) configuration utilized in this analysis.
Wind capacity factors were determined for a GE 1.6–100 turbine with a 1.6-MW nameplate capacity, resulting in factors ranging from 0.021 to 0.998, with a mean of 0.430 [38, 39]. The model inputs were based on the geographic regions with the top 25% generation potential. The base year for solar and wind resource data was 2020. The turbines in the model are characterized by specific speed parameters. The cut-in speed is set at 3 m/s, indicating the minimum wind speed at which the turbine starts generating power. The maximum output speed is defined as 12 m/s, representing the optimal wind speed range for the peak performance of the turbine. The cut-out speed is established at 25 m/s, denoting the wind speed threshold at which the turbine ceases operation for safety reasons.
For the demand data, hourly inputs were obtained from balancing authorities in the contiguous USA through the data portal of the US Energy Information Agency (Fig. 2). The data were cleaned and missing values were replaced using multiple imputation in the chained equations method. The accuracy of this technique was verified against known values in the dataset, resulting in a mean absolute percentage error of 3.7% and a small bias of 0.35%. The base year for the demand data was 2020. The detailed costs of all technologies are presented in Supplementary Tables S1 and S2.
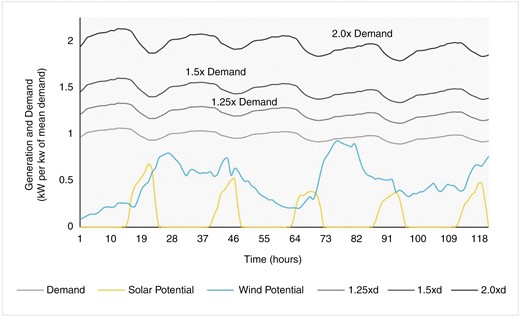
Wind and solar power generation for 5 selected days of 2021 with increased load demand (1.0–2.0 times the mean demand).
In this study, our central question focuses on how much value can be provided from compressed-air battery storage for a deeply decarbonized power system of California with increased load demand. As electricity demand tends to increase in the future, a study has estimated that the global electricity demand could increase by ≤57% by 2050 [37].
This lowest-cost analysis focuses on the requirement for battery energy storage to meet the future load demand in a deep decarbonized scenario. A case study of California with historical data of the year 2020 has been considered to do this analysis. This value of CAES is characterized by the total cost of the system. This study seeks to minimize system costs across varying load increments using CAES in an idealized California electricity system powered solely by solar and wind energy. Real-world historical demand and hourly weather data are employed but with the simplifying assumption of lossless transmission of the generated power to the load. The conditions under which CAES with the increased share of load demand (varying from one to two times the base load demand) has been assessed and it has been concluded that CAES alone cannot compensate for the variability in wind and solar with increased load demand. Additionally, a case study with the incorporation of firm generation (provided by nuclear power) has been evaluated with base-case technologies and CAES. It has been noted that firm nuclear can add substantial cost and main node curtailment reduction in all decarbonized scenarios.
3. Problem formulation
3.1 Objective function
The total system cost is minimized by varying the decision variables for generation and storage assets, subject to the fundamental physical constraints in Equation (1):
where
The fixed hourly cost of generation and storage technologies (wind, solar, nuclear and CAES) has been calculated by using the following expression:
where is the capital recovery actor, which has been calculated by using Equation (3):
where R is the appropriate discount rate and N is the economic lifetime.
3.2 Capacity constraints
3.3 Dispatch constraints
3.4 Storage energy balance constraint
3.5 System energy balance constraint
Equation (4) represents the capacity constraint for generation and storage technologies. Equation (5) constrains the renewable energy generation based on historical capacity factors, which are dependent upon the assumed technology and the input weather data. Equations (6–9) characterize the discharged energy, charged energy, and stored energy in the CAES. In this analysis, a steady-state operation of CAES has been assumed. is the loss rate for the energy stored in the CAES, τ is the storage charging duration (hours), and is the round-trip efficiency of the CAES. CAES energy balance constraints have been presented in Equations (10) and (11), and the overall system energy balance has been presented in Equation (12).
4. Results and discussion
In Fig. 3, the annual dispatch curves for the base case of lowest-cost electricity systems are simulated, considering current costs. Positive values represent the contribution of electricity sources to the grid, while negative values indicate points at which energy is flowing out of the grid. Panel (a) presents the annual dispatch of 2020 with daily time steps and the right two boxes [panels (b) and (c)] show hourly electricity dispatches for 5 continuous days of the simulation for 5 winter and summer days. The dispatch values in this analysis have been evaluated based on kilowatts (kW) per kilowatt of mean demand. The main node curtailment and demand serve as sinks of electricity, while wind and solar power generation act as electricity sources.
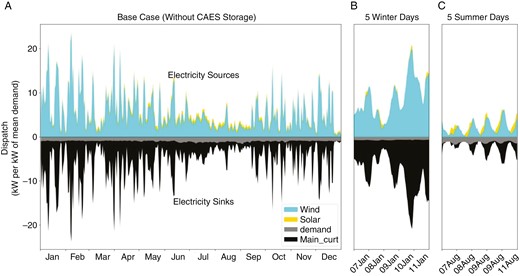
Dispatch curves for the base cases. The right two panels (b and c) show hourly electricity dispatches over a span of 5 consecutive days in the simulation year, encompassing periods 7–11 January (winter) and 7–11 August (summer).
In the initial base-case scenario, we have exclusively considered wind and solar power generation. However, it has become apparent that relying solely on these renewable sources is inadequate to fulfil the increased load demand. Additionally, there is a significant main node curtailment.
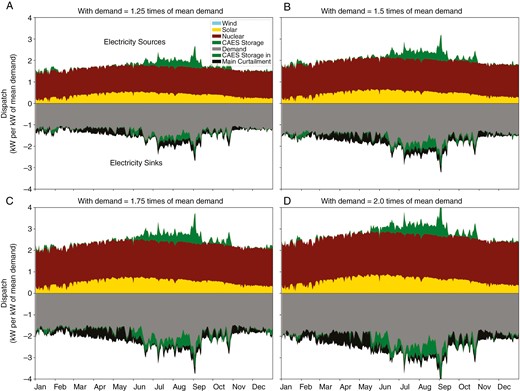
Fig. 4 depicts the simulated annual dispatch curves of the base case with CAES technology. CAES can play an important role in meeting the annual load demand. The overall main node curtailment has reduced a lot due to the integration of bulk CAES. Main node curtailment is high in summer due to the abundant renewable energy. Fig. 5 presents the dispatch with increased load demand varying from 1.25 to 2 times the base load demand. The main node curtailment increases with the increased load demand.
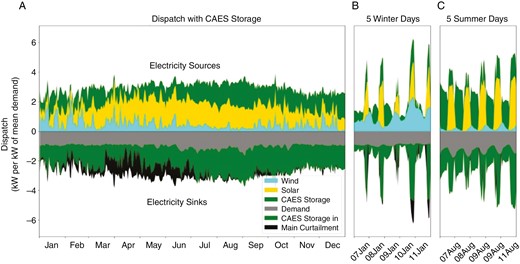
Dispatch curves for the base cases with CAES storage. The right two panels (b and c) show hourly electricity dispatches over a span of 5 consecutive days in the simulation year, encompassing periods 7–11 January (winter) and 7–11 August (summer).

Dispatch curves for base case (wind, solar) with CAES (a) with 1.25 times the mean demand, (b) with 1.25 times the mean demand, (c) with 1.75 times the mean demand, and (d) with 2 times the mean demand.
Fig. 6 presents the simulated annual dispatch curves of the base case with CAES technology and firm nuclear generation. In this study, nuclear has played the role of firm generation under decarbonization. With the incorporation of firm nuclear generation, all the wind and solar that would have been curtailed goes into the system, with the result that there is cheaper dispatchable power to meet the increased load demand, so there is no need to build more storage or other technologies in this case. Nuclear has added substantial value to the system to firm up the intermittency of renewable sources by reducing the proportion of curtailment. Otherwise, that renewable energy would have been curtailed. Additionally, nuclear power has also decreased the system cost significantly.
Fig. 7 illustrates the annual main node curtailment for the base-case technologies with two scenarios: one involving CAES and the other with the combination of CAES and nuclear power, while keeping the load demand constant. Without nuclear power, the main node curtailment experiences a substantial increase during summer due to the surplus generation of wind and solar energy. However, during winter, when solar potential is lower, the main node curtailment is comparatively lower for both cases. The integration of nuclear power with CAES storage results in a significant reduction of ≤36.8% in the main node curtailment. The main node curtailment and system cost variation with different levels of load have been presented in Supplementary Table S3.
Dispatch curves for base case (wind, solar) with CAES and nuclear power generation (a) with 1.25 times the mean demand, (b) with 1.25 times the mean demand, (c) with 1.75 times the mean demand, and (d) with 2 times the mean demand.
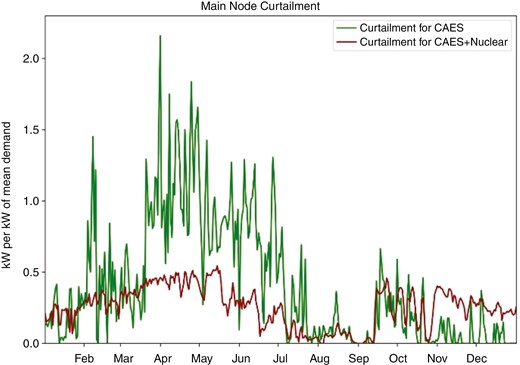
Annual main node curtailment for CAES and CAES with nuclear without any increase in load demand.
Fig. 8 presents the annual system cost, power capacity, and dispatch for different scenarios: the base-case technologies alone, the base-case technologies combined with CAES, and the base-case technologies with CAES and nuclear power. In Fig. 8a, the system cost is presented for each scenario. In the absence of CAES technology, the main node curtailment is high, resulting in a system cost of $0.560/kWh. However, with the integration of CAES and no increase in demand, the system cost decreases significantly by 75.38%. It is worth noting that the base case exhibits a high cost due to the inclusion of lost load expenses ($10/kWh). When CAES and nuclear power are combined with the base case, the system cost further decreases by 16.72%. This reduction is primarily attributed to the optimal mix of energy sources in the lowest-cost dispatch, where nuclear power takes a significant role and mitigates the need for wind power. The optimal combination in this scenario involves a mix of solar, nuclear, and CAES technologies.
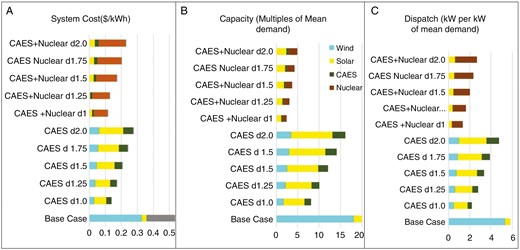
Annual system cost, power capacity, and dispatch for cases with base technologies, and base-case technologies plus CAES and nuclear. The availability of nuclear power eliminates the wind and reduces the system cost and capacity substantially.
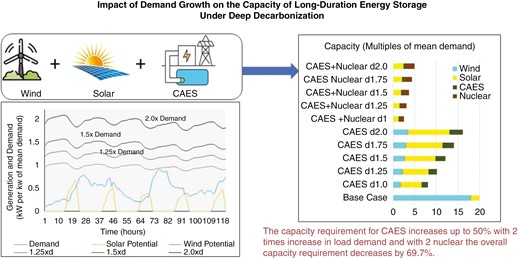
Fig. 8b presents the capacity of wind, solar, CAES, and nuclear power for all the cases. In the base case, the wind capacity is notably high. However, with the integration of CAES, the wind capacity decreases substantially, without any increase in demand. When the demand increases, the CAES capacity also increases. Nonetheless, the capacity of wind power does not experience as substantial an increase as the solar power capacity. In the scenario in which wind, solar, CAES, and nuclear power are combined, nuclear capacity dominates, resulting in an overall decrease in capacity requirements due to the inclusion of reliable generation from nuclear power. Without any increase in demand, the overall capacity requirement decreases by ≤69.7%.
Fig. 8c showcases the dispatch of all technologies for all the cases. When CAES is combined with wind and solar power, solar power dispatch takes priority. This is because California benefits from excellent solar power potential [40]. However, in the case of nuclear power combined with CAES and renewables, wind power is eliminated and the optimal mix comprises nuclear and solar power, with a small contribution from CAES. Overall, the figure demonstrates the dynamic interplay between different technologies, showcasing how their cost, capacities, and dispatches vary across different scenarios.
Fig. 9 provides insights into energy storage over the course of 1 year. In the base case with CAES (Fig. 9a), the maximum available CAES duration is 6.25 days (equivalent to 150.8 hours of mean demand). As the load demand increases, both the dispatch and capacity of CAES also increase, leading to a rise in stored energy. With a two-times increase in the load demand (Fig. 9b), the maximum available energy stored in the CAES extends to 12.5 days (equivalent to 301.7 hours of mean demand). Notably, when the load demand increases by 100%, the energy stored in the CAES rises by 50%.
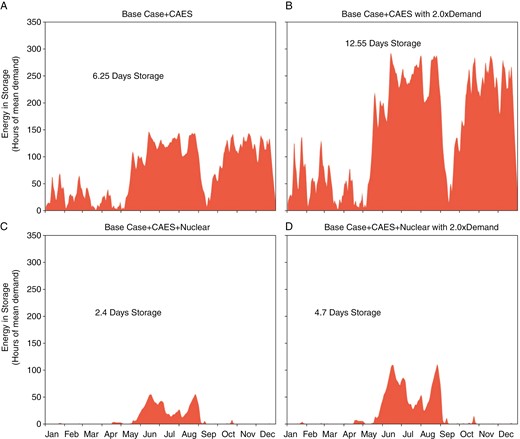
The timescale over which CAES stores energy. Energy in storage over the period of 1 year: (a) base-case technologies with CAES; (b) base-case technologies with CAES with two times the increment in demand; (c) base case + CAES + nuclear and (d) base case + CAES + nuclear with two times the increase in demand. Discharge time (hours) is defined by the optimal energy-to-power-capacity ratio of the storage technologies and the equivalent annual cycles (cycles/year) are defined by the total annual dispatch divided by the energy capacity of the storage technologies.
In Fig. 9c, the incorporation of nuclear power with the base-case technologies and CAES is shown. In this scenario, the dispatch of CAES decreases significantly, resulting in a reduction in stored energy of ≤61.6% (from 6.25 to 2.4 days). When the load demand is doubled (Fig. 9d), the maximum available CAES duration decreases to 4.7 days (equivalent to 113.5 hours of mean demand), representing a 62.4% reduction compared with the base case with CAES (Fig. 9b).
When nuclear power is incorporated, CAES is primarily utilized for extensive inter-seasonal energy storage, with a focus on discharging during the summer months. The presence of reliable nuclear generation in the lowest-cost optimization makes CAES important for meeting the increased demand during the summer season. Conversely, in the absence of nuclear power, CAES plays a critical role in addressing the intraday and inter-seasonal variability throughout the year (shown in Fig. 9a and b). Supplementary Fig. S1 presents the charging and discharging patterns of CAES for each month of the year in both the base case with CAES without any increase in load demand and the case with CAES + nuclear. Supplementary Figs S2 and S3 depict the timescale at which energy is stored using CAES alone and CAES with nuclear, respectively, under varying levels of increased load demand.
5. Conclusions
CAES can potentially add substantial value to electricity systems that are highly dependent on wind and solar power generation. The affordability and large capacity of CAES can help to effectively meet the challenging periods of high demand throughout the year. In the absence of other grid flexibility options, CAES may have a small niche compensating for extremely high renewable variability. In the studied lowest-cost analysis, firm nuclear power generation has been utilized to provide this flexibility but other forms of dispatchable power or storage could also play this ‘firming’ role. The lowest-cost analysis of CAES with wind and solar power generation with increased load demand results in increased system cost, CAES capacity, and dispatch under the decarbonized scenario. In idealized lowest-cost MEM, the incorporation of nuclear power generation reduces the CAES capacity requirements and reduces the main node curtailment and system cost substantially.
While this study primarily examines the context of California, it sheds light on a broader perspective. The utilization of CAES has the potential to offer significant advantages in balancing electricity systems for achieving deep decarbonization. However, it is important to recognize that the benefits of CAES storage may be constrained by various factors, including geophysical considerations, social dynamics, political influences, and economic aspects. Consequently, it is probable that electricity systems that are heavily reliant on wind and solar power generation will require a diverse array of dispatchable technologies to meet their needs effectively. By embracing a broader range of solutions, such systems can enhance their resilience and ensure a reliable transition to cleaner energy sources.
Nomenclature
- g
generation technology (wind, solar, natural gas)
- s
energy storage (redox flow battery, power-to-gas-to-power, Li-ion, compressed air, gravitational, pumped)
- from s
discharge from energy storage
- to s
charge to battery storage
- t
time step (in hours) starting from 1 to T
- C
kWh for storage
dispatch at time t
fixed cost ($/kWh)
variable cost ($/kWh)
fixed operation and maintenance ($/kWh)
- f
capacity factor
- i
discount rate
- n
years (project life)
time step (1 hour)
- C
energy capacity (kWh)
dispatch at time step t (kW)
demand at time step t (kW)
energy remaining in storage at time t (kWh)
capital recovery factor (1/year)
storage decay rate (1/hour)
round-trip efficiency
storage charging duration (hours).
Author contributions
Sara Ashfaq (Conceptualization [Equal], Formal analysis [Equal], Methodology [Equal], Software [Equal], Visualization [Equal], Writing—original draft [Equal]), ILYASS EL MYASSE (Formal analysis [Equal], Investigation [Equal], Methodology [Equal], Visualization [Equal], Writing—original draft [Equal]), Daming Zhang (Investigation [Equal], Supervision [Equal], Writing—review & editing [Equal]), and Ahmed S. Musleh (Investigation [Equal], Visualization [Equal], Writing—review & editing [Equal])
Conflict of interest statement
None declared.
Data availability
The MEM uses historical weather data with hourly time resolution over the contiguous USA for wind and solar input data. The model incorporates demand data with hourly time resolution from the US Energy Information Administration. The model code, hourly input data, and data visualization code are available on GitHub at https://github.com/ClabEnergyProject/MEM.
