


Abstract
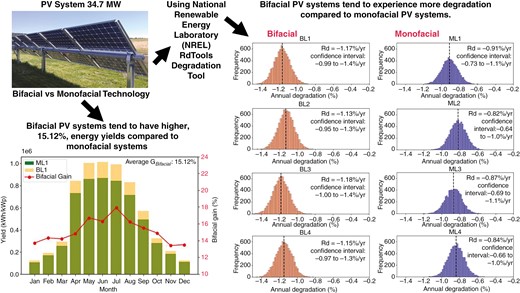
This paper presents an extensive analysis of the UK’s largest bifacial photovoltaic (PV) power plant, located in North Yorkshire. Commissioned in January 2020, this trailblazing facility, with a total installed capacity of 34.7 MW, is a benchmark for the evaluation of bifacial solar technology within the region. This pioneering study provides a thorough comparative assessment of bifacial and monofacial PV systems through a methodical investigation of their energy production, degradation rates, and spectral responses over a 4-year operational period. Our findings reveal that bifacial PV modules, distributed across four segments of the power plant, demonstrate a remarkable average power gain ranging between 15.12% and 17.31% compared with monofacial modules. Despite experiencing marginally higher annual degradation rates—1.17% for bifacial compared with 0.91% for monofacial systems—bifacial modules show superior resilience and energy yield, particularly during winter months when albedo effects are pronounced due to snow coverage. The study also highlights the strategic importance of spectral response analysis in optimizing PV performance. Bifacial modules have shown greater efficiency in capturing infrared radiation—a property that could be exploited to enhance overall energy yield under specific environmental conditions. The empirical data indicate a consistent performance of bifacial modules with an average normalized energy output clustering around the expected efficiency level. Therefore, the results of this study are pivotal for understanding the practical implications of deploying bifacial PV technology on a large scale. They provide valuable data for stakeholders in the solar energy sector, guiding future installations and innovations in solar panel technology.
1. Introduction
Solar photovoltaic (PV) technology has become a cornerstone of the renewable-energy revolution, offering a clean, sustainable solution to the world’s growing energy demands [1]. At its core, solar PV harnesses the Sun’s energy, converting it directly into electricity through semiconducting materials. This technology has traditionally been dominated by monofacial PV modules [2], which collect sunlight from a single surface facing the Sun. However, as the need for more efficient and cost-effective energy solutions intensifies, the evolution of solar PV has given rise to the bifacial module [3, 4]—a novel approach to solar energy capture that promises to redefine the efficiency standards of solar energy systems.
Bifacial PV modules, exemplified in Fig. 1, are ingeniously designed to capture sunlight not only on their front surface, but also on their rear side. This dual-sided design leverages both direct sunlight and the sunlight that reaches the rear surface through ground reflection and diffuse albedo [5, 6]. By absorbing light reflected from surrounding surfaces and the diffused components of sunlight, bifacial modules significantly enhance energy yield compared with their monofacial counterparts [7]. This feature is particularly advantageous in environments with high ground reflectivity or in installations that utilize engineered ground cover to boost reflectivity [8].
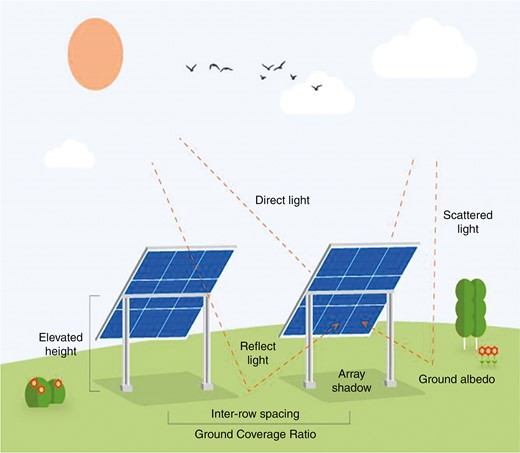
Illustration of bifacial PV system operation (https://www.iberdrola.com/innovation/bifacial-solar-panels).
The evolution of bifacial PV modules represents more than just an incremental improvement in solar technology; it signifies a paradigm shift in how solar energy is harvested. Unlike traditional monofacial systems [9] that are limited by their unidirectional light capture, bifacial systems exploit the full spectrum of solar irradiance. This is achieved through a combination of advanced cell technology and innovative panel designs, which optimize light absorption from multiple angles [10]. The result is a marked increase in energy production per unit area—a critical factor in maximizing the efficiency of solar installations.
Moreover, the integration of bifacial PV technology aligns seamlessly with the global push towards sustainable development. By enhancing the power output of solar installations without the need for additional land, bifacial PV systems contribute to a more efficient use of resources. This efficiency is not confined to optimal conditions; bifacial modules demonstrate resilience in a variety of environmental settings [11, 12], including regions with lower solar irradiance and urban landscapes [13] where space and light conditions are constrained.
The significance of bifacial PV modules extends beyond their operational advantages. Their deployment has profound implications for energy policy [14], economic planning [15], and environmental strategy [16]. By offering a more versatile and powerful solution for solar energy generation, bifacial PV systems can accelerate the transition to renewable energy sources, reduce dependency on fossil fuels, and mitigate the impacts of climate change. In the realm of bifacial PV technology, various configurations have been explored to maximize the efficiency and adaptability of solar energy systems. These include vertical [17, 18], tilted [19], and other innovative arrangements [20–22], each with its unique operational characteristics and applications.
The bifacial PV module technology has evolved rapidly, propelled by advances in material science and photovoltaic design. Recent studies highlight the significant improvements in the energy conversion efficiency of bifacial modules compared with traditional monofacial systems. For instance, recent work [23] demonstrated a 10%–25% increase in energy yield from bifacial modules under global real-world conditions. These findings underscore the importance of considering environmental variables such as ground albedo and installation angle to optimize performance. Moreover, technological innovations in module architecture have led to the development of hybrid bifacial and tracking systems, which dynamically adjust to the Sun’s position, further maximizing solar capture and efficiency [24–26]. Research by [27] shows that integrating bifacial technology with solar tracking systems can enhance annual power generation by ≤35% compared with fixed bifacial set-ups.
The adaptation of bifacial PV modules in urban settings also presents unique challenges and opportunities. Urban environments often suffer from limited space and variable Sun exposure due to shading from buildings and other structures. Innovative solutions, such as the use of transparent bifacial modules on skyscrapers, not only increase energy yield, but also contribute to building energy self-sufficiency. Recent work such as [28, 29] have reported successful pilot projects in which bifacial PV facades were incorporated into building designs, achieving a dual function of energy generation and aesthetic enhancement. Additionally, the environmental impact and sustainability of bifacial PV technology continue to be crucial areas of research. Recent life-cycle analyses by [30] indicate that the extended operational lifespan and enhanced efficiency of bifacial modules reduce the carbon footprint per unit of electricity generated, supporting the environmental benefits of this technology.
Future prospects for bifacial PV technology involve enhancing the material properties of PV modules to withstand environmental stressors such as temperature fluctuations and ultraviolet exposure, which can affect long-term reliability and performance. The development of new semiconductor materials that can offer higher light absorption and conversion efficiency is also a key focus in current research [31].
This work stands at the forefront of solar energy research, marking a significant leap in the understanding of bifacial PV system performance within the temperate climate of the UK. The key novelty of this study lies in its comprehensive analysis of the UK’s largest bifacial PV power plant, offering an unprecedented comparison of energy yields between bifacial and monofacial PV systems over a multi-year period. Through meticulous data collection and analysis, this research identifies an average power gain of 15.12%–17.31% for bifacial systems over their monofacial counterparts—a finding that substantiates the superiority of bifacial technology in terms of efficiency and resilience, particularly under high-albedo conditions. Moreover, the paper contributes significant insights into the degradation rates of bifacial modules, highlighting a sustainable degradation rate of <1.2% annually, despite their marginally higher initial rates compared with monofacial panels. The spectral response analysis, revealing greater efficiency in the infrared spectrum, provides compelling evidence of the potential for optimized energy yield across various environmental conditions. These contributions not only pave the way for the informed adoption and optimization of bifacial PV systems, but also set a benchmark for future solar energy installations and related policy development.
2. Examined PV power plant
This study focuses on a pioneering PV power plant located in North Yorkshire, York, UK. Commissioned in January 2020 after its installation in 2019, this plant stands out as one of the earliest and most substantial bifacial solar systems in the UK. As illustrated in Fig. 2a, the layout of the plant is presented, while Fig. 2b offers a detailed view of the bifacial panels used. The facility boasts 91 392 bifacial PV modules, culminating in a substantial net capacity of 34.7 MW.
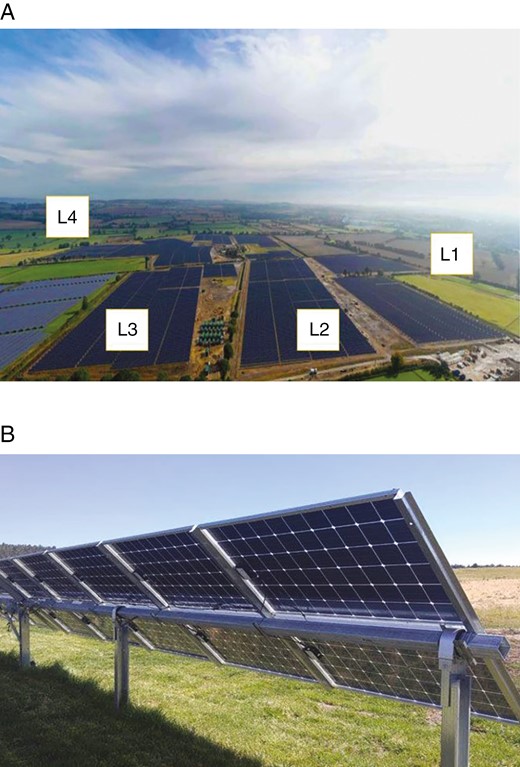
The examined 34.7-MW PV power plant. (a) Aerial image of the entire system; (b) closer look at the bifacial panels installed.
The structure of the PV power plant is segmented into four primary sections, as depicted in Fig. 2a. Each segment contributes differently to the total capacity of the plant, with respective outputs of 8.1, 8.7, 10.2, and 7.7 MW. Detailed electrical specifications of the solar PV panels at this site are consolidated in Table 1. In addition to the bifacial panels, the plant includes monofacial PV panels across all four sections, as indicated in Fig. 2a. These monofacial arrays consist of 165 panels each, with an individual capacity of 65.175 kW, detailed alongside their electrical characteristics in Table 1. The incorporation of monofacial panels serves a critical role in facilitating comparative data analysis between the two panel technologies, thereby shedding light on their respective performance efficiency and degradation over time.
Summary of the electrical parameters of the PV modules under standard test conditions.
| Parameter | Bifacial PV modules | Monofacial PV modules |
|---|---|---|
| Maximum power (Pmax) | 375 Wp | 395 Wp |
| Voltage at maximum power (Vmpp) | 39.9 V | 30.98 V |
| Current at maximum power (Impp) | 9.4 A | 12.76 A |
| Open-circuit voltage (Voc) | 47.7 V | 36.84 V |
| Short-circuit current (Isc) | 9.91 A | 13.66 A |
| Panel efficiency | 18.8% | 20.2% |
| Tilt angle | 38° | 38° |
| Cell type | Monocrystalline passivated emitter and rear contact (PERC) half-cell and double glass technology | Monocrystalline monofacial silicon cells |
For a comprehensive analysis presented in this paper, the study divides the assessment based on the four locations of the plant. Comparisons with monofacial panels are conducted by adjusting their capacity to match that of the corresponding bifacial systems. For instance, in Location 1, a scaling factor of 124.280 was applied to equate the monofacial capacity to 8.1 MW of the bifacial system. This methodology enables a detailed evaluation of the performance gains and potential declines associated with each panel technology within the diverse operational environments of the plant.
Fig. 3 presents a comprehensive overview of the solar PV installations at the power plant, illustrating the configurations and components of each section within the facility. The updated figure delineates both the bifacial and monofacial PV systems, now including a schematic of their electrical connections, as well as specifying the exact number of strings and inverters dedicated to each system. The bifacial PV systems—denoted as BL1, BL2, BL3, and BL4—are shown with their corresponding capacities, ranging from 7.7 to 10.2 MW, and are connected in series with 25 bifacial panels per string. The number of strings and inverters for these systems have been clearly indicated, with BL1 having 864 strings and 87 inverters, BL2 with 928 strings and 93 inverters, BL3 with 1088 strings and 109 inverters, and BL4 with 822 strings and 83 inverters. Similarly, the monofacial systems, labelled as ML1, ML2, ML3, and ML4, are each depicted with a consistent capacity of 65.175 kW and are connected to six strings per system, with all strings converging onto a single inverter. This layout is replicated across the four locations. Additionally, scaling factors are provided, offering a quantitative measure for comparing the output of monofacial systems against the bifacial ones.
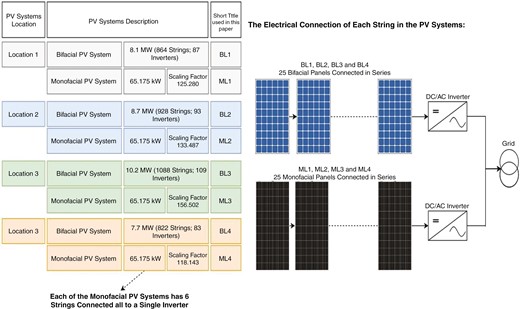
Overview of PV system configurations by location, highlighting bifacial and monofacial PV systems with corresponding capacities and scaling factors for comparative analysis.
3. PV degradation estimation procedure
In the context of PV systems, degradation refers to the loss of power output of solar panels over time due to various factors such as environmental exposure, material fatigue, and mechanical stresses [32, 33]. The rate of this degradation can be quantified using the term ‘’, which stands for the annual degradation rate. It is typically expressed as a percentage decrease per year.
Referring to the figures provided as examples, Fig. 4a displays the normalized energy output of a PV system over time. The normalization process typically involves adjusting the measured energy output to account for known factors that can affect performance, such as temperature, irradiance, and other environmental conditions. The purpose of normalization is to isolate the degradation signal from other variables that can influence energy production. Fig. 4b illustrates the annual degradation rate and the confidence interval. The histogram shows the distribution of calculated degradation rates from multiple samples or periods. The peak of the histogram represents the most probable degradation rate and the dashed line indicates the mean Rd value across all samples. In this case, Rd is calculated to be –1.12% per year.
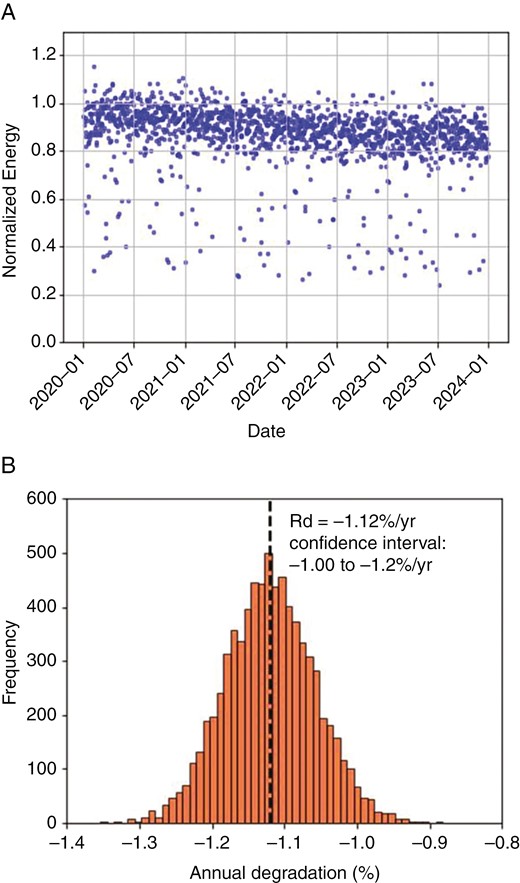
Degradation rate estimation for PV data. (a) Normalized energy output over time for a PV system, illustrating variability and trending of power production from 2020 to 2024; (b) histogram of annual degradation rates, displaying the distribution of estimated degradation and highlighting the mean rate () with a confidence interval.
The confidence interval, in Fig. 4b, provides a range within which the true degradation rate is expected to lie with a certain level of confidence, often 95%. In the example given, the confidence interval is from –1.00% to –1.2% per year, meaning that we can be 95% confident that the true degradation rate falls within this range. The confidence interval is calculated using statistical methods, often involving the standard deviation of the sample degradation rates and the size of the sample set.
In this study, the National Renewable Energy Laboratory (NREL) RdTools degradation model [34, 35] has been used and the annual degradation rate is computed using a time-series analysis of the normalized energy production data. The general approach for estimating involves the following steps: data collection—assemble time-series data of energy output, irradiance, and temperature; normalization—adjust the energy data to control for irradiance and temperature to discern the true degradation trend from operational data; filtering—apply filters to remove data points that are not representative of normal operation (e.g. system outages, snow coverage); aggregation—aggregate the normalized data into consistent time periods (e.g. weekly, monthly); and degradation calculation—apply a linear regression to the aggregated data to determine the slope, which represents the annual rate of change in normalized performance.
The slope obtained from the regression gives the rate of change in normalized energy over time, which is the degradation rate of the system, calculated using Equation (1). The statistical significance of and the confidence interval is typically assessed using the standard errors of the regression coefficients:
where is the normalized energy (dimensionless) at time (in years), is the intercept of the regression line (dimensionless), is the slope of the regression line (%/year), representing the degradation rate, and is the error term (dimensionless).
In addition, for comparison purposes, the calculation of the annual power production uses Equation (2), considering and the gain of the bifacial PV systems. is the annual power production, is the rated power capacity of the PV system measured in Watts (W), is the performance gain (dimensionless) of the bifacial system over the monofacial system, and is the number of years since PV installation. can also be improved to include the actual corresponding monofacial system using Equation (3), which computes the actual gain of the bifacial system compared with its corresponding monofacial system (e.g. BL1 and ML2, respectively), where is the degradation rate specific to the bifacial PV system measured in %/year and is the degradation rate specific to the monofacial PV system measured in %/year.
These equations are crucial for quantifying the benefits of bifacial PV systems compared with traditional monofacial systems. They consider not only the inherent efficiency improvements of bifacial designs, but also the impact of degradation over time, providing a more comprehensive picture of long-term performance. Equation (3) is particularly important for stakeholders who are considering the upgrade from a monofacial to a bifacial system, as it provides a direct comparison of performance gains.
4. Results
4.1 Normalized PV energy production
The analysis of normalized energy production from PV systems over the period from January 2020 to December 2024 revealed distinct performance patterns between bifacial and monofacial modules, as can be seen in Fig. 5. For instance, the data represented in Fig. 5a illustrate the normalized energy output for the bifacial PV systems, BL1 through to BL4. Despite the inherent fluctuations due to environmental variables, there is a noticeable consistency in energy production across all four bifacial systems. The normalized energy values predominantly cluster around the 1.0 mark, indicating that these systems frequently operated at their expected efficiency level. Minor deviations above and below the normalized value of 1.0 suggest responsive adjustments to varying sunlight conditions. The overlay of the data points does not show a significant decline in performance over the observed period, which underscores the durability and stable output of the bifacial systems.
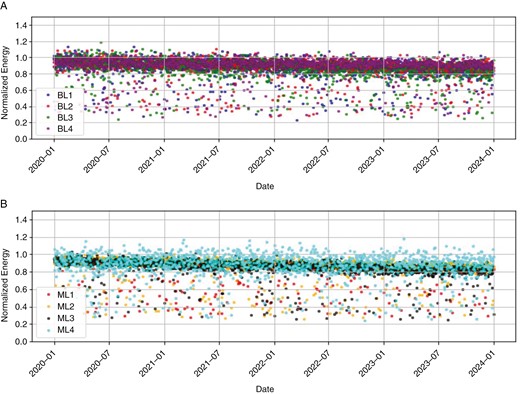
Normalized energy of all examined PV systems. (a) Bifacial, (b) monofacial.
In contrast, Fig. 5b presents the normalized energy for monofacial PV systems, designated as ML1 through to ML4. The data dispersion is notably denser, primarily concentrated between the normalized energy values of 0.6 and 1.2. This indicates a higher degree of variation in the day-to-day performance of the monofacial modules. While the average normalized energy hovers at ~1.0, like the bifacial systems, the monofacial systems exhibit a broader spread of values, reflecting a potentially less consistent energy output. It is also observable that the clustering of data points shows a slight downward trend, which could be indicative of gradual degradation or other operational inefficiencies.
4.2 Degradation rate estimation
The degradation rates of the PV systems were statistically analysed to quantify the annual loss in efficiency. Histograms, as shown in Fig. 6, were constructed for both bifacial (BL1 to BL4) and monofacial (ML1 to ML4) systems to visualize the frequency distribution of the calculated annual degradation percentages.
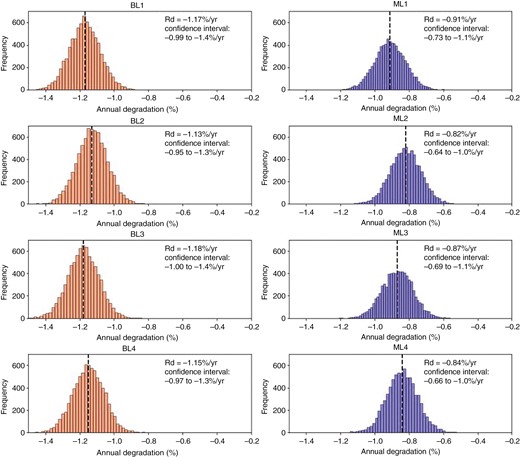
Annual year-to-year bifacial (BL1 to BL4) and monofacial (ML1 to ML4) systems degradation.
The bifacial PV systems analysed in the study exhibited more pronounced annual degradation rates when compared with the monofacial systems. System BL1 presented a degradation rate of –1.17% per year with a confidence interval stretching from –0.99% to –1.4% per year. Following closely, BL2 had a degradation rate of –1.13% per year with the confidence interval set between –0.95% and –1.3% per year. The third bifacial system, BL3, showed a slightly higher degradation rate of –1.18% per year, with a confidence interval of –1.00% to –1.4% per year. The final system, BL4, was determined to have a degradation rate of –1.15% per year, with its confidence interval ranging from –0.97% to –1.3% per year. These results indicate a consistent pattern of degradation across the bifacial systems, with the annual decrease in efficiency being slightly above 1% for all units. The relatively narrow confidence intervals underscore a statistically reliable estimate of the degradation rates for these bifacial systems.
The histograms for the bifacial systems exhibit a symmetrical distribution around their respective mean degradation rates, suggesting a consistent degradation behaviour across multiple years. The narrowness of the confidence intervals indicates a high level of precision in the degradation rate estimations for these systems.
The monofacial PV systems presented degradation rates that were assessed through statistical analysis. ML1 demonstrated a degradation rate of –0.91% per year, accompanied by a 95% confidence interval that ranged from –0.73% to –1.1% per year. For ML2, the degradation rate was slightly lower at –0.82% per year and the confidence interval was observed to be between –0.64% and –1.0% per year. The third system, ML3, exhibited a degradation rate of –0.87% per year, with a confidence interval spanning from –0.69% to –1.1% per year. Lastly, ML4 showed a degradation rate of –0.84% per year, with a confidence interval that fell between –0.66% and –1.0% per year. These rates, while varied, indicate a general trend of less pronounced annual efficiency loss in monofacial systems compared with their bifacial counterparts, as evidenced by their relatively tight confidence intervals that suggest a consistent degradation behaviour.
The monofacial PV system degradation rates are notably lower than those of the bifacial systems. The histograms are also well defined and symmetrical, but the spread of the distribution is slightly wider than that of the bifacial systems, which could indicate a more varied degradation behaviour. In comparing the two types of systems, bifacial modules exhibit a marginally higher rate of degradation than monofacial modules. However, both systems maintain a degradation rate of <1.2%/year, suggesting that they both offer robust performance over the analysed period. The relatively tight confidence intervals for both systems underscore the reliability of the degradation rate estimates.
The observed higher degradation rates in bifacial PV systems compared with monofacial systems can be attributed to several factors that are unique to the design and operation of bifacial modules. Bifacial PV systems are designed to capture sunlight from both sides, with the rear side harnessing reflected and diffused light. This dual-sided approach to energy capture is influenced by a multitude of factors that can contribute to their degradation:
Albedo effect: the efficiency of bifacial systems heavily relies on the albedo, or the ground reflectivity. Surfaces with higher reflectivity can enhance the performance of bifacial modules by reflecting more light onto the rear side. However, if the albedo is lower than expected, or if it decreases over time due to changes in ground cover or accumulation of dirt, this can lead to less energy being captured [36] and, consequently, a perceived higher rate of degradation.
Shading: bifacial modules are more susceptible to shading effects [37], not only from the front, but also from the rear. Shading can occur due to nearby vegetation, structures, or even the mounting system itself. Since the rear side is expected to contribute significantly to the overall energy yield, shading can disproportionately affect the performance and longevity of bifacial modules.
Rear-side vulnerability: the rear side of bifacial modules can be exposed to a variety of stresses that monofacial modules are not [38]. This includes potential mechanical damage during installation and maintenance, as well as the accumulation of dust and debris, which can be more challenging to clean and can affect the ability of the rear side to capture reflected light.
Thermal stress and environmental factors: bifacial PV systems experience more intense thermal stresses due to their dual-sided exposure [39]. The rear side, subjected to different environmental conditions than the front, undergoes variable temperature changes from absorbed and reflected light [39, 40]. This can lead to thermal fatigue, accelerating material degradation and affecting electrical connections.
4.3 Bifacial PV power gain
The power gain from bifacial PV systems is a critical aspect of their performance assessment, distinguishing them from traditional monofacial systems. This section of the results leverages the degradation rates (Rd) previously calculated for both bifacial and monofacial systems and employs Equation (3), which is designed to account for the power output of a PV system, adjusting for the rated power and degradation over time. This approach allows isolation of the additional energy capture attributable to the bifacial design, which collects sunlight on both the front and rear surfaces. The bifacial gain is thus a measure of the percentage increase in yield due to this dual-sided capture capability.
The comparative monthly energy yield data for bifacial and monofacial systems depicted in Fig. 7 encapsulates an average of the yields from 2020 through to 2023, illustrating the monthly performance over a 4-year period. For example, each January value represents the average yield for all January months within the time span and similarly for the other months. This averaging is important as it accounts for year-to-year variability in environmental factors and allows a more robust assessment of the bifacial gain, which fluctuates throughout the year. In the figure, the orange bars denote the average yield of the bifacial systems, while the green bars show the average yield for the monofacial systems for the respective months across the 4 years. Overlaying these bars, the red line traces the average bifacial gain percentage, reflecting the additional energy captured by the bifacial systems. This approach to data representation ensures that the impacts of annual degradation, as estimated from year to year in the previous section, are integrated into the monthly performance analysis.
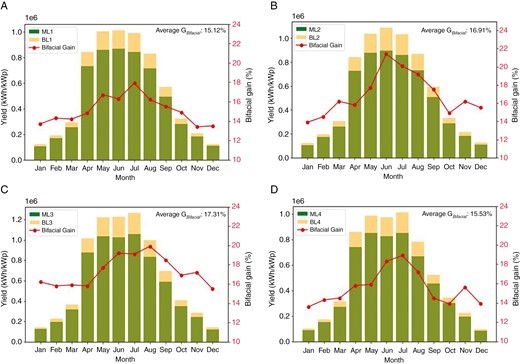
Comparative monthly energy yield and bifacial gain. (a) BL1/ML1, (b) BL2/ML2, (c) BL3/ML3, (d) BL4/ML4.
The results in Fig. 7 show that the bifacial systems consistently outperform their monofacial counterparts, with the average gains for the pairs being 15.12% for BL1/ML1, 16.91% for BL2/ML2, 17.31% for BL3/ML3, and 15.53% for BL4/ML4. The summer months show the highest gains, which are linked to optimal conditions for bifacial modules, including longer daylight hours, a higher solar angle, and increased albedo from surfaces that reflect sunlight to the rear side of the PV modules. This seasonal trend is consistent with the physical principles that govern the performance of bifacial modules.
Moreover, these results might reflect the compounded benefits of bifacial systems in regions with significant snowfall. Snow has a high albedo and, when present on the ground, it can significantly increase the amount of light reflected onto the rear side of bifacial panels, boosting their output during times when traditional monofacial panels might underperform due to partial shading or soiling. The year-to-year consistency of this gain, despite the inherent annual degradation of the PV systems, underscores the resilience of bifacial technology under various seasonal conditions and its potential for higher energy yield over the lifespan of the solar installation.
4.4 Spectral response analysis
The outdoor measurement campaign conducted at the PV plant near York, UK, provided a seasonal analysis of the spectral response of bifacial PV modules. The experiments were carried out under clear-sky conditions to minimize atmospheric interference and acquire accurate data. The choice of a clear day was crucial in ensuring minimal atmospheric interference, thereby enabling a more accurate assessment of the performance of the modules.
The experiment was set up with specific conditions in mind. The air mass was maintained at AM1.5—a significant factor in spectral measurement, as it closely resembles the standard solar spectrum. The ground surface, covered with thick soil, played a vital role in determining the albedo, which directly affects the amount of light reflected onto the rear side of the bifacial modules. For measurement accuracy, the instrumentation, which included pyranometers and a spectroradiometer, was placed at heights ranging from 1.3 to 1.9 metres above ground level, as detailed in Fig. 8.
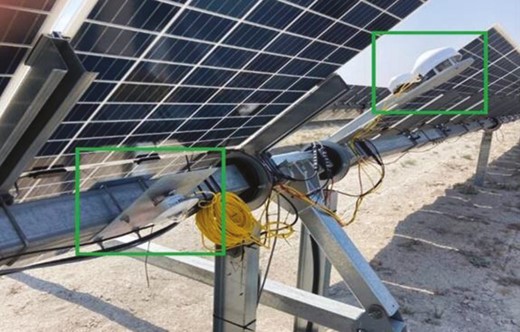
Experimental set-up employed for the measurement of spectral albedo. Two pyranometers are employed on the panel to measure the back and front solar irradiance.
Two pyranometers were utilized to continuously measure the global horizontal irradiance on both the front and rear sides of the PV modules. The spectroradiometer, on the other hand, was tasked with capturing the spectral distribution. In the first 10 minutes of the experiment, it recorded the front-side spectrum and, in the latter half, it switched to measuring the rear-side spectrum. The data-collection frequency was set at 10-second intervals for both types of instruments, ensuring a rich dataset for subsequent analysis.
The measurements from the front and rear sides were normalized against the corresponding irradiance measurements obtained from the pyranometers. This step was essential to accurately compare and analyse the spectral response of the modules under varying conditions. The spectral albedo was calculated using Equation (4), which incorporated the normalized spectral data and was tailored to the specific conditions of the experiment:
where and are the rear-face and front-face horizontal spectral irradiance at corresponding wavelength , measured in W/m2/nm, respectively.
The experimental data presented in Fig. 9 capture the normalized spectral irradiance measured at both the front and rear faces of bifacial PV modules, alongside the corresponding spectral albedo. The measurements encompass a broad wavelength range from 200 to 2000 nm, providing a comprehensive spectral profile.
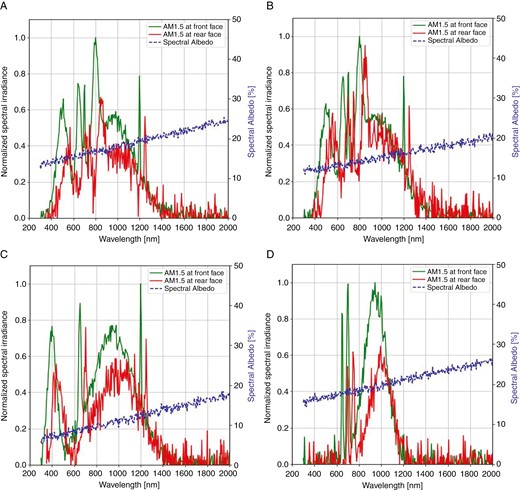
Normalized spectral irradiance on the front and rear faces of a bifacial PV, along with the measured spectral albedo. The front-face irradiance is characterized by a pronounced peak in the visible spectrum, indicative of the solar spectrum under standard AM1.5 conditions, whereas the rear-face irradiance shows significant variability, reflecting the complex environmental interactions affecting the rear-side energy capture. Panels (a), (b), (c), and (d) correspond to measurements taken in spring, summer, autumn, and winter, respectively.
Spring measurement: the spring measurement took place on 15 April 2023, from 11:00 a.m. to 11:20 a.m. The normalized spectral irradiance for this season, as depicted in Fig. 9a, shows heightened activity in the visible range, indicating a robust response to the solar angle and clearer atmosphere of the spring.
Summer measurement: on 28 July 2023, between 12:30 p.m. and 12:50 p.m., the summer data (Fig. 9b) were collected, showcasing the peak performance expected during the longest days of the year. This data of the season show a pronounced peak in the visible spectrum on the front face, aligning with the highest efficiency range for silicon PV cells.
Autumn measurement: the autumnal data collection occurred on 21 October 2023, from 10:30 a.m. to 10:50 a.m. Fig. 9c illustrates the beginning of the tapering-off of the irradiance as the days shorten and the Sun’s angle decreases.
Winter measurement: finally, on 16 January 2024, from 10:00 a.m. to 10:20 a.m., the winter measurements were taken, as represented in Fig. 9d. The data indicate a significant increase in albedo due to snow cover, which enhances the rear-face performance despite the low solar angle.
Across all seasons, the spectral irradiance at the front face exhibits a peak in the visible light range, while the rear face shows greater variability due to environmental reflections (Fig. 9). The spectral albedo is generally stable across the visible spectrum but increases in the infrared, particularly in winter when snow cover is present, suggesting a more reflective ground cover in this region.
These seasonal variations in spectral irradiance and albedo underscore the necessity for considering environmental dynamics in the operation and optimization of bifacial PV systems. The findings corroborate the influence of ground cover and seasonal weather patterns on the energy-capture capabilities of the rear side of bifacial modules. To fully capitalize on the bifacial design, adaptive strategies and continuous monitoring are recommended, particularly in regions with pronounced seasonal changes, to ensure efficient energy production all year round.
The experimental findings highlight the nuanced interplay between spectral irradiance and albedo in determining the performance of bifacial PV modules. While the front face primarily captures direct solar radiation, the efficiency of the rear face is heavily influenced by reflected light, dependent on ground surface characteristics. This underscores the importance of considering local environmental factors, such as ground cover and weather patterns, in the design and placement of bifacial PV systems.
Table 2 offers a comprehensive overview of the seasonal fluctuations in spectral irradiance and albedo characteristics. In the spring, heightened spectral irradiance on the front face reflects the increased solar intensity and longer daylight periods, while the rear-face irradiance and moderate albedo suggest efficient utilization of both direct and reflected light, likely augmented by the fresh vegetative ground cover of the spring. The summer months exhibit peak front-face irradiance due to the zenith of direct solar exposure, contrasting with a diminished albedo indicative of the drier, less reflective ground surfaces typical of the season. As autumn sets in, the data reveal a reduction in both front-face and rear-face irradiance, correlating with the decreasing solar angle and daylight duration; however, an uptick in albedo is noted, possibly due to the reflective properties of the autumnal fallen leaves.
Comparative analysis of seasonal variations in normalized spectral irradiance and albedo for the examined bifacial PV modules.
| Season | Wavelength (nm) | Front-face irradiance | Rear-face irradiance | Spectral albedo | Reason for variation |
|---|---|---|---|---|---|
| Spring | Visible range | High | Moderate | Moderate | Increased daylight, moisture, fresh vegetation |
| Infrared | Moderate | Low | Moderate–high | Seasonal growth reflecting infrared radiation (IR) light | |
| Summer | Visible range | Very high | High | Low | Direct sunlight at peak, dry conditions |
| Infrared | High | Moderate | Low–moderate | Lower reflective properties of dry ground | |
| Autumn | Visible range | Moderate | Moderate | Moderate–high | Lower solar angle, less direct light |
| Infrared | Moderate | Low | High | Fallen leaves increase reflectivity | |
| Winter | Visible range | Low | Low | High | Low solar angle, snow increases reflectivity |
| Infrared | Low | Very low | Very high | High IR reflectivity of snow enhances albedo |
The winter period shows the lowest front-face and rear-face irradiance, corresponding to the minimal solar elevation and shortened daylight; conversely, the spectral albedo is significantly enhanced, particularly in the infrared spectrum, which is likely attributable to the high reflectivity of snow-covered ground. The tabulated data underscore the substantial impact of seasonal environmental changes on the performance of bifacial PV modules and highlight the necessity for strategic design and placement to optimize energy capture throughout the year.
The collective findings from this comprehensive experiment not only highlight the significant influence of ground cover and climatic patterns, but also advocate for the adoption of adaptive operational strategies. These strategies, tailored to leverage the seasonal shifts in environmental conditions, are imperative for optimizing the energy yield of bifacial PV modules. Such an adaptable approach is key to harnessing the full potential of bifacial technology, ensuring that these systems can deliver efficient energy production consistently, irrespective of the changing cloak of the seasons.
5. Conclusion
This comprehensive study has meticulously assessed the UK’s largest bifacial solar PV power plant and provides a rich data set underpinning the robust potential of bifacial technology. Our investigation confirms that bifacial panels, with their innovative design to harness sunlight from both surfaces, deliver a significant energy yield advantage. Specifically, the power gain over monofacial counterparts spans a notable range from 15.12% to 17.31% across different sections of the facility. Even with the slightly elevated annual degradation rates of ≤1.18% for bifacial systems compared with a maximum of 0.91% for monofacial ones, the overall performance remains compellingly robust, demonstrating <1.2% degradation annually. These findings hold considerable promise for stakeholders in solar energy, affirming the viability of bifacial systems in large-scale applications. The research has also elucidated the enhanced spectral response of bifacial modules, especially in the infrared range, which suggests a significant scope for optimizing power generation under varied environmental conditions. Seasonal performance variations, notably under high-albedo conditions such as snow, indicate that bifacial technology not only withstands diverse climatic challenges, but also thrives under them, outperforming traditional monofacial panels.
In light of these findings, we strongly recommend the broader adoption of bifacial technology in solar installations. Future endeavours should focus on optimizing ground albedo and implementing adaptive tracking systems to further leverage the dual-capture capability. Additionally, studies should explore the long-term operational strategies that can mitigate the slightly higher degradation rates of bifacial panels, ensuring sustained performance. Further research should also be directed towards understanding the full economic and environmental benefits of bifacial technology over extended periods. The exploration of new materials and coatings to enhance the rear-side capture of light could play a pivotal role in the continued innovation of PV systems. As the solar industry moves towards more efficient and sustainable solutions, the insights gained from this study will undoubtedly influence future designs and policymaking in renewable-energy infrastructure.
Conflict of interest statement
None declared.
Funding
This research was supported by the EPSRC IAA under the project ‘Next-Generation Vertically Mounted Bifacial Solar Panels: Conceptualization, Field Testing, and Energy Performance Monitoring’.
Data availability
Data will be made available on reasonable request to the corresponding author of the paper.
