


Abstract
The power sector has substantial carbon emissions reduction potential that could achieve the new nationally determined contribution target in 2030 by increasing low-carbon technologies, e.g. variable renewable energy sources and electric vehicles (EVs). Therefore, two approaches were suggested in this work. In the first approach, Thailand’s power sector was modelled by using PLEXOS software to find the impact of the high penetration of variable renewable energy (RE) and EV charging load for the projected year 2030. The second approach proposed a demand–response and energy storage system solution with carbon pricing in the model to assess the targets. As a result, the electricity demand from charging EVs will cause a new peak demand at night, while the high variable RE penetration will cause curtailment in the power system due to excess supply at noon. Therefore, Thailand’s power sector has the potential for carbon emissions reduction by 45% with clean energy technologies, which could increase to 68% with carbon pricing, easily achievable by the nationally determined contribution target in 2030. However, these benefits could only be derived if various entities involved in the energy regulatory, transport and power sectors coordinate to implement the required technological and financial policies.

Introduction
The world has set a target to mitigate greenhouse gas emissions that are subject to keeping global warming below 1.5C or 2C. The remaining gap in the amount of CO in the conditional and unconditional nationally determined contribution (NDC) scenarios reported by the United Nations Environment Programme needs to be reduced by 15 and 32 Gt CO in 2030, which could keep global warming below at least 2C and 1.5C, respectively [1]. Thailand, a developing country, has submitted the first goal to mitigate CO emissions to 20% and 25% from business as usual (BAU) (excluding climate policies intervention) in 2030 as unconditional and conditional NDCs [2], respectively. At the United Nations Climate Change Conference of the Parties (COP26) in Glasgow (on 1 November 2021), the prime minister of Thailand announced that the new target of increasing the NDC plan by in 2030 from BAU to reach carbon neutrality in 2050 is an ambitious target for the country [3].
Thailand’s power sector had 164 828 and 212 049 GWh of electricity consumption in 2010 and 2019, respectively, which increased by 28% [4]. Moreover, from this trend, consumption could increase to 300 000 GWh in 2030. Natural gas and coal are the main sources of generation with shares of 56% and 18%, respectively, in 2019. This causes an advantage of electricity demand in terms of high energy security and reliability in the power system. However, fossil fuel generation caused high CO emissions, the highest proportion of the overall sectors.
Meanwhile, clean fuel energy still made up only a 25% share of the overall, consisting of hydropower (3%), abroad (12%) and renewable (10%). The Long-term Low Greenhouse Gas Emission Development strategy aims to increase low-carbon technologies, specifically in variable renewable energy generation [5]. Therefore, in the future, variable renewable energy generation will be more integrated than currently in the power system because this sector is one of the important sectors that can cause reduction of greenhouse gases and carbon neutrality. However, this solution can lead to various problems, such as volatile generation due to its intermittent nature [6].
The country needs to import a large amount of crude oil from other countries, which provides energy security. Its price strongly depends on world situations such as war, supply chain issues or financial crisis. Furthermore, the transportation sector consumed 40% of total oil consumption between 1996 and 2019 [7]. Furthermore, this sector has emitted a large amount of CO in the country due to the use of internal combustion engines for its automobiles—a persistent problem similar to the power sector. An electric vehicle (EV) is a solution that uses electricity instead of an internal combustion engine vehicle, which can be called electrification. Between 2015 and 2020, the number of hybrid and battery EVs registered in Thailand increased dramatically, reaching 400% growth [8].
In addition, carbon pricing is the mechanism to add the external emission cost that can be a fee or incentive for polluted and clean energy technologies [9, 10]. There are only voluntary carbon reduction programmes, similar to those in the Association of Southeast Asian Nations (ASEAN) region [11]. For instance, many developers can apply their reduction projects to get an emission reduction certificate from Thailand’s Greenhouse Gas Management Organization and sell their credit to the market. In terms of Thailand, the amount of carbon trading volume and the average trading price are only 286 580 tCO and 33.90 THB/tCO in 2021, respectively, which are very low numbers [12]. However, the price and quantity growth rate have increased dramatically in the last 5 years. Therefore, Thailand’s carbon market valuation should not be underestimated due to many countries’ highly ambitious greenhouse gas mitigation policies.
According to Thailand’s Alternative Energy Development Program 2018, several renewable energy sources, including solar energy, biomass, biogas, waste and hydropower, need to be increased for clean electricity generation due to CO mitigation policies [13]. The solar photovoltaic (PV) target is one of the largest installed capacity targets because Thailand is located near the equator that causes abundant radiation energy to reach 1200–1400 kWh/m/year [14]. Likewise, the National EV Board of Thailand estimates that the number of EVs will reach 6.22 million units by 2030, reaching 100% EV production by 2036 [15]. However, due to the growing number of EVs, more demand will increase CO emissions in the power sector [16]. Thus, these low-carbon technology application levels have caused various challenges and further improvement scopes, such as smart grid technologies and carbon pricing, as summarized in Table 1.
Summary of literature review
| Reference | Finding | Research gap/suggestion |
|---|---|---|
| [17] | In Thailand, EVs can be charged with solar PV and wind turbines, reducing the overall energy cost | • Scaling up to the country’s level |
| [18] | The high penetration of EV cars such as the EV100 could change the peak demand from afternoon to night, which needs additional generation capacity from this case | • More power generation will require natural gas and coal to support EVs |
| [19] | The EV@30 policy could increase electricity demand by 12% from the BAU trend in 2035 | • A rapid increase in power demand may occur due to rising EVs |
| [20] | In the Alternative Energy Development Program 2018 scenario, high renewable-energy penetrations could reduce CO emissions by 38 million tons in 2037 compared with BAU scenarios | • Energy storage and smart grid need to be supported by the system |
| [21] | There could be 30 MtCO of greenhouse gas emissions from electricity generation for EVs 2050. Also, Thailand has the highest emission compared with the regional countries | • EV charging system should be prepared • Green energy should supply EV charging |
| [22] | Two-fifths of the electricity generation will be supported by the charging demand for EVs in 2040, which is increased from the Government Electric Vehicle expansion roadmap, which states that all newly registered vehicles after 2035 will be zero-emission vehicles | • Should develop the charging behaviour, corresponding peak load and grid impact |
| [23] | EV charging negatively affects generating schedule and reliability of Thailand’s power system because the spinning reserve cannot support the charging strategy | • Unit commitment and economic dispatch need to be simulated with the Power Development Plan |
| [24] | Using the demand–response system through direct load control can decrease peak load, making the system more stable and reliable for EV charging services | • Based on Provincial Electricity Authority feeder data and EV direct current chargers |
| [25] | In 2027, CO emissions could be increased by 5% due to the adoption goal of 15.58 million EVs by 2035 | • The impact of EVs increased in the electricity sector |
| [26] | Subsidized off-peak tariff to maintain the charging power at 60% of the transformer sharing can release stress on the power system by ensuring voltage reduction | • Residential load level • Technical results |
| [27] | More than US$1000/tCO can help Thailand achieve the non-emissions goal by 2050. Likewise, wind and solar power are major factors for CO reduction | • Investigate CO mitigation in sectoral • Challenges in the use of high amounts of renewable energy |
| [28] | Increasing carbon taxes can make the number of renewable-energy technologies notable, while fossil fuel power plants are significantly reduced | • The Power Development Plan should consider the diversity of power sources and carbon taxes |
In summary, although many studies found that the impact of highly variable renewable-energy (RE) penetration and EV charging can cause various issues in Thailand’s power sector, as mentioned, many schemes need to be implemented. For example, the peak shaving and valley filling of the system load demand need to be investigated to optimize the smart charging strategy [22, 24, 26]. Clean energy should supply the additional demand from EVs to the system [21]. In addition, an energy storage system (ESS) is important for generating electricity demand from various disruptive technology scenarios, especially in the penetration of EVs [18]. Meanwhile, the carbon valuation could give more attractive clean energy technologies [27, 28]. However, there is not much comprehensive study available for Thailand’s power sector to evaluate the NDC plan to reduce carbon by 40% in 2030 from BAU to reach carbon-neutrality targets in 2050.
In this paper, Thailand’s power sector is modelled with high penetration of EV charging and clean energy technologies with carbon pricing to assess the potential for carbon emissions reduction by 2030 from BAU to meet the NDC plan. Thailand’s Power Development Plan 2018 (PDP2018) is used for the total projected electricity demand 2030. More details about various data and their assumptions are explained in Section 1.3. Two approaches developed to achieve these goals are as follows:
(i) to find an impact on the high penetration of variable RE and EV charging, specifically in 2030, that will be modelled with demand data from the Power Development Plan (Rev.1) by using the PLEXOS software;
(ii) to propose EV control charging, demand–response (DR), ESS and carbon pricing solutions for solving the impact of EV integration of the power system in terms of cost of energy and carbon emissions reduction.
Consequently, there are five sections in this study. First, this introduction has set out the problems of this study, which are relevant to EV demand and various clean energy technologies in Thailand’s power sector. Second, the methodology illustrates its framework for setting up the study model in five scenarios. The assumption will also be presented in this part. Third, after simulating the developed model, this will be compared with the Power Development Plan 2018 to represent Thailand’s power sector characteristics in 2030. Fourth, the result of the developed model is shown from three aspects: generation, emissions and cost. Finally, the outcome of this study is analysed to suggest the policies that are needed in the future.
1 Proposed methodology
1.1 Overall framework and scenarios
Fig. 1 represents the overall flowchart of this study to model Thailand’s power sector with high variable renewable energy (VRE) and EV penetration following the objectives. First, the ‘S0’ scenario is an install capacity of the energy generation in 2030 created in the model according to PDP2018Rev1, which includes fuel-type and renewable power plants. Besides, the electricity demand profile for 2030 is estimated using Thailand’s load profile in 2017 (Electricity Generating Authority of Thailand). Then, Thailand’s power sector model is built by using PLEXOS software, which has features that support modelling tools for power systems with a high penetration of VRE and CO emissions analysis [29, 30]. Thus, this scenario is validated compared with the PDP2018 projection in Section 4.
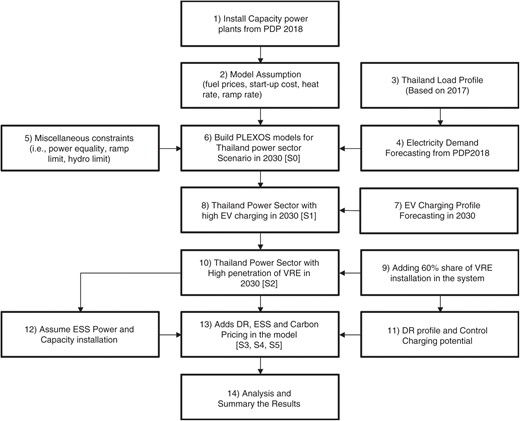
Flowchart of the proposed methodology
Second, from other studies, an EV charging profile in 2030 is added to the developed model here to find an impact, which is referred to as ‘S1’. This scenario is used as the reference model for the other scenarios. After that, the high installation of VRE with will be increased in the developed model ‘S2’ for CO reduction to achieve the new NDC target in 2030. Then, DR schemes by control charging, load reduction from the residential sector and ESS will be combined in the model to solve the peak load due to their charging and the curtailment from VRE, represented in ‘S3’ and ‘S4’, respectively. Finally, carbon pricing sensitivity analysis is added to the developed model to observe cost and generation changes. In summary, this study will contain five scenarios (‘S1’–‘S5’), which have varied on both the supply and demand sides, to find the impact of high VRE and EV penetration in Thailand’s power sector, as shown in Table 2.
Model scenarios
| Scenarios in 2030 | Supply side | Demand side |
|---|---|---|
| S0: Base case | • Power plants PDP2018 | • Forecasting as PDP2018 |
| S1: High EV penetration | • Power plants PDP2018 | • Forecasting as PDP2018 • EV charging demand |
| S2: High VRE penetration | • Power plants PDP2018 • 60% VRE installation | • Forecasting as PDP2018 • EV charging demand |
| S3: Using control charging on EV and DR | • Power plants PDP2018 • 60% VRE installation | • Forecasting as PDP2018 • EV charging demand • Grid-to-vehicle (G2V) control • DR from residential |
| S4: ESS | • Power plants PDP2018 • 60% VRE installation • ESS discharging | • Forecasting as PDP2018 • EV charging demand • G2V control • DR from residential • ESS charging |
| S5: Adds carbon pricing (i.e. carbon tax and credits) |
1.2 Problem formulations
In this section, the modelling of components integrated into the power system could be separated into two components, followed by the supply-and-demand sides. For the supply side, the power generation modelling component was mainly represented with the fuel and start-up cost as shown in Equations (1) and (2), respectively. The fuel cost will contain the price, heat rate, decision operation and power output, and the start-up cost includes the decision start-up and the rate of the start-up cost of each power plant. On the other hand, for the demand side, the ESS modelling can be controlled due to charging and discharging from the power network as in Equations (3–9) [31, 32]. Moreover, for the DR schemes, the modelling could be used as power generation and load depending on reducing and increasing electricity that will result in peak shaving consumption from users, respectively, as in Equations (10–13) [33]. This solution could be applied to control EV charging (grid-to-vehicle: G2V) and load reduction from residential customers.
1.2.1 Power generation modelling
1.2.2 ESS and EV charging modelling
1.2.3 DR programme modelling
The unit commitment economic dispatch (UCED) problem—a typical problem for the operation of the electricity market—is formulated to minimize the costs of electric power generation subject to several operational constraints. In this work, the UCED problem will be only in the production cost model represented by four parts: the start-up cost, the fuel cost, the DR and the ESS dispatch cost, as shown in Equation (14) [34]. Meanwhile, several constraints are subjected to the UCED problem that could be configured in the PLEXOS software [30]. The equality constraint balances the supply side, which includes the power plant, VRE and G2V, and the demand side, which contains EV charging and electricity demand, as shown in Equation (15). Similarly, Equations (16–20) represent the inequality constraints in terms of the limit of the power plant, including ramping, run-up rate, power generation and minimum up/down time limits. In the case of hydroelectric plants, the energy production from large hydroelectric plants in the UCED problem is limited by the estimated annual electricity, as shown in Equation (21). In addition, Equation (22) represents the emissions cost/incentive following the type of power plants [31, 33].
1.2.4 UCED
1.2.5 Power system constraints
1.2.6 Constraints in annual electricity generation from large hydropower plants
1.2.7 Emissions cost
1.3 Input data and their assumptions
Thailand’s power demand reference data for this study are based on PDP2018 Revision 1, which has projected the quantities of power generation and electricity consumption in 2030. These can be set as the amount of installation capacity by fuel sources and forecast the electricity demand profile in 2030, which is modified from other works as shown in Table 3 [35]. Similarly, the model sets the fuel prices, the main parameter for dispatch in the simulation, as summarized in Table 4[36, 37]. Meanwhile, the carbon footprint of the power plant is also taken from the Intergovernmental Panel on Climate Change (IPCC) 2006 report to calculate the amount of CO emissions in the system [38]. In addition, mid-term and short-term schedules, interval time and solver selections are fixed to simulate the model for 1 year in the time horizon.
Power plants by fuel sources in the model [35]
| Sources | Install (MW) | Maximum power generation (GWh) |
|---|---|---|
| Biogas | 1165.00 | 5612.97 |
| Biomass | 2590.00 | 12 478.62 |
| Bituminous coal | 2176.60 | 17 239.00 |
| Diesel oil | 60.40 | 69.00 |
| Fuel oil | 318.00 | 32.00 |
| Hydro | 9867.00 | 34 396.00 |
| Lignite | 2673.00 | 21 619.00 |
| Natural gas | 33 224.00 | 189 433.00 |
| Solar | 7936.00 | Profile base |
| Waste | 784.00 | 3777.31 |
| Wind | 1774.00 | Profile base |
| Grand total | 62 868.30 |
| Sources | Fuel price (THB/GJ) | Start-up cost (THB/time) |
|---|---|---|
| Biogas | 264.55 | |
| Biomass | 121.00 | |
| Bituminous | 72.25 | |
| Lignite | 51.92 | |
| Natural gas | 105.41 | |
| Waste | 176.00 |
| Sources | Fuel price (THB/GJ) | Start-up cost (THB/time) |
|---|---|---|
| Biogas | 264.55 | |
| Biomass | 121.00 | |
| Bituminous | 72.25 | |
| Lignite | 51.92 | |
| Natural gas | 105.41 | |
| Waste | 176.00 |
| Sources | Fuel price (THB/GJ) | Start-up cost (THB/time) |
|---|---|---|
| Biogas | 264.55 | |
| Biomass | 121.00 | |
| Bituminous | 72.25 | |
| Lignite | 51.92 | |
| Natural gas | 105.41 | |
| Waste | 176.00 |
| Sources | Fuel price (THB/GJ) | Start-up cost (THB/time) |
|---|---|---|
| Biogas | 264.55 | |
| Biomass | 121.00 | |
| Bituminous | 72.25 | |
| Lignite | 51.92 | |
| Natural gas | 105.41 | |
| Waste | 176.00 |
Furthermore, the EV demand charger profile from other work is added to the electricity consumption profile, showing an example of high electrification in Thailand [15]. Table 5 represents the other input parameters for the technologies assumed for VRE and ESS [39, 40]. In addition, DR costs are considered an incentive from the average cost of the base system. Furthermore, the carbon price, including carbon taxes and credits, will be added in the range between 100 and 2000 THB/tCO, which is similar to other studies, to find an appropriate carbon price that can reduce the cost from low-carbon technologies [27, 28, 41]. Finally, CPLEX 20.1.0.0 is chosen to solve the iterations of the model that could answer the dispatch of power plants in the system.
| Parameters | Inputs | Units |
|---|---|---|
| High VRE installation | 79 000 | MW |
| LCOE for solar PV | 900 | THB/MWh |
| LCOE for onshore wind power | 1008 | THB/MWh |
| DR reduction potential | 16 516 | MW |
| Control EV charging potential | 6015 | MW |
| DR reduction incentive | 1197 | THB/MWh |
| Control EV charging incentive | 636 | THB/MWh |
| ESS peak power limitation | 40 000 | MW |
| ESS capacity limitation | 200 | GWh |
| LCOE for ESS | 2275 | THB/MWh |
| Range of carbon price | THB/tCO |
LCOE, levelized cost of electricity.
| Parameters | Inputs | Units |
|---|---|---|
| High VRE installation | 79 000 | MW |
| LCOE for solar PV | 900 | THB/MWh |
| LCOE for onshore wind power | 1008 | THB/MWh |
| DR reduction potential | 16 516 | MW |
| Control EV charging potential | 6015 | MW |
| DR reduction incentive | 1197 | THB/MWh |
| Control EV charging incentive | 636 | THB/MWh |
| ESS peak power limitation | 40 000 | MW |
| ESS capacity limitation | 200 | GWh |
| LCOE for ESS | 2275 | THB/MWh |
| Range of carbon price | THB/tCO |
LCOE, levelized cost of electricity.
2 Model validation
After simulating the model as ‘S0’, PLEXOS showed results in power dispatched following the load profile based on PDP2018; lignite and bituminous power plants generate full capacity for daily operation due to their low short-run marginal cost. They need to steadily produce electricity because of their high start-up cost and minimum stable generation level. Also, natural gas power plants are the largest generation source in the system and tend to have more flexibility than coal power plants because they have low ramp rates and start-up costs. Natural gas seems to be the most important source for Thailand’s power sector for energy security and reliability. As a result, for fiscal year generation, there are 303 138.00 GWh of electricity production in 2030 from the model assumption. Natural gas has the highest share of generation units, with 61%. Table 6 shows the comparison of power generation between the model and PDP2018 projection, which differ only by 0.08%. This proves that this model can represent Thailand’s power sector characteristics in 2030.
Comparison between model result and PDP2018 [35]
| Fuel type | Year 2030 | ||
|---|---|---|---|
| S0 (GWh) | PDP2018 (GWh) | Difference (%) | |
| Bituminous coal | 17 660.01 | 17 239.00 | 2.44% |
| Lignite | 21 541.00 | 21 619.00 | -0.36% |
| Natural gas | 187 948.98 | 189 433.00 | -0.78% |
| Hydro | 34 961.70 | 34 396.00 | 1.64% |
| Renewable (VRE, biomass, biogas and waste) | 41 024.38 | 40 219.00 | 2.00% |
| Total | 303 138.00 | 302 906.00 | 0.08% |
3 Results and discussion
3.1 Power generation and demand
Fig. 2 shows the daily operation result of the average load and power generation profile through five scenarios (‘S0’–‘S4’). The first thing to note is that there are three peak loads at 10:00, 14:00 and 19:30 in ‘S0’, which is referred to as the base case, while ‘S1–S4’ load has a higher peak load, specifically at 19:30–21:00, than ‘S1’ due to the additional EV charging demand that causes the new highest peak at night-time. Moreover, the power generation from ‘S0’ and ‘S1’ can produce electricity for its consumption.
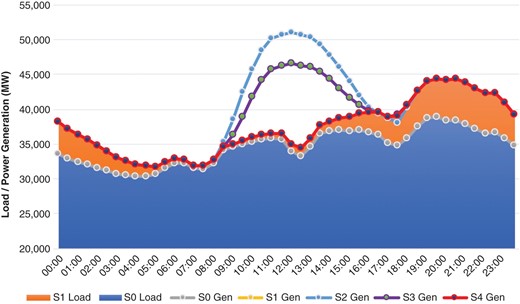
Average of daily load and power generation
On the other hand, ‘S2’ has an excess net generation because VRE (solar) power sources have the maximum radiation output. This creates a curtailment problem in the system. To solve the problem, ‘S3’ could decrease the excess energy from VRE by using DR schemes (i.e. shifting the EV charging demand and load reduction). Besides, by adding the ESS to the system, the surplus supply on ‘S4’ is reduced significantly and can track the load demand profile in the same way as ‘S0’ and ‘S1’. It can be concluded that DR schemes and ESS could solve the problem of RE and EV integration in their daily operation.
Annually, the net power generation can be accounted as 303 138 and 326 859 GWh for ‘S0’ and ‘S1’–‘S5’, respectively, as shown in Table 7. More than 62% of the total power generation is from the natural gas power source for ‘S0’ and ‘S1’, and the EV charging demand can cause a few increases in this source of 2%. Besides, RE sources dominate the electricity production in ‘S2’–‘S5’, which takes 65% of the total. In other words, the natural gas source is substituted by RE sources. However, it causes surplus energy (or dump energy) corresponding to 8.10% in ‘S2’ due to excess supply from high RE integration. Meanwhile, DR programmes can decrease the dump energy to 5.23% in ‘S3’ and adding an ESS into the system can eliminate surplus energy fully, as in ‘S4’, which has shifted the energy by using pump load instead. Furthermore, the addition of carbon pricing to the system decreases the generation of fossil fuel power plants, especially coal power plants, which are caused by phasing out.
Results of power generation annually
| Case | Coal/lignite | Natural gas | RE and hydro | DR | ESS | Pump load | Dump energy | Total (GWh) |
|---|---|---|---|---|---|---|---|---|
| S0 | 12.93% | 62.00% | 25.07% | x | x | x | 0.00% | 303 138 |
| S1 | 11.99% | 64.75% | 23.25% | x | x | x | 0.00% | 326 859 |
| S2 | 9.63% | 33.33% | 65.03% | x | x | x | -8.10% | |
| S3 | 9.54% | 30.04% | 65.03% | 3.66% | x | -3.04% | -5.23% | |
| S4 | 10.02% | 24.79% | 65.03% | 3.89% | 6.32% | -10.04% | 0.00% | |
| S5 T200 | 7.08% | 27.17% | 65.03% | 4.42% | 6.21% | -9.89% | -0.01% | |
| S5 T500 | 0.00% | 31.11% | 65.05% | 7.49% | 6.08% | -9.71% | -0.02% | |
| S5 T1000 | 0.00% | 29.67% | 65.07% | 8.84% | 6.07% | -9.65% | 0.00% | |
| S5 T1800 | 0.00% | 29.68% | 65.07% | 8.87% | 6.11% | -9.73% | 0.00% |
3.2 CO2 emissions
Table 8 represents the annual CO emissions from each type of power plant in the ‘S0’–‘S5’ scenarios. Furthermore, the percentage of CO reduction from BAU is presumed to be 124.77 MtCO, calculated from Thailand’s original plan in PDP2015 to decrease CO emissions by 20% in 2030 [42]. There are 106 MtCO in ‘S0’, which is nearly equal to other projection studies [20, 35, 43]. Moreover, all scenarios show that natural gas has the largest overall emissions because it has the highest generation of the fuel-type power plants. Although bituminous and lignite sources have only produced 10% of the total power generation, as mentioned in the last section, these sources still emit 35% of the total system releases of CO. It proves that bituminous and lignite are the major cause of emissions in the power system.
Results of annual CO emissions
| Case | Bituminous | Lignite | Natural gas | Total (MtCO2) | CO2 reduction from BAU |
|---|---|---|---|---|---|
| S0 | 14.65% | 24.35% | 61.00% | 106.01 | -15.04% |
| S1 | 13.71% | 22.79% | 63.49% | 113.27 | -9.22% |
| S2 | 15.16% | 30.27% | 54.53% | 74.07 | -40.63% |
| S3 | 15.81% | 30.89% | 53.29% | 71.23 | -42.92% |
| S4 | 17.93% | 33.75% | 48.33% | 67.56 | -45.86% |
| S5 T200 | 14.69% | 25.22% | 60.09% | 59.93 | -51.97% |
| S5 T500 | 0.00% | 0.00% | 100.00% | 40.79 | -67.31% |
| S5 T1000 | 0.00% | 0.00% | 100.00% | 38.98 | -68.76% |
| S5 T1800 | 0.00% | 0.00% | 100.00% | 39.13 | -68.64% |
Furthermore, the result in ‘S1’ shows that EV charging can cause an increase of CO emissions in Thailand’s power sector by 6% when compared with ‘S0’, which is the reference case from PDP2018. On the other hand, high VRE integration in ‘S2’ can decrease emissions by 30% and 34% compared with ‘S0’ and ‘S1’, respectively. This scenario may result in this country’s success in CO reduction by 40% in 2030 as per the NDC’s target . In addition, adding other technology (i.e. DR and ESS), as in ‘S4’, can slightly reduce emissions from ‘S2’. Therefore, RE causes a major reduction in CO emissions by substituting the emissions from natural gas.
3.3 Total system cost
The average daily system cost from ‘S0’–‘S4’ results are represented, with distinctive characteristics as shown in Fig. 3, which gives various observations. First, during the daytime, the high EV charging demand in ‘S1’ does not change the system cost profile compared with ‘S0’, but it has a slight offset on the generation cost during the night due to its charging profile. Both the ‘S0’ and ‘S1’ cases have high start-up costs from fuel-type power plants at 19:00 due to the peak load. Second, ‘S2’ has the maximum generation cost from the extraordinary VRE generation. It also affects the increase in the start-up and the cost of the power plants due to their intermittent supply, specifically in the evening (16:00–17:00). Third, by the technological solutions, the start-up and shutdown costs can decrease gradually in ‘S3’ from DR schemes. At the same time, costs dramatically reduce in ‘S4’ due to adding the ESS. However, the ESS affects the generation cost during its night-time dispatching (19:00–23:00) because it has an expensive LCOE of 2275 THB/MWh, which is much higher than the average system cost of 1007 THB/MWh.
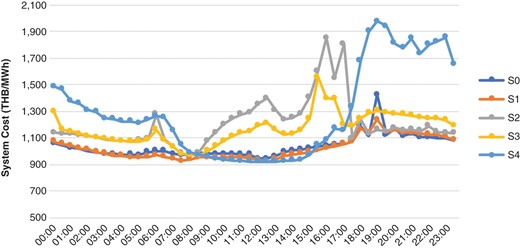
Daily average system cost
Fig. 4 represents the change of the system cost annually from the reference scenario ‘S1’, which is based on 335 billion THB for the fiscal year and the CO reduction from BAU for achieving the NDC target in 2030. ‘S1’ has a few changes in the generation cost to support additional charging from EVs, while its start-up power plant cost is fairly equal to that of ‘S0’. On the other hand, VRE penetration significantly raises generation, start-up and dump costs due to its excess generation and uncertainty of supply, as illustrated in ‘S2’. Moreover, the ‘S3’ solution can decrease the operation cost (generation and start-up cost) slightly from ‘S2’ while it has slight additional costs from DR dispatching. Likewise, ‘S4’ is one of the best cases that could solve the problem from start-up and dump costs effectively, but it has a trade-off from LCOE for the ESS, which affects the highest total cost compared with other cases (‘S1’–‘S3’). In addition, the high carbon price is implemented in the model (‘S5+T1800’) that recovers the additional cost to be equal to the reference scenario (‘S1’) and also decreases CO emissions beyond the NDC target.
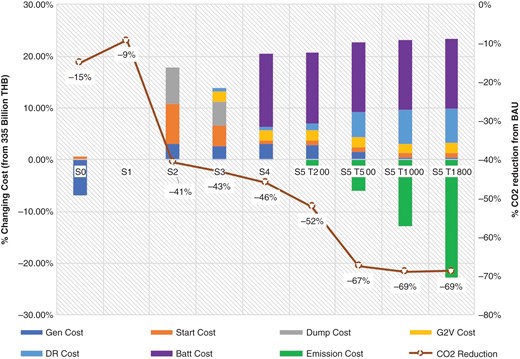
Yearly total system cost as a percentage and CO reduction potential
3.4 Policy implications
Regarding technical and financial support, there are various observations to be achieved in the 40% reduction target from the NDC for Thailand’s power sector. Due to the high penetration of VRE, it could reduce carbon emissions effectively, which can help Thailand achieve the carbon-neutrality target by 2050. Moreover, this can decrease the dependence on natural gas to mitigate importing fuel from abroad and improve energy security in the country. However, the government should find an economic mechanism for technological support to solve the issues of VRE, specifically in real-time pricing for DR schemes and decreasing the cost of ESSs. This mechanism may cause the solutions to be viable. Likewise, methods for reducing the cost of variable RE technologies (e.g. solar PV and wind turbines) are also very important in decreasing the system cost, such as investing in domestic production or using tax reductions for importing.
Furthermore, the EV charging station should be set up in specific work places, such as in the commercial and industrial sectors, offices, department stores and restaurants, to reduce the high amount of RE curtailment at noon, as illustrated in Fig. 5, which shows the comparison between the average regular and control charging EV demand daily. For daily operation, a proposal for the EV infrastructure and ESS sizing should be considered from the model result. Likewise, real-time pricing measures are also essential to regulate charging profiles to minimize the power system cost. Therefore, both solutions must be combined to control high EV charging as preferred.
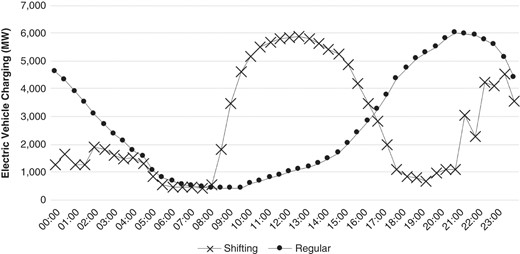
Daily average EV charging
Second, due to variable RE installation in the power system, the ESS is an important technology to store the excess supply at noon, as mentioned in Section3.1. Fig. 6 shows the correlation between the variable RE peak power (MW) and the ESS capacity dispatch (GWh) on each day in the model, resulting in two possible pathways. If the levelized energy cost of the ESS (THB/MWh) is still expensive, the variable RE installation should be reduced to 40 MW of the peak power to minimize the installation cost of the ESS. On the other hand, in the case of a low ESS cost, installing an ESS can reach 180 GWh to support the highest variable RE peak power. Consequently, the installation standard should be set to contain an ESS for utilizing the high VRE power generation.
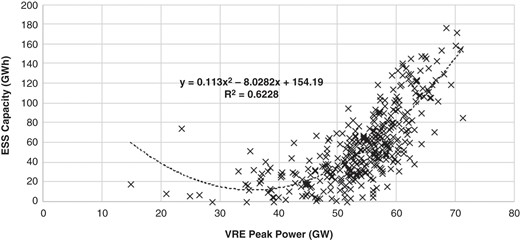
Daily variable renewable energy peak power vs energy storage system capacity requirement
Nomenclature
Conflict of interest statement
None declared.
Data Availability
All data are available in Tables 3–5, which are cited from the reference list of the manuscript.
References
f[42]
