


Abstract
Circulating dimethylguanidino valeric acid (DMGV) was identified as a novel metabolite related to cardiorespiratory fitness and cardiometabolic abnormalities. Circulating DMGV levels are subjective to dietary modulation; however, studies on its associations with intakes of coronary heart disease (CHD)–related foods/nutrients are limited. We investigated whether plasma DMGV was related to risk of incident CHD. We tested associations of DMGV with CHD-related dietary intakes measured by 7-day dietary records and estimated corresponding disease risk.
This nested case–control study on the incidence of CHD included 1520 women (760 incident cases of fatal CHD and nonfatal myocardial infarction and 760 controls) from the Nurses’ Health Study. Separately, plasma DMGV and CHD-related dietary intakes and cardiometabolic abnormalities were assessed in the Women’s Lifestyle Validation Study (WLVS; n = 724). Higher plasma DMGV was related to a greater risk of CHD [relative risk (RR) per 1 SD, 1.26 (95% CI 1.13, 1.40); P-for-linearity = 0.006]. Greater intakes of sodium, energy-dense foods, and processed/red meat were related to higher DMGV levels; every 1 SD intake of sodium was associated with β 0.13 (SE 0.05; P = 0.007) for DMGV Z-scores, which corresponded to a RR of 1.031 (1.016, 1.046) for CHD. High DMGV (the top quartile, Q4) showed a significant RR of 1.60 (1.17, 2.18) after adjusting for diet and lifestyle factors; the RR further adjusting for obesity and hypertension was 1.29 (0.93, 1.79) as compared with the lowest quartile. In both cohorts, greater adiposity and adverse cardiometabolic factor status were significantly related to higher DMGV levels.
Higher levels of plasma DMGV, a metabolite reflecting unfavourable CHD-related dietary intakes, were associated with an increased risk of CHD. The unfavourable association was attenuated by cardiometabolic risk factor status. Our study underscores the potential importance of plasma DMGV as an early biomarker associated with diet and the long-term risk of CHD among women.
Time of primary review: 119 days
1. Introduction
Plasma metabolite dimethylguanidino valeric acid (DMGV) has been identified as a novel biomarker of non-alcoholic fatty liver disease, type 2 diabetes, and cardiovascular or all-cause mortality,1–3 although whether DMGV is an independent risk factor for these disease outcomes is still unknown. Recent evidence shows that DMGV is a marker of poor metabolic response to exercise and cardiorespiratory fitness,4,5 highlighting the novel role of circulating DMGV in the development of cardiovascular disease (CVD). DMGV is a product formed from transamination of asymmetric dimethylarginine (ADMA) via the enzyme alanine–glyoxylate aminotransferase 2 (AGXT2),1,6 and this pathway is involved in nitric oxide regulation.7 Existing evidence has shown strong associations between metabolic pathways associated with the production of DMGV and cardiovascular physiology.8–12 Genetic studies have demonstrated the role of AGXT2 in determining heart rate variability, blood pressure, and lipid metabolism.7,13,14
In a recent cross-sectional study of patients who had undergone investigation for suspected coronary artery disease (CAD), circulating DMGV was associated with calcified plaque, obstructive CAD, and severity of coronary disease.15 However, the significant associations disappeared after adjusting for traditional risk factors in their study.15 In a Swedish cohort study, baseline levels of DMGV were associated with incident CAD, but the associations were substantially attenuated or disappeared after adjusting for DMGV-related cardiometabolic abnormalities.2 Additional prospective studies are needed to understand whether high DMGV levels are related to the long-term risk of incident CHD and to explore the potential mechanisms. In addition, recent studies suggest that high levels of DMGV may be related to unhealthy dietary habits (such as high intakes of sugary drinks and low intakes of vegetables and dietary fibre).2,6,16 Nonetheless, comprehensive assessment of associations between circulating DMGV and dietary intakes measured by the gold standard dietary records is limited. Even if metabolite–diet associations may exist according to prior studies, their corresponding risks of CHD remain unquantified to translate such associations into estimating the disease risk.
Therefore, in participants from the Nurses’ Health Study (NHS), we comprehensively investigated associations between plasma DMGV levels and the risk of incident CHD among women without prior CHD. Using dietary intake data measured by the ‘gold standard’ 7-day dietary records (7DDRs), we investigated associations of circulating DMGV with dietary intakes typically related to CHD risk among women without CVD who participated in the Women’s Lifestyle Validation Study (WLVS) and estimated their corresponding risks of CHD in the NHS. In addition, we investigated associations of plasma DMGV levels with cardiometabolic abnormalities in two independent NHS and WLVS populations and tested whether high DMGV levels were related to an increased risk of CHD even after adjusting for cardiometabolic abnormalities.
2. Methods
2.1 Study design, setting, and participants
The present analysis included participants from a prospective nested case–control study in the NHS (n = 1520) to examine the association between plasma DMGV and the risk of incident CHD. Separately, participants from the WLVS (n = 724) were also included to examine associations of plasma metabolite DMGV with dietary intakes measured by 7DDRs and cardiometabolic risk factors. This study was performed in accordance with the Declaration of Helsinki, and the study protocol was approved by the institutional review boards (IRBs) of the Brigham and Women’s Hospital and Harvard T.H. Chan School of Public Health, and the IRBs allowed participants’ completion of questionnaires to be considered as implied consent.
The NHS is a prospective cohort study of US female registered nurses (n = 121 700) aged 30–55 years at the time of enrolment in 1976. Information on demographics, lifestyle factors, medical history, and disease status was collected through a self-administered questionnaire in 1976. The data have been updated every 2 years through follow-up questionnaires. The follow-up rate was high, ∼90% in each 2-year follow-up cycle. During 1989–90 (NHS1.1), a blood sample was requested from all women who were active participants at the inception of the collection and had completed the 1988 questionnaires, and 32 826 women provided one.17 As previously detailed, women who provided blood samples were similar to those who did not.18,19 In 2000–02 (NHS1.2), 18 743 women provided a second blood sample.17 The second blood sample was collected according to a protocol identical to the one used at the first collection. In this study, we conducted a prospective nested case–control study of incident CHD after the blood collection NHS1.1 or NHS1.2 until the end of follow-up (2000 for the NHS1.1 and 2016 for the NHS1.2). We prospectively identified and confirmed 762 incident cases of non-fatal myocardial infarction (MI) and fatal CHD over 11–16 years of follow-up time. We used risk-set sampling to randomly select 1 control for each case from whom remained free of CHD events at the time CHD was diagnosed in the case subject. Incident cases and controls were matched on age at blood draw, smoking status, fasting status, and date of blood draw. Subsequently, 1524 participants (n = 762 incident CHD case–control pairs) had available data on the exposure metabolite and were eligible to be included in the nested case–control study on the incidence of CHD. Dietary and lifestyle characteristics were similar between the participants included (n = 1524) and those who provided blood samples but were not included (see Supplementary material online, Table S1). After excluding a few outliers (n = 2) of the exposure metabolite and their corresponding case–control pairs (n = 2), the present study included 1520 women (760 incident CHD cases and 760 controls) who were free of the primary outcome (non-fatal MI or fatal CHD) at the time of blood collection, including 397 matched pairs from NHS1.1 and 363 matched pairs from the NHS1.2.
The WLVS is a sub-study in the NHS and NHS-II (NHS-II began in 1989 when 116 429 female registered nurses between the ages of 25 and 42 years) and was designed to examine the validity of self-reported diet and lifestyle. Women with a history of CHD, stroke, cancer, or major neurological disease were excluded at enrolment.20 The details of the study design have been described previously.20,21 Briefly, the WLVS collected anthropometric measurements, objectively measured dietary intakes and physical activity, and biomarkers over a period of ∼15 months during 2010–12 (with five phases, with each phase representing a 3-month interval). The participants provided two blood samples taken ∼6 months apart. By design, 7DDRs and other data were collected within the same phase of the study.21 To minimize a potential bias (such as causal inference when analysing metabolite–diet associations) and due to the cross-sectional study nature, the second blood sample was used to measure plasma metabolites in the WLVS. Plasma metabolites were measured in 751 women of the enrolled participants (n = 796) for whom frozen blood samples were available. We excluded outliers of plasma DMGV based on the data distribution (n = 1), participants with missing data on body mass index (BMI), food/energy intake measured by 7DDR, or total physical activity counts measured by an accelerometer (n = 24), or those with implausible total energy intake (>3500 kcal/day) (n = 3). Subsequently, a total of 724 women were eligible for the analysis.
2.2 Measurement of plasma metabolites
Blood samples were centrifuged and aliquoted into cryotubes as plasma, buffy coat, and erythrocyte fractions, which were then stored in liquid nitrogen freezers at −130°C or colder until analysis. Samples of the case–control pairs in the NHS were shipped in the same batch and analysed in the same run. Both technicians and laboratory personnel were blinded to the case–control status of the samples. Plasma samples from the NHS and the WLVS were analysed at the University of California San Diego following the previously reported methods.22 Liquid chromatography–mass spectrometry (LC–MS) was used to analyse the samples using a modified Agilent RapidFire 365 sample injector coupled to a high-resolution Agilent 6545B QToF mass spectrometer (Agilent Technologies, Santa Clara, CA, USA). The details on measurements and quality control (QC) approaches are described in Supplementary material. The duplicated QC study samples (94 samples; 47 sets) were included along with the NHS case–control study samples, and the average CV or ICC of DMGV was 15.1% and 0.96, respectively. Supplementary material online, Table S2, shows the mass-to-charge ratio (m/z) and retention time (RT) of the primary metabolite exposure DMGV.
2.3 Ascertainment of CHD
Incident CHD was defined as non-fatal MI or fatal CHD. A self-reported history of non-fatal MI was primarily confirmed by reviewing medical records by physicians who were blinded to the exposure status and the specific research question under study. Non-fatal MI was confirmed if it met the criteria of the World Health Organization, which required typical symptoms plus diagnostic electrocardiographic findings or elevated enzyme levels. Deaths were reported by the next of kin or the postal system or identified by searching the National Death Index (NDI). We previously estimated that at least 98% of deaths were identified using these approaches.23 Fatal CHD was identified by medical records or autopsy reports or if CHD was listed as the cause of death on the death certificate along with prior evidence of CHD. The study designated probable fatal CHD deaths when CHD was the underlying cause on the death certificate or NDI search or a family member provided supporting information regarding the diagnosis, but no medical records surrounding the death were available.
2.4 Assessment of dietary intake using 7DDRs in the WLVS
Participants in the WLVS were asked to complete two 7DDRs ∼6 months apart to capture seasonal variability.20 The last date of the 7DDR report preceded the date of the second blood collection.
Seven-day averaged values of food/nutrient intake data were calculated; averaged values of the two 7DDRs were calculated and used in the main analysis. Details on the 7DDRs are described in Supplementary material online, Materials. In the present analysis, the main dietary factors of interest were foods and nutrients related to obesity, hypertension, and CVD,24–26 such as added sugars, sugar-sweetened beverages, French fries, red and processed meat, hamburger/hotdogs/pizza, and sodium from food, that generally characterize Western dietary patterns. Intakes of vegetables, fruits, potassium, dietary fibre, nuts, fish/seafood, any omega-3 fatty acids (from food only and diet + supplements), EPA (eicosapentaenoic acid) + DHA (docosahexaenoic acid) (from both food and supplements), vitamin C (ascorbic acid) (from both food and supplements), and vitamin D (from both food and supplements) were assessed as comparison dietary factors that may have favourable associations for obesity/hypertension/CVD.
2.5 Measurements of cardiometabolic risk factors and other covariates
Demographic data (such as age and race), smoking status, female hormone use, self-reported histories of hypertension, dyslipidaemia, and diabetes, as well as other covariates, were collected from baseline questionnaires in both study populations. BMI (kg/m2) was calculated as weight in kilograms divided by the square of height in metres. In the WLVS, plasma insulin, proinsulin, and C-peptide were measured using enzyme-linked immunosorbent assays;27 blood lipids were measured enzymatically, as previously described.28 Proinsulin, insulin, and C-peptide were assessed in participants without diabetes. Total physical activity counts were measured by an accelerometer in the WLVS.27 In the nested case–control study participants in the NHS, a family history of MI, height, weight, smoking habit, physical activity, physician-diagnosed diseases, medication use, and other variables were collected from questionnaires. Self-reported weight was highly correlated with technician-measured weight (r = 0.97) in a validation study.29 Self-reported histories of physician-diagnosed hypertension, high cholesterol, and diabetes have also been validated, as described previously.30,31 Antihypertensive medication use, statin or other cholesterol-lowering medication use, and insulin or oral hypoglycaemic medication use were also considered to define the respective metabolic conditions of hypertension, hyperlipidaemia, and diabetes. Physical activity, metabolic equivalent (MET) hours per week, was assessed based on the duration of physical activities multiplied by the intensity of the activity. Diet and nutrient intake were assessed using validated semi-quantitative food frequency questionnaires in the NHS. The Alternate Healthy Eating Index (AHEI)32 with or without alcohol was calculated.
2.6 Statistical analysis
Data on plasma DMGV were log-transformed and Z-score–standardized (mean = 0 and SD = 1) in both cohorts. Conditional logistic regression was used to estimate the relative risks (RRs) and 95% CI for CHD incidence per 1 Z-score or quartile categories of DMGV using the values in the control group. In nested case–control studies with risk-set sampling, the odds ratio from the conditional logistic regression model estimates the incidence (hazard) ratio and thus the RR.33–35 We first performed spline regression36 to model the dose–response relationship and examined possible nonlinear relationships between DMGV levels and CHD risk using a model adjusted for matching factors, family history of MI, and postmenopausal hormone therapy use. Effect sizes β (SE) per 1 SD increment of an individual dietary factor for differences in Z-score–standardized levels of DMGV were calculated using the linear regression models adjusting for age, race/ethnicity, fasting status, female hormone therapy use, smoking habit, total energy intake, and total physical activity counts in the WLVS. After obtaining the β effect sizes per 1 SD of each food item for Z-score–standardized levels of DMGV (i.e. βfood for DMGV Z-scores) in the WLVS, the corresponding RRs associated with the βfood for DMGV Z-scores for CHD were calculated in the NHS. Sensitivity analysis was performed using one 7DDR at the time of blood collection instead of the averaged data of two 7DDRs. We also analysed energy-adjusted food and nutrient values calculated using the residual method,37 with a reference energy level of 1600 kcal/day.28 To test whether metabolic risk factors were associated with higher DMGV levels, the linear regression analysis was performed adjusting for age, race/ethnicity, fasting status, female hormone therapy use, physical activity, and smoking habit. When performing conditional logistic regression analysis, we constructed several models adjusting for matching and demographic factors, diet, physical activity, and common cardiometabolic risk factors, such as BMI, hypertension, dyslipidaemia, and diabetes that might attenuate associations between DMGV and CHD. After performing model 1, including matching and demographic factors (age, date of blood collection, fasting status, smoking, family history of MI, and postmenopausal hormone therapy use), model 2 included physical activity, alcohol, and overall diet quality (AHEI without alcohol). Cardiometabolic risk factors were separately included in models 3–4, and the final model 5 included all cardiometabolic risk factors (BMI, hypertension, dyslipidaemia, and diabetes) in addition to covariates in model 2. To minimize missing data on common covariates, we carried forward values obtained in previous questionnaires; 99% of the participants had data on all covariates. If participants still had missing values on physical activity or dietary factors (n = 3 to n = 9 across variables), these were replaced by a median value in the case group or in the control group, respectively. Sensitivity analyses were performed by stratifying participants based on metabolic factors and other conditions to examine the robustness of DMGV-CHD associations in relation to the presence or absence of each factor. Unconditional logistic regression was used in the stratified analysis as matched cases and controls were not necessarily in the same strata. Analyses were performed using R and SAS version 9.4 (SAS Institute).
3. Results
DMGV levels were normally distributed in the NHS and WLVS (see Supplementary material online, Figure S1). We confirmed previously reported associations that DMGV was a marker of poor physical activity, which was assessed by MET hours in the NHS (Pearson’s correlation coefficient r = −0.1; P = 0.002) and total physical activity counts in the WLVS (r = −0.2; P < 0.0001). Baseline characteristics of the participants (n = 1520) by the incidence of CHD are shown in Supplementary material online, Table S3. As expected, participants in the incident CHD case group had higher BMI and were more likely to have a family history of MI and cardiometabolic abnormalities at baseline. Mean dietary intakes measured by 7DDRs (see Supplementary material online, Table S4) and characteristics by the quartiles of DMGV in the WLVS participants (n = 724) are shown in Supplementary material online, Table S5.
3.1 DMGV dietary intake associations and their corresponding risks for CHD
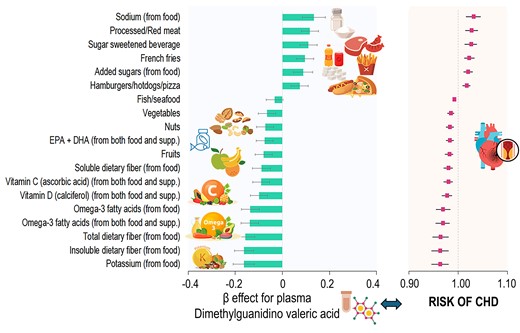
We found that plasma DMGV showed a linear and positive association with risk of incident CHD (P for linear relation = 0.006; no significant evidence of non-linearity) after adjusting for matching factors, family history of MI, and postmenopausal hormone therapy use (Figure 1). Every 1 SD increment of DMGV was associated with a RR of 1.26 [(95% CI 1.13, 1.40); P < 0.0001] for CHD. Figure 2 shows β estimates per 1 SD increment of individual food/nutrient intake for differences in DMGV levels (i.e. βfood for DMGV Z-scores) in the WLVS (in panel A) and corresponding risks of CHD in the NHS (panel B). Greater intakes of sodium from food, processed/red meat, added sugars, sugar-sweetened beverages, French fries, and hamburgers/hotdogs/pizza were significantly related to higher levels of DMGV after adjusting for covariates including total energy intake and total physical activity counts. For example, every 1 SD intake of sodium from food was associated with βfood (SE) 0.13 (0.05) (P = 0.007) for DMGV Z-scores, which corresponded to a RR 1.031 (95% CI 1.016, 1.046) for CHD. The metabolite variation (βfood) per 1 SD of sugar-sweetened beverages (1 SD, 130 g) or added sugar from food (1 SD, 24 g) was equivalent to 2% (RR 1.02) to 2.6% (RR 1.026) increased risk of the CHD. On the other hand, greater intakes of potassium from food, dietary fibres (total, insoluble, and soluble), omega-3 fatty acids, vitamin C, and vitamin D, nuts, and fruits were significantly associated with lower levels of DMGV (P < 0.05 for all), showing corresponding RRs of CHD ranged from 0.99 to 0.96. Results of sensitivity analysis using one 7DDR data at the time of blood collection showed similar results (see Supplementary material online, Figure S2); higher intakes of sodium from food, processed/red meat, and sugar-sweetened beverages were major significant dietary factors related to higher DMGV levels. Also, higher intakes of potassium, marine or any omega-3 fatty acids, and dietary fibre (total and insoluble dietary fibre) were major dietary factors related to lower DMGV levels (P < 0.05 for all) in the results of sensitivity analysis. The overall trend remained consistent in the sensitivity analysis using energy-adjusted food and nutrient values (see Supplementary material online, Figure S3), although the effect estimates for energy-dense food items were attenuated.
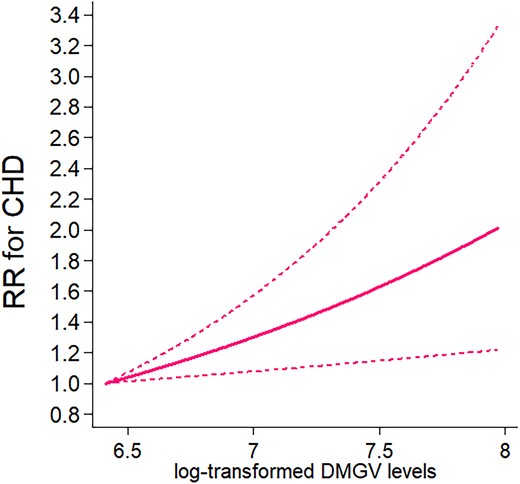
CHD by plasma levels of DMGV. Data are RRs and 95% CIs adjusted for matching factors, family history of myocardial infarction, and postmenopausal hormone therapy use in the conditional logistic regression with four knots. The lowest and highest 5% were excluded from the analysis, leaving n = 1368. P for linear trend =0.006.
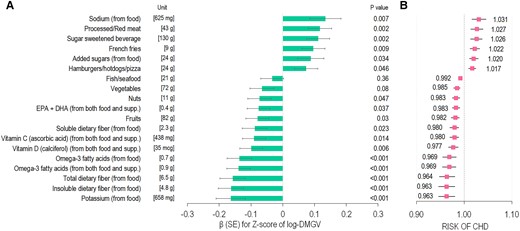
Associations of individual food/nutrient intake for DMGV levels in the WLVS (A) and corresponding risks of CHD in the NHS (B). (A) Data are effect β (SE) per one unit (SD value) of each food/nutrient item for Z-score of log-transformed DMGV (i.e. βfood for DMGV Z-scores) after adjusting for age, race/ethnicity, fasting status, smoking, female hormone use, total energy intake, and physical activity in the WLVS (n = 724). P-value for each β effect is presented. (B) Data are the RR of CHD associated with the estimated βfood for DMGV Z-scores. The RRs were adjusted for matching factors, family history of myocardial infarction, and postmenopausal hormone therapy use (n = 1520).
3.2 Associations of DMGV with cardiometabolic risk factors and the risk of CHD
In the NHS and WLVS cohorts, we found that greater adiposity and adverse cardiometabolic factor status were significantly related to higher DMGV levels (Table 1). Pearson’s correlations showed moderate correlations between DMGV and BMI, body fat mass, adipokines (adiponectin and leptin), lipids, HbA1c, insulin, proinsulin, or C-peptide (P < 0.0001 for all). Significant associations of high DMGV levels with hypertension were also found in both cohorts.
Cardiometabolic risk factors associated with higher levels of DMGV
| Cohort | N | Pearson correlation coefficient | β effect associated with each factor for DMGV levels | P |
|---|---|---|---|---|
| Factor | ||||
| NHS control participants | ||||
| Body mass index | 760 | 0.38 | 0.35 (0.03) | <0.0001 |
| Hypertension, yes | 760 | – | 0.38 (0.07) | <0.0001 |
| Dyslipidaemia, yes | 760 | – | 0.17 (0.07) | 0.012 |
| Diabetes, yes | 760 | – | 0.52 (0.18) | 0.0032 |
| Log-transformed triglycerides | 458 | 0.32 | 0.29 (0.04) | <0.0001 |
| HDL cholesterol | 415 | −0.32 | −0.28 (0.04) | <0.0001 |
| HbA1c | 491 | 0.21 | 0.14 (0.04) | 0.0007 |
| WLVS participants | ||||
| Body mass index | 724 | 0.39 | 0.37 (0.04) | <0.0001 |
| Fat mass | 724 | 0.38 | 0.35 (0.04) | <0.0001 |
| Hypertension, yes | 724 | – | 0.37 (0.08) | <0.0001 |
| Log-transformed adiponectin | 509 | −0.30 | −0.32 (0.05) | <0.0001 |
| Log-transformed leptin | 508 | 0.45 | 0.43 (0.04) | <0.0001 |
| Log-transformed triglycerides | 724 | 0.27 | 0.24 (0.04) | <0.0001 |
| HDL cholesterol | 724 | −0.34 | −0.32 (0.04) | <0.0001 |
| Log-transformed pro-insulina | 427 | 0.39 | 0.36 (0.05) | <0.0001 |
| Log-transformed C-peptidea | 480 | 0.43 | 0.39 (0.04) | <0.0001 |
| Log-transformed insulina | 412 | 0.37 | 0.34 (0.05) | <0.0001 |
β (SE) for Z-score of log-transformed DMGV levels associated with each factor (presence of the metabolic factor or per 1-SD increment for continuous variables) adjusted for age, race/ethnicity, fasting status, smoking, total physical activity counts, and female hormone use in the WLVS. β (SE) were adjusted for age, date of blood collection, fasting status, smoking, physical activity, and postmenopausal hormone therapy use in the NHS.
NHS, Nurses’ Health Study; WLVS, Women’s Lifestyle Validation Study; N, number of participants with available data.
aData on insulin secretion markers were analysed in participants without diabetes.
Table 2 shows results on RRs of CHD according to quartile (Q) categories or 1-SD increment of DMGV levels after adjusting for DMGV-related metabolic factors. Compared with women in the lowest quartile of DMGV, those in the highest quartile (Q4) had a RR of 1.60 (95% CI 1.17, 2.18) for CHD after adjusting for demographic factors, physical activity, alcohol, and AHEI without alcohol in model 2. The RR in the Q4 was attenuated after controlling for either BMI [RR 1.31 (95% CI 0.94, 1.83) in model 3a] or hypertension [RR 1.29 (0.93, 1.79) in model 3b]. The RR of high DMGV (Q4) was still significant after adjusting for dyslipidaemia and diabetes in model 3c [RR 1.40 (1.01, 1.95)]. Per 1-SD increment of DMGV, the risk for CHD was RR 1.23 (1.10, 1.37) in model 2 adjusting for diet and lifestyle factors; RR 1.14 (1.01, 1.29) in model 3a or RR 1.13 (1.003, 1.27) in model 3b adjusting for either BMI or hypertension; and RR 1.16 (1.03, 1.30) in model 3c adjusting for dyslipidaemia and diabetes. The RR per 1 SD of DMGV was not significantly elevated in model 4 adding both BMI and hypertension (RR 1.08 (0.96, 1.23)] or in model 5 adding all cardiometabolic risk factors [RR 1.05 (0.93, 1.20)].
Relative risks of CHD according to quartile categories or per 1-SD increment of DMGV levels
| Model | Quartiles (Q) of DMGV | Per 1 SD | P | |||
|---|---|---|---|---|---|---|
| Q1 | Q2 | Q3 | Q4 | |||
| Incident cases of CHD/controls | 149/190 | 169/190 | 192/190 | 250/190 | 760/760 | - |
| Model 1, Demographic factors | 1.00 (Ref.) | 1.16 (0.85, 1.57) | 1.25 (0.93, 1.70) | 1.71 (1.26, 2.33) | 1.26 (1.13, 1.40) | <0.0001 |
| Model 2, Diet, lifestyle factors | 1.00 (Ref.) | 1.13 (0.83, 1.55) | 1.23 (0.91, 1.67) | 1.60 (1.17, 2.18) | 1.23 (1.10, 1.37) | 0.0003 |
| Model 3a, BMI | 1.00 (Ref.) | 1.07 (0.78, 1.46) | 1.08 (0.79, 1.48) | 1.31 (0.94, 1.83) | 1.14 (1.01, 1.29) | 0.029 |
| Model 3b, Hypertension | 1.00 (Ref.) | 1.01 (0.73, 1.40) | 1.11 (0.81, 1.52) | 1.29 (0.93, 1.79) | 1.13 (1.003, 1.27) | 0.045 |
| Model 3c, Dyslipidaemia and diabetes | 1.00 (Ref.) | 1.13 (0.82, 1.56) | 1.17 (0.85, 1.61) | 1.40 (1.01, 1.95) | 1.16 (1.03, 1.30) | 0.013 |
| Model 4, BMI and hypertension | 1.00 (Ref.) | 0.99 (0.71, 1.36) | 1.03 (0.75, 1.43) | 1.16 (0.82, 1.63) | 1.08 (0.96, 1.23) | 0.20 |
| Model 5, All | 1.00 (Ref.) | 1.01 (0.72, 1.41) | 1.02 (0.73, 1.42) | 1.09 (0.76, 1.55) | 1.05 (0.93, 1.20) | 0.43 |
Cut-offs of Q1–Q4 were based on values among control subjects. Data are N of incident cases of CHD/matched controls or relative risks (95% CIs) estimated using conditional logistic regression models.
Model 1: matching factors, family history of myocardial infarction, and postmenopausal hormone therapy use.
Model 2: model 1 + physical activity, alcohol intake, and Alternate Healthy Eating Index without alcohol.
Model 3a: model 2+ BMI; Model 3b: model 2 + hypertension; Model 3c: model 2 + dyslipidaemia and diabetes.
Model 4: model 2 + BMI and hypertension.
Model 5: model 2 + BMI, hypertension, dyslipidaemia, and diabetes.
Bold font, P < 0.05.
CHD, coronary heart disease; BMI, body mass index; Ref., reference. Q, quartile.
3.3 Sensitivity analysis on DMGV-CHD relation
We found no significant interactions between cardiometabolic risk factors or other conditions and plasma DMGV levels for CHD, although matching factor–adjusted RR was generally high in women with postmenopausal hormone therapy use [RR per 1 SD of DMGV, 1.37 (95% CI 1.15, 1.63) for CHD] and those with low AHEI [RR 1.34 (1.16, 1.56)] or low physical activity habit [RR 1.32 (1.13, 1.53)] (see Supplementary material online, Table S6). The RR per 1 SD of DMGV was significantly elevated in women with BMI ≥ 25.0 kg/m2 [RR 1.18 (1.01, 1.37)] and those with one of cardiometabolic risk factors including the presence of hypertension, dyslipidaemia, or diabetes [RR 1.19 (1.05, 1.35)].
4. Discussion
We found that higher levels of circulating DMGV, representing unfavourable CVD-related dietary intakes measured by the ‘gold standard’ 7DDRs, were associated with a greater risk of incident CHD in women. The significant unfavourable DMGV-CHD relation persisted after adjusting for adherence to habitual diet quality and physical activity and was attenuated after adjusting for cardiometabolic abnormalities, such as adiposity and hypertension. In two independent NHS and WLVS populations, higher DMGV levels were related to more adverse cardiometabolic risk factor status. Our findings underscore the potential of plasma DMGV as a biomarker linking dietary habits and the long-term risk of CHD among women.
We found that plasma DMGV levels showed strong associations with dietary sodium and potassium intakes and energy-dense foods measured by the ‘gold standard’ 7DDR methods, suggesting DMGV as an early and diet-modifiable biomarker for the future incidence of CHD. Circulating metabolite DMGV has been implicated as a marker of poor metabolic response to cardiorespiratory fitness to improve metabolic abnormalities.4,5,38 We confirmed significant associations of DMGV with objectively measured total physical activity and cardiometabolic risk factors in the present study populations. Independently of the objectively measured total physical activity counts, we found robust associations between DMGV and dietary risk factors of CHD using data based on 2-week averaged 7DDRs. Greater intakes of CHD-related dietary factors (such as obesogenic energy-dense foods rich in fat, sugar-sweetened beverages, and added sugar intakes) were associated with higher DMGV levels. On the other hand, soluble, insoluble, and total dietary fibre intakes were related to lower levels of DMGV. The findings are consistent with previous observational studies and a study of mice.2,6 For example, diets rich in sucrose or fat significantly increased plasma DMGV concentrations in mice;6 consumption of sugar-sweetened beverages or vegetables (based on a 4-day web-based food record) was positively or negatively, respectively, related to DMGV levels in a cross-sectional study of young adults.2 We also found that greater intakes of other CVD nutrient risk factors (such as vitamin D and omega-3 fatty acids) were associated with lower DMGV levels and lower corresponding CHD risks. Sensitivity analysis on energy-adjusted nutrient intakes yielded similar associations, suggesting the significant relations between specific nutrients and DMGV levels even when total energy intake was constant. Further investigations are warranted to determine whether DMGV could serve as a marker for reducing CHD risk through preventive interventions focused on diet quality.
In recent studies, high DMGV levels were associated with obesity,39 and DMGV levels significantly decreased after bypass surgery for weight loss in a prior study.1 Our results of women are in line with those reported in a previous study of young men, suggesting that changes in DMGV levels are associated with increases in body fat, LDL cholesterol, and systolic blood pressure in response to exercise intervention.38 Genetic studies found common variants in the AGXT2 associated with heart rate variability13 and blood pressure,7 and AGXT2-deficient mice developed hypertension with elevated levels of a DMGV precursor metabolite.7 In other studies, the association of DMGV with CAD was attenuated after adjusting for traditional metabolic risk factors, such as hypertension, dyslipidaemia, and diabetes.2,15 A case–control cohort study2 on CAD reported that plasma DMGV levels were higher in participants who developed CAD during follow-up time (about 7 years) than in the control group, but the association became non-significant after adjusting for traditional cardiometabolic risk factors. Their additional analysis in a population-based cohort showed a largely attenuated association between DMGV and CAD after adjusting for cardiometabolic risk factors (hazard ratio of 1.12 per 1 SD of DMGV; P = 0.053).2 Based on our results and other studies, DMGV might be a potential biomarker of unhealthy dietary intakes (particularly food/nutrients related to obesity and CVD) and could be a very early marker of cardiometabolic dysfunction. We observed that the unfavourable relation between DMGV and long-term risk of incident CHD was attenuated by cardiometabolic risk factor status, such as greater adiposity and hypertension at baseline. In the WLVS, as in NHS, having adverse cardiometabolic risk factor status and greater adiposity was related to higher DMGV levels, suggesting that underlying metabolic conditions might have influenced high DMGV levels, contributing to an increased risk of CHD.
Although our study cannot determine the detailed biological mechanisms for the observations, existing evidence has shown strong linkages between DMGV-related pathways and CHD or CVD.8–12 A study has shown that DMGV is a biomarker for predicting type 2 diabetes even after adjusting for BMI and baseline fasting glucose.1 We also found significant associations between DMGV and insulin secretion–related makers in participants without diabetes. In addition, DMGV was related to acute insulin secretion and various lipid profiles in a previous study.4 DMGV is formed via the transamination of ADMA via the enzyme AGXT2, and ADMA has been shown to be related to increased risks of CVD and CHD in a meta-analysis of prospective studies.10 Increased conversion of ADMA to DMGV is hypothesized to be due to decreased levels of β-aminoisobutyric acid in cardiometabolic disease, a substrate of AGXT2, which activates adipose tissue browning and leptin response.12 Significant inverse correlations between adiponectin and DMGV were also found in the present WLVS participants.
There are several strengths in this study. We measured DMGV in two cohorts with adequate incident cases, with long-term prospective follow-ups and comprehensive assessments of cardiometabolic factors. The use of two repeated dietary assessments based on the ‘gold standard’ 7DDRs, incorporating seasonal variability, also enhances the robustness of our findings on DMGV and the absolute intakes of nutrients and food items. However, there are also several potential limitations. There may still be unmeasured endogenous or exogenous confounding factors that affect DMGV levels, and there also might be residual or unmeasured confounding factors for CHD incidence. Although our study samples were stored at ultra-low temperatures to limit degradation effects during long-term storage, any susceptibility of our plasma metabolite levels to these effects would be expected to affect all samples uniformly, regardless of their case–control status. Our observational study cannot establish causality; further investigations are needed to clarify causal relationships, such as by examining temporal changes in plasma DMGV levels and exploring detailed biological pathways. Our study included women only, and biological sex might affect circulating DMGV levels.2 In addition, all participants were health professionals. Whether our findings could be applicable to other populations needs to be further investigated, especially in male cohorts and a population more representative of the US population.
In conclusion, high plasma DMGV levels, indicating unfavourable CVD-related dietary intakes, were associated with a higher risk of CHD among women. Additionally, our results from independent populations showed that higher plasma DMGV levels were related to more adverse cardiometabolic status. Further investigations are warranted to explore causal relationships and potential risks of CHD and cardiometabolic abnormalities associated with temporal changes in plasma DMGV levels.
Supplementary material
Supplementary material is available at Cardiovascular Research online.
Authors’ contributions
Y.H. contributed to the study concept, statistical analysis, and interpretation of data, drafting, and revising the manuscript. X.W. and M.K. contributed to the analysis and interpretation of data and revising the manuscript. S.T., J.D.W., M.A., and M.J. contributed to measurements and revising the manuscript. K.M.R. and Q.S. contributed to data collection, interpretation of data, and revising the manuscript. J.E.M. and L.Q. contributed to the study concept, data acquisition, interpretation of data, drafting and revising the manuscript, funding, and study supervision. All authors contributed to the manuscript and approved the final version and have access to all data in the present study. The corresponding authors Y.H. and L.Q. take responsibility for the integrity of the data of the work as a whole.
Acknowledgements
We appreciate all the participants of the Nurses’ Health Study (NHS) and Women’s Lifestyle Validation Study (WLVS) for their continued cooperation. We thank the Channing Division of Network Medicine, Department of Medicine, Brigham and Women’s Hospital and Harvard Medical School for their assistance.
Funding
The study is supported by National Institutes of Health grants from the National Cancer Institute (UM1 CA186107, CA49449, U01 CA176726, and R01 CA67262), the National Heart, Lung, and Blood Institute (R01 HL034594, R01 HL088521, HL071981, HL126024), the National Institute of Diabetes and Digestive and Kidney Diseases (DK091718, DK100383, DK115679), and National Institute of General Medical Sciences (2P20GM109036-06A1, Sub-Project ID 7233), and awards from the Tulane University (Tulane Research Centers of Excellence Awards). Y.H. was a recipient of a Grant-in-Aid for Scientific Research award and a Postdoctoral Fellowship for Research Abroad award from the Japan Society for the Promotion of Science (JSPS), and American Heart Association (AHA) postdoctoral fellowship award (19POST34380035). The sponsors had no role in the design or conduct of the study. The content is solely the responsibility of the authors and does not necessarily represent the official views of the National Institutes of Health.
Data availability
Datasets generated during and/or analyzed during the current study are not publicly available but are available upon reasonable request. Further information, including that on the procedures to obtain and access data, can be accessed at: https://www.nurseshealthstudy.org/researchers.
References
Author notes
Conflict of interest: The authors declare no conflict of interest associated with this manuscript. M.A. received the NIH grant, K08HL166950. S.T. is a co-founder and an employee at Sapient Bioanalytics. J.D.W. is an employee at Sapient Bioanalytics and holds equity in the company. M.J. holds an executive position and equity in Sapient Bioanalytics, LLC (SanDiego, CA, USA).
